
Abstract
Activated carbon was prepared from date pits via chemical activation with H3PO4. The effects of activating agent concentration and activation temperature on the yield and surface area were studied. The optimal activated carbon was prepared at 450 °C using 55 % H3PO4. The prepared activated carbon was characterized by Fourier transform infrared spectroscopy, scanning electron microscopy, thermogravimetric-differential thermal analysis, and Brunauer, Emmett, and Teller (BET) surface area. The prepared date pit-based activated carbon (DAC) was used for the removal of bromate (BrO3 −). The concentration of BrO3 − was determined by ultra-performance liquid chromatography-mass tandem spectrometry (UPLC-MS/MS). The experimental equilibrium data for BrO3 − adsorption onto DAC was well fitted to the Langmuir isotherm model and showed maximum monolayer adsorption capacity of 25.64 mg g−1. The adsorption kinetics of BrO3 − adsorption was very well represented by the pseudo-first-order equation. The analytical application of DAC for the analysis of real water samples was studied with very promising results.
Introduction
Activated carbon is an efficient adsorbent which has been extensively used in the treatment of various types of pollutants, due to its large surface area, highly developed porosity, and abundance of surface functional groups (Alhamed and Bamufleh 2009). Nonetheless, owing to the high cost of production, these materials are considered to be more expensive than other adsorbents (Bouhamed et al. 2012). Subsequently, the production of activated carbons using cheap, safe, and easily accessible precursors is a growing research interest in these days. Several suitable agricultural by-products such as walnut shells (Gomez-Serrano et al. 2002), cherry pits (Martinez et al. 2006), oil palm pits (Sentorun-Shalaby et al. 2006), olive pits (Rios et al. 2006), apricot pits (Youssef et al. 2005), date pits (Haimour and Emeish 2006; Merzougui and Addoun 2008; Reddy et al. 2012), almond shells (Toles et al. 2000), sugarcane bagasse (Erlich et al. 2006), and cotton stalks (Putun et al. 2006) have been used as the precursor for the production of activated carbon. The activated carbon’s adsorption capacity mainly depends on their production methods and initial structural properties. Activated carbon can be developed by chemical or physical activation. Physical activation takes place in two steps: first carbonization (below 700 °C) and subsequently controlled gasification in the presence of oxidizing gases at high temperature (up to 1,100 °C) (Sekirifa et al. 2013). Chemical activation refers to the carbonization of the precursor after addition of any activating agents (H3PO4, ZnCl2, etc.) that control the formation of tar. But chemical activation is better than physical activation due to its simplicity, higher yield, development of the good porous structure, shorter activation time, and lower temperature (Ahmed and Theydan 2012). Among the agricultural wastes, date pits are one of the best materials because they are inexpensive and abundantly available, specifically in Mediterranean countries (Ahmed and Theydan 2012). Hamada et al. (2002) and Haimour and Emeish (2006) have found that date pits comprise around 10 % in weight of the fruit. The major components of date pits are hemicellulose (18 %), cellulose (42 %), lignin (11 %), sugar and other compounds (25 %), and 4 % ash. This lignocellulosic composition encourages the preparation of activated carbon from these precursors (Bouchelta et al. 2008). Saudi Arabia is one of the leading date-producing countries that yields around 830,000 t of dates per annum which give a minimum of 83,000 metric tons of date pits (Bouhamed et al. 2012). A reasonable fraction of this quantity can be retrieved easily from date-processing plants and can be utilized as a raw material for activated carbon production (Alhamed 2009). Therefore, the aim of this study was to prepare activated carbon using date pits via chemical activation using H3PO4. Various samples of date pit-based activated carbon (DAC) were prepared by changing the activation temperature (250 to 750 °C) and concentration of activating agents (25 to 85 %). The efficiency and the quality of DAC were evaluated on the basis of S BET and percentage of yield of DAC. The DAC, which was prepared at the optimum conditions, was used for the adsorptive removal of bromate (BrO3 −) from water samples which is recognized to be a probable human carcinogen. The main effects of BrO3 − include cancer, abdominal pain, vomiting, nausea, diarrhea, hemolytic anemia, varying degrees of central nervous system depression, and pulmonary edema (Campbell 2006). BrO3 − is a by-product which is formed due to the disinfection of drinking water using chlorine dioxide (ClO2 −) or ozone. In ozonation process, bromide ions which are naturally present in the water oxidized to hypobromous acid and hypobromite which are further oxidized to bromate by ozone and/or hydroxyl radicals (Zeino et al. 2014). The formation of BrO3 − in the water samples takes place as (Bonacquisti 2006):
Generally, the level of BrO3 − in drinking water varies from 0.4 to 100 μg L−1 (Butler et al. 2005). Recently, European Commission (EC) and World Health Organization (WHO 2011) have recommended the maximum contaminant level (MCL) 10 μg L−1 bromate in drinking water, and it has already been implemented in the countries like Japan, Canada, China, USA, and UK. Relating to the toxicological effects of BrO3 −, it is required to minimize the BrO3 − concentration to the acceptable limit in drinking water before being supplied for its intended applications. Several biological, physical, and chemical methods have been implemented to remove the bromate from aqueous solution, but adsorption process appears to be the most attractive, economical, simple, and environment-friendly (Chen et al. 2014; Molina-Sabio et al. 1995; Molina-Sabio and Rodríguez-Reinoso 2004; Marsh and Rodriguez-Reinoso 2006; Kamaraj et al. 2014, 2015; Kamaraj and Vasudevan 2015; Lakshmi and Vasudevan 2013; Ganesan et al. 2013a, b). The effect of several operating parameters such as pH, equilibration time, initial BrO3 − concentration, and temperature on the adsorption of BrO3 − onto DAC was investigated. The concentration of BrO3 − was evaluated using ultra-performance liquid chromatography-tandem mass spectrometry (UPLC-MS/MS) (Alsohaimi et al. 2012). The adsorption kinetic, isotherm, and thermodynamic aspects for the removal of BrO3 − were explored. Adsorption, desorption, and regeneration studies of DAC were also carried out. The analytical applicability of DAC was established for the BrO3 − removal from various bottled water samples.
Experimental
Chemicals and materials
Date pits were collected from the local supermarket in Riyadh, Saudi Arabia and used as the precursor for activated carbon preparation. Potassium bromate, phosphoric acid (85 %), formic acid, and all other chemicals were of analytical reagent grade. The stock solution of KBrO3 (10 mg mL−1) was prepared in Milli-Q water (free from BrO3 −) and used for further dilutions. Polyvinylidene fluoride (PVDF) syringe filter (0.22 μm) was used to filter the standards and samples before being injected into the UPLC-MS system.
Instrumentation and MS conditions
BrO3 − separation was carried out on a UPLC technique which was equipped with a quaternary pump (Waters, Milford, USA). The analytical column Acquity BEH C18 has a of dimension 50 mm × 2.1 mm i.d.; 1.7 μm particle size was used (Waters, Milford, MA, USA). The most favorable separation of the target analyte was accomplished with a mobile phase (Milli-Q water (99.9 %) and 0.1 % formic acid). The mobile phase flow rate and sample injection volume were 200 μL min−1 and 5 μL, respectively. The UPLC instrument was equipped to a mass spectrometer (triple quadrupole) (Micromass, Milford, MA, USA) consisting of electrospray ionization (ESI) source. The mass spectrometer was operated in the negative ionization mode, and the values were accomplished in multiple reaction monitoring (MRM) mode. The most favorable ESI source running parameters were as follows: source temperature (120 °C), desolvation temperature (350 °C), cone voltage (−30 V), capillary voltage (−3.0 kV), desolvation gas flow rate (600 × 103 mL h−1), and cone gas flow rate (60 × 103 mL h−1). Argon and nitrogen of high purity were applied as collision and cone gases, correspondingly. The analysis data acquisition was accomplished using Waters MassLynx V4.1 software (Alsohaimi et al. 2012).
The other instruments used were Fourier transform infrared spectrometer (FTIR) (Nicolet 6700, Thermo Scientific, USA), thermogravimetric-differential thermal analysis (TGA-DTA) which was performed using thermogravimetric analyzer (SDT Q 600 TA instrument, USA), high-performance scanning electron microscope (JSM-6380 LA, Tokyo, Japan), and Gemini VII 2390 surface area and pore size analyzer (USA).
Preparation of activated carbon using date pits (DAC)
The date pits were chemically activated using H3PO4. The date pits were first washed with demineralized water to remove the impurities, dried at 100 °C for 24 h, crushed using disk mill, and sieved to 3 mm particle size. Thirty-five grams of crushed date pits was mixed thoroughly with 35 g H3PO4 solution (55 wt%) and heated at 100 °C (±5 °C) in an oven until complete evaporation. Carbonization of the impregnated material was done in a horizontal tube furnace (length 450 mm, i.d. 65 mm). The samples were kept into the reactor and heated at 170 °C (±5 °C) for 1 h under nitrogen flow (flow rate = 0.5 L min−1) and then at 450 °C (±5 °C) for 1 h at the same flow rate. After activation period, the samples were cooled down to room temperature in nitrogen flow and washed four to five times with Milli-Q water. Various samples of DAC were prepared by changing the activation temperature (250 to 750 °C) and the concentration of activating agents (25 to 85 %). The sample S-4 was selected for detailed studies due to its higher yield and better S BET among all samples. The prepared carbon was washed, dried, ground, and stored for the detailed studies.
Characterization of DAC
Textural properties of the samples were determined using the Gemini VII 2390 surface area and pore size analyzer at liquid nitrogen temperature 77 K. The Brunauer, Emmett, and Teller (BET) surface area was determined by the BET method using the adsorption isotherms (Gregg and Sing 1982). The samples were out-gassed at 150 °C under vacuum for 2 h before adsorption measurements. The cross-sectional area of nitrogen was taken 0.162 nm2. The total pore volume was determined by Barrett, Joyner, and Halenda (BJH) method from the amount of nitrogen adsorbed at P/Po 0.99 (Barrett et al. 1951). The mesopore volume was calculated by deducting the micropore volume from the total pore volume (Reinoso et al. 1995). The FTIR absorption spectra of raw date pits, DAC, and bromate adsorbed DAC were taken between 450 and 4,000 cm−1. For FTIR analysis, 10 mg dry sample was thoroughly mixed with 100 mg KBr and ground to a fine powder. A transparent disc was prepared by using a pressure of 80 psi in a humidity-free atmosphere. The TGA-DTA of raw date pits and DAC were performed at a heating rate of 10 °C min−1 up to 800 °C in nitrogen atmosphere. The surface morphology and elemental composition of the DAC before and after BrO3 − adsorption were evaluated using scanning electron microscopy combined with energy-dispersive X-ray (SEM-EDX) spectrometry.
Adsorption studies
Batch studies were performed for the adsorption of BrO3 − onto DAC. Fifty milligrams of DAC was shaken with 200 mL BrO3 − solution of known concentration in conical flask at 150 rpm to get the equilibration time. After equilibration time, BrO3 − was filtered using 0.22 μm filter and injected into UPLC-MS system to evaluate the BrO3 − concentration in the solution phase before and after adsorption. Several parameters such as pH, temperature, contact time, and initial BrO3 − concentration were altered to optimize the adsorption process. The effect of several competing anions, viz., nitrate (NO3 −), carbonate (CO3 2−) and sulfate (SO4 2−), on the adsorption of BrO3 − was also investigated.
The amount of adsorbed bromate, qe (mg g−1), was calculated as:
where Co and Ce are the initial and equilibrium concentrations of bromate in solution (mg L−1), respectively, V is the volume of solution (L), and m is the mass of the adsorbent (g).
Kinetic studies were accomplished by varying the BrO3 − concentration (C o, 2, 4, and 6 mg L−1). Isotherm and thermodynamic studies were evaluated by varying initial concentration of BrO3 − solution (1–10 mg L−1) and temperature (25–55 °C).
Desorption and regeneration studies
Desorption studies were also performed in batch mode. For this study, 50 mL of 2 mg L−1 BrO3 − solution was shaken with 50 mg of DAC in flask at 150 rpm for 25 min. After that, DAC was filtered off and washed various times with Milli-Q water to eliminate the extra BrO3 −. Then, DAC was shaken with 50 mL of sodium hydroxide solution of different concentrations (0.1–0.5 M) in flask at the aforesaid conditions. After 25 min, the solution was filtered, and the remaining concentration of BrO3 − in the solution phase was assessed by UPLC-MS/MS. The percent desorption of BrO3 − was calculated as:
When DAC was exhausted, it was regenerated using NaOH solution of different concentrations (0.1–0.5 M). For the regeneration study, 50 mg DAC was saturated with 50 mL of 2 mg L−1 BrO3 − solution for 25 min. Subsequently, DAC was washed with Milli-Q water to remove un-adsorbed BrO3 −. To regenerate the saturated DAC, it was treated with 50 mL of NaOH solution of optimum concentration. The same process was repeated for five successive cycles.
Sample analysis
For the real sample analysis, ten bottled water samples of different brands were obtained from Riyadh (Saudi Arabia) supermarket and stored at 4 °C until analysis. In these bottled water samples, the concentration of BrO3 − was labelled (<10 ng mL−1) by the corresponding companies. Fifty milliliters of each water sample was treated with 50 mg of DAC in conical flask at the optimum conditions (pH 4, time 25 min, and temperature 25 °C). After 25 min, the water samples were taken out from the shaker, filtered through 0.22 μm PVDF filter, and injected into UPLC-MS system. Blanks and quality controls were also analyzed in every batch.
Results and discussion
The DAC was prepared by chemical activation using H3PO4 as activating agent which is the most widely used impregnating agent due to some economical and environmental concerns (Guo and Straw 2007). There are some other activating agents like ZnCl2, KOH, CaCl2, NaOH, etc., but these activating agents have some shortcomings such as corrosion and ineffective chemical recovery, and the carbons produced using these agents cannot be applied in food and pharmaceutical industries as they may contaminate the product (Prahas et al. 2008). Once the date pits are mixed with concentrated H3PO4, it acts as an acid catalyst to encourage the bond cleavage reactions and formation of cross-links via cyclization and condensation (Haimour and Emeish 2006). After activation, several acidic functional groups were developed at the surface of activated carbon. Various samples of DAC were prepared by changing the activation temperature (250 to 750 °C) and concentration of activating agents (25 to 85 %). The efficiency and the quality of DAC samples were evaluated on the basis of S BET and percentage of yield (Fig. 1a). It was noted that the yield of DAC was decreased from 74.5 to 29.4 % with the increase in activation temperature from 250 to 750 °C which was owing to the loss of the volatile materials. This result was also confirmed by TGA-DTA result of raw date pits where weight loss was observed with increasing temperature. The specific surface area was also affected by the activation temperature (Fig. 1a). The surface area that increased with the increase in temperature up to 450 °C which was due to the decomposition of major components of date pits (cellulose and hemicellulose) resulted in the opening of more pores at higher temperature. After 550 °C, the surface area was decreased which might be due to the alteration of mesopores into macropores. Similar results were also obtained by Danish et al. (2014). There was not much more difference in the S BET at 450 and 550 °C but the yield was higher at 450 °C, so the temperature 450 °C was selected as the optimum temperature. The effect of H3PO4 concentration on the S BET was also studied, and it was found that S BET increased from 198 to 649 m2 g−1 when the concentration of H3PO4 was increased from 25 to 55 % (Fig. 1b). After 55 % concentration, further rise in the activating agent concentration decreased the surface area. Actually, highly concentrated H3PO4 destroyed the pore walls between the pores and thus caused the widening of the pores. When the pore size increases from mesopore to macropores, they do not contribute to the surface area considerably (Lazaro et al. 2007).

a Effect of activation temperature on S BET and percentage yield of DAC and b effect of activating agent concentration on the S BET of DAC
The N2 adsorption–desorption isotherms of DAC are given in Fig. S1. The DAC had a specific surface area of 653.11 m2 g−1 and showed a type IV adsorption–desorption isotherm which is corresponding to a mesospore material (ALOthman et al. 2013). According to the IUPAC classification (Sing et al. 1985), type IV isotherm is given by many mesoporous industrial adsorbents. The surface area, pore volume, and average pore diameter of DAC were 653.11 m2 g−1, 0.24 cm3 g−1, and 3.8 nm, respectively.
The above results showed that the most efficient activated carbon was prepared at these optimal conditions: 55 % H3PO4 and 450 °C activation temperature. The adsorption potential of activated carbon depends on the surface areas as well as on the surface chemical properties. From the Boehm titration results, it was found that the surface active sites had more acidic groups. The basic sites present were 0.82 meq g−1, while the total acidic sites were 2.25 meq g−1 (carboxylic 0.96 meq g−1, lactonic 0.43 meq g−1, phenolic 0.86 meq g−1). The FTIR spectra of raw date stone, activated carbon (DAC), and bromate adsorbed DAC are shown in Fig. 2. The raw date stone showed an intense band at 3,350 cm−1, attributed to the O–H stretching vibrations of alcoholic and adsorbed water groups (Duranoglu et al. 2010). The peaks occurred at 1,560 and 1,040 cm−1 were ascribed to C=C stretching vibration of aromatic rings and R–OH stretching of hydroxyl groups, respectively (Salman et al. 2011). The weak bands at 1,415 cm−1 demonstrated the presence of in-plane O–H in the carboxylic (ALOthman et al. 2012). The stretching vibrations of the C=O bond yield band at 1,680 cm−1, and the intensity of this band was decreased after activation with phosphoric acid due to dehydration effect of phosphoric acid (Gao et al. 2013). In DAC, the peak band at 1,060 cm−1 might be owing to the chain of P–O–P vibrations caused from the interaction of H3PO4 with the precursor molecule because H3PO4 was not completely removed by the simple water-washing (Liou 2010). It is clear from the FTIR spectra that after bromate adsorption, the intensity and position of the peaks (1,665, 1,590, and 3,340 cm−1) were changed, and a new Br–O peak has appeared at 877 cm−1 which demonstrated the adsorption of bromate onto DAC.

FTIR spectra (a) raw date stones, (b) DAC, and (c) BrO3 −-adsorbed DAC
Thermogravimetric and differential analyses (TGA-DTA) of raw date stone and DAC were performed which are given in Fig. 3. The first weight loss (6.32 %) at 150 °C was due to the elimination of moisture including free water, combined water, and low molecular weight volatile matters (Gao et al. 2013). The second weight loss (27.1 %) between 150 and 292 °C corresponded to the decomposition of hemicelluloses. Further weight loss (10.9 %) in the range of 292–465 °C might be due to the decomposition of celluloses. After 465 °C, there was very small weight loss which indicated the formation of ash and carbon. In the TGA-DTA curves of DAC, the first weight loss (2.9 %) was observed at 163 °C which was ascribed to moisture and volatile organic matters associated with the activated carbon during preparation (Danish et al. 2014). After 163 °C, only 6.6 % weight was lost up to 450 °C which was probably owing to loss of lignin and phosphate complexes.

TGA-DTA curves. a Raw date stones and b DAC
The scanning electron micrographs of raw date pits, DAC, and bromate adsorbed DAC are shown in Fig. 4a–f. The analysis of the initial structure of the raw date pits showed the presence of a few pores of different size and looking very rigid and compact surface (Fig. 4a). After H3PO4 activation, the surface of DAC became rough and many pores appeared on it (Fig. 4b–e). It was also interesting, as the concentration of H3PO4 increased, more porosity of DAC was observed which demonstrated that the impregnating agent (H3PO4) had important role to increase the specific surface area and development of porosity. After BrO3 − adsorption (Fig. 4f), the surface morphology of DAC was completely changed, and a white layer of BrO3 − could be clearly seen on the sponge-like pores of DAC. The EDX surface analysis of DAC showed that DAC had 67.6 % C, 18.8 % O, 7.2 % H, 6 % P, and low level of calcium (0.4 %) due to the ash content, while BrO3 − adsorbed DAC revealed 59.2 % C, 17.5 % O, 13.1 % Br, 5.4 % H, and 4.8 % P which confirmed the absorption of BrO3 − onto DAC.

SEM images. a Raw date stones, b DAC with 25 % H3PO4, c DAC with 35 % H3PO4, d DAC with 45 % H3PO4, e DAC with 55 % H3PO4, and f DAC after BrO3 − adsorption
Studies for the removal of BrO3 − by batch conditions
The effect of time on the adsorption of BrO3 − by DAC was investigated at different time intervals (10–120 min). It is apparent from Fig. S2a (supplementary material) that the adsorption was fast initially and became slow at later till the equilibrium was achieved. It was noted that 53 % bromate was removed in first 5 min, and equilibrium was established after 25 min where the adsorption was 96.8 %. Initially, all adsorbent sites were vacant so the adsorption was fast. Afterward, due to the decrease in number of adsorption sites at DAC and BrO3 − concentration as well as the repulsive forces between the adsorbed BrO3 − on the surface of DAC and BrO3 − in the solution phase, the uptake rate was decreased.
From Fig. 5a, b, it can be concluded that the UPLC-MS/MS bromate chromatogram relative intensity after 25 min (Fig. 5b) decreased up to 96.8 %.

UPLC-MS/MS chromatograms of BrO3 − a standard solution 2 μg L−1, b contact time 25 min, c pH 4, and d temperature 25 °C
The removal of bromate onto DAC was investigated in the pH range of 2–9. It can be seen from Fig. S2b that the adsorption of BrO3 − onto DAC was strongly pH dependent. The optimum adsorption of BrO3 − (96 %) was observed between 2 and 4. Nevertheless, as the pH was increased from 4 to 9, the BrO3 − removal was decreased from 96 to 39.7 % which might be due to the fact that as the pH increased, the OH− concentration was also increased in the solution phase which competes with BrO3 − as well as the electrostatic repulsion took place between BrO3 − ions and the negatively charged surface of DAC at high pH. A similar trend was also observed for the BrO3 − adsorption in the earlier reported studies (Chitrakar et al. 2009; Bhatnagar et al. 2009). If the solution pHs<pHpzc, surface becomes positively charged and could interact with negative species, while at pHs>pHpzc, adsorbent surface is negatively charged and interact with positive species (Khan et al. 2015). The pHpzc for the DAC was 3.5, so the adsorption of BrO3 − was high at pH<pHpzc. Xu et al. and Chen et al. have also reported the optimum adsorption of BrO3 − in pH range 3–10 and 2, respectively (Xu et al. 2012; Chen et al. 2010). Figure 5a, c shows the UPLC-MS/MS chromatograms of BrO3 − standard solution (2 μg mL−1) before adsorption and after adsorption at pH 4, respectively. The BrO3 − relative intensity after adsorption (Fig. 5c) was decreased up to 96 %.
The mechanism of BrO3 − anion removal by DAC can be proposed in two different ways:
-
1.
Adsorption of bromate and its reduction to hypobromite (OBr−) and bromide (Br−).
$$ \begin{array}{l}\mathrm{C}=\mathrm{C}+{{\mathrm{Br}\mathrm{O}}_3}^{-}\to {\mathrm{CO}}_2+{\mathrm{Br}\mathrm{O}}^{-}\hfill \\ {}\mathrm{C}=\mathrm{C}+2{\mathrm{Br}\mathrm{O}}^{-}\to {\mathrm{CO}}_2+2{\mathrm{Br}}^{-}\hfill \end{array} $$ -
2.
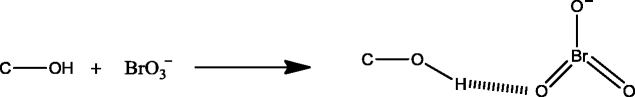
The adsorption of BrO3 − on the adsorbent (DAC) through hydrogen bonding like this:

The adsorption of BrO3 − onto DAC was studied at various initial BrO3 − concentration using optimum contact time (25 min) and pH (4). The adsorption of BrO3 − was decreased from 100 to 88 % as the BrO3 − concentration was increased from 1 to 10 mg L−1 which was due to the less accessibility of DAC adsorption sites for the higher dose of BrO3 − (Fig. S2c).
Temperature has a prominent effect on the adsorption capacity of activated carbon. The adsorption of BrO3 − was evaluated between 25 and 55 °C temperatures using pH 4, time 25 min, and BrO3 − concentration 2 mg L−1 (Fig. S2d). The adsorption of BrO3 − was decreased from 95.8 to 65.4 % as the temperature was increased from 25 to 55 °C. The decrease in the adsorption of BrO3 − with increasing temperature suggested weak interaction between DAC surface and BrO3 −. So, the adsorption was physical in nature. Figure 5a, d shows that the UPLC-MS/MS BrO3 − chromatogram relative intensity at 25 °C (Fig. 5d) decreased up to 95.8 %.
Desorption and regeneration studies
As the concentration of eluent (NaOH solution) was increased from 0.1 to 0.5 M, the desorption percentage of BrO3 − was decreased which might be due to the deterioration of DAC surface functional group at higher concentration of NaOH solution. So, 0.1 M NaOH solution was used as an eluent for the maximum recovery of BrO3 −. The performance of regenerated DAC was evaluated five times, and it was noted that the adsorption of DAC was decreased only 14.8 % after five successive cycles which demonstrated that DAC could be effectively regenerated and reused for the removal of BrO3 − from water samples (Fig. S3).
Influence of NO3 −, CO3 2−, and PO4 2− on BrO3 − adsorption
Several inorganic anions especially NO3 −, CO3 2−, and PO4 2− are usually found in the drinking water. The effect of these anions (NO3 −, CO3 2−, and PO4 2−) onto the adsorption of BrO3 − onto DAC was investigated. Fifty milligrams DAC was taken with 50 mL of solution which had 2 mg L−1 BrO3 − and 10 mg L−1 of any competing anions (NO3 −, CO3 2−, and PO4 2−). It is apparent from Fig. 6 that BrO3 − removal was 96.7 % without any competing anion. After the addition of NO3 −, CO3 2−, and PO4 2− anions individually, the BrO3 − removal was noted 95.2, 93.4, and 91.5 %, respectively. So, it can be concluded that the competing anions did not make any major effect on the bromate BrO3 −. So, DAC could be effectively used for BrO3 − removal from water samples even in the presence of these competing anions.

Effect of competing ions on the adsorption of BrO3 − DAC (equilibration time 25 min; adsorbent dosage 50 mg; volume 50 mL; initial concentration of BrO3 − 2 mg L−1; agitation speed 150 rpm)
Adsorption kinetics, isotherms and thermodynamic studies
The experimental data obtained for the adsorption of BrO3 − onto DAC in aqueous media were fitted to pseudo-first-order and pseudo-second-order models (Lagergren 1898; Ho and McKay 1998). The Langmuir and Freundlich adsorption isotherm models (Langmuir 1918; Freundlich 1906) were applied, and various thermodynamic parameters were also evaluated for the adsorption of BrO3 − onto DAC in the temperature range 298–328 K. The detailed information for the adsorption kinetic, isotherm, and thermodynamic studies is given in the supplementary material (Text S1).
The values of pseudo-first-order and pseudo-second-order rate constants (k 1 and k 2) were determined from the slopes of the plots log (qe − qt) versus t and t/qt versus time, respectively (Fig. S4a, b). The parameters for these two models are shown in Table 1. The high correlation coefficients (R 2) for pseudo-first-order model demonstrated that the data conformed well to the pseudo-first-order rate model which indicated the identical affinity for the BrO3 − and no transmigration of the BrO3 − on the surface of DAC
In the isotherm studies, the values of maximum monolayer adsorption capacity (q m) and energy of adsorption (b) were assessed from the intercept and slope of linear plots of 1/q e versus 1/C e, respectively (Table 2). It was noted that the values of q m decreased with the increase in temperature, and b values were smaller at higher temperatures which showed the exothermic nature of adsorption of BrO3 − onto DAC. The values of dimensionless equilibrium parameter (R L) were greater than zero and less than unity which showed the favorable adsorption of BrO3 − onto DAC. The maximum monolayer adsorption capacity (q m) of DAC for removal of BrO3 − was 25.64 mg g−1 at 298 K. A list for the comparison of maximum monolayer adsorption capacity for the removal of BrO3 − using various adsorbents (Xu et al. 2012; Naushad et al. 2014; Bhatnagar and Sillanpaa 2012; Chitrakar et al. 2011; Naushad et al. 2015) is given in Table 3, and it was found that DAC had the highest q m in comparison to other studied adsorbents reported in the literatures.
The values of Freundlich isotherm constants, n, and K f, were evaluated from the slope (1/n) and intercept (log K f) of the plot of log q e versus log C e, respectively. The values of n were greater than one which indicated the favorable adsorption of BrO3 − onto DAC. The isotherm constants calculated by fitting these two isotherm models (Fig. S4c, d) are given in Table 2. It can be inferred that the adsorption of BrO3 − onto DAC was well fitted by Langmuir equation with higher correlation coefficients (R 2 > 0.99), suggesting that the adsorption occurred identical and equivalent at a fixed number of definite sites.
The thermodynamic parameters such as Gibb’s free energy change (ΔG°), standard enthalpy change (ΔH°), and standard entropy change (ΔS°) were also evaluated for the adsorption of BrO3 − onto DAC in the temperature range 298–328 K. The values of ∆H° and ∆S° were calculated from the slopes and intercepts of the Van’t Hoff plot of lnK c versus 1/T (Fig. S5).
The values of ∆G°, ∆H°, and ∆S°, for the adsorption of BrO3 − onto DAC, are given in Table 4. It is clear from Table 4 that the values of ∆H° were negative which indicated the exothermic nature of the adsorption. The negative values of ∆G° indicated the degree of spontaneity of the adsorption process, and the values of ΔG° were decreased with the increase in temperature from 298 to 328 K, showing that lower temperature favored the BrO3 −adsorption onto DAC.
Analysis of bottled water samples
The applied usefulness of DAC was established for the adsorption of BrO3 − from drinking bottled water samples. Ten samples of bottled water of different companies were taken in the study. Table 5 shows the concentration of BrO3 − in the water samples, BrO3 − label claimed from the company, and level of BrO3 − after adsorption process. The level of BrO3 − in all water samples was less than 10 ng mL−1 before adsorption (Table 5). But after adsorption, BrO3 − was not detected due to complete adsorption of BrO3 − by DAC.
Conclusions
In the present study, Saudi date pits were used as a precursor for the preparation of activated carbon using H3PO4 as an activating agent. It was observed that the DAC characteristics depended on the activation process and the nature of the chemical reagent. The most efficient activated carbon was obtained at the activation temperature of 450 °C and 55 % H3PO4 concentration. The effectiveness of DAC was performed for the removal of BrO3 − from aqueous medium which adsorbed 96 % BrO3 − within 25 min. The sorption efficiency was also affected by the solution pH, and the maximum BrO3 − adsorption was found at pH 4. The equilibrium adsorption data of BrO3 − onto DAC was well represented by Langmuir isotherm model, showing maximum adsorption capacity of 25.64 mg g−1. Kinetic results designated that the adsorption process could be defined by the pseudo-first-order kinetic model under the investigated concentration range. The thermodynamic studies showed that the adsorption process was spontaneous and exothermic. The high regeneration efficiency was achieved using 0.1 M NaOH solution. The present study concluded that date pit-derived activated carbon prepared under these conditions may be used effectively for the removal of BrO3 − from drinking water.
References
Ahmed MJ, Theydan SK (2012) Physical and chemical characteristics of activated carbon prepared by pyrolysis of chemically treated date pits and its ability to adsorb organics. Powder Technol 229:237–245
Alhamed YA (2009) Adsorption kinetics and performance of packed bed adsorber for phenolremoval using activated carbon from dates’ pits. J Hazard Mater 170:763–770
Alhamed YA, Bamufleh HS (2009) Sulfur removal from model diesel fuel using granular activated carbon from dates’ pits activated by ZnCl2. Fuel 88:87–94
ALOthman ZA, Ali R, Naushad M (2012) Hexavalent chromium removal from aqueous medium by activated carbon prepared from peanut shell: adsorption kinetics, equilibrium and thermodynamic studies. Chem Eng J 184:238–247
ALOthman ZA, Naushad M, Ali R (2013) Kinetic, equilibrium isotherm and thermodynamic studies of Cr(VI) adsorption onto low-cost adsorbent developed from peanut shell activated with phosphoric acid. Environ Sci Pollut Res 20:3351–3365
Alsohaimi IH, Alothman ZA, Khan MR, Abdalla MA, Busquets R, Alomary AK (2012) Determination of bromate in drinking water by ultra–performance liquid chromatography–tandem mass spectrometry. J Sep Sci 35:2538–2543
Barrett EP, Joyner LC, Halenda PH (1951) The determination of pore volume and area distribution in porous substances. J Am Chem Soc 73:373–380
Bhatnagar A, Sillanpaa M (2012) Sorption studies of bromate removal from water by nano-Al2O3. Sep Sci Technol 47:89–95
Bhatnagar A, Choi YH, Yoon YJ, Shin Y, Jeon BH, Kang JW (2009) Bromate removal from water by granular ferric hydroxide (GFH). J Hazard Mater 170:134–140
Bonacquisti TP (2006) A drinking water utility’s perspective on bromide, bromate, and ozonation. Toxicology 221:145–148
Bouchelta C, Medjram MS, Bertrand O, Bellat JP (2008) Preparation and characterization of activated carbon from date pits by physical activation with steam. J Anal Appl Pyrolysis 82:70–77
Bouhamed F, Elouear Z, Bouzid J (2012) Adsorptive removal of copper(II) from aqueous solutions on activated carbon prepared from Tunisian date stones: equilibrium, kinetics and thermodynamics. J Taiwan Inst Chem Eng 43:741–749
Butler R, Godley A, Lytton L, Cartmell E (2005) Bromate environmental contamination: review of impact and possible treatment. Crit Rev Environ Sci Technol 35:193–217
Campbell KC (2006) Bromate-induced ototoxicity. Toxicology 221:205–211
Chen H, Xu Z, Wan H, Zheng J, Yin D, Zheng S (2010) Aqueous bromate reduction by catalytic hydrogenation over Pd/Al2O3 catalysts. Appl Catal B Environ 96:307–313
Chen R, Yang Q, Zhong Y, Li X, Liu Y, Li X-M, Du W-X, Zeng G-M (2014) Sorption of trace levels of bromate by macroporous strong base anion exchange resin: influencing factors, equilibrium isotherms and thermodynamic studies. Desalination 344:306–312
Chitrakar R, Tezuka S, Sonoda A, Sakane K, Hirotsu T (2009) Bromate ion-exchange properties of crystalline akaganeite. Ind Eng Chem Res 48:2107–2112
Chitrakar R, Makita Y, Sonoda A, Hirotsu T (2011) Adsorption of trace levels of bromate from aqueous solution by organo-montmorillonite. Appl Clay Sci 51:375–379
Danish M, Hashim R, Ibrahim MNM, Sulaiman O (2014) Optimized preparation for large surface area activated carbon from date (Phoenix dactylifera L.) stone biomass. Biomass Bioenergy 61:167–178
Duranoglu D, Trochimczuk AW, Bekera UA (2010) Comparison study of peach stone and acrylonitrile-divinylbenzene copolymer based activated carbons as chromium(VI) sorbents. Chem Eng J 165:56–63
Erlich C, Bjornbom E, Bolado D, Giner M, Fransson TH (2006) Pyrolysis and gasification of pellets from sugar cane bagasse and wood. Fuel 85:1535–1540
Freundlich HMF (1906) Over the adsorption in solution. J Phys Chem 57:385–470
Ganesan P, Kamaraj R, Vasudevan S (2013a) Application of isotherm, kinetic and thermodynamic models for the adsorption of nitrate ions on graphene from aqueous solution. J Taiwan Inst Chem Eng 44:808–814
Ganesan P, Lakshmi J, Sozhan G, Vasudevan S (2013b) Removal of manganese from water by electrocoagulation: adsorption, kinetics and thermodynamic studies. Can J Chem Eng 91:448–458
Gao Y, Yue Q, Gao B, Sun Y, Wang W, Li Q, Wang Y (2013) Preparation of high surface area-activated carbon from lignin of papermaking black liquor by KOH activation for Ni(II) adsorption. Chem Eng J 217:345–353
Gomez-Serrano V, Alvarez PM, Jaramillo J, Beltran FJ (2002) Formation of oxygen structures by ozonation of carbonaceous materials prepared from cherry stones: II. Kinetic study. Carbon 40:523–529
Gregg SJ, Sing KSW (1982) Adsorption, surface area and porosity. Academic, New York
Guo Y, Straw DAR (2007) Physicochemical properties of carbons prepared from pecan shell by phosphoric acid activation. Bioresour Technol 98:1513–1521
Haimour NM, Emeish S (2006) Utilization of date stones for production of activated carbon using phosphoric acid. Waste Manag 26:651–660
Hamada JS, Hashim IB, Sharif FA (2002) Preliminary analysis and potential uses of date pits in foods. Food Chem 76:135–137
Ho YS, McKay G (1998) Sorption of dye from aqueous solution by peat. Chem Eng J 70:115–124
Kamaraj R, Vasudevan S (2015) Decontamination of selenate from aqueous solution by oxidized multi-walled carbon nanotubes. Powder Technol 274:268–275
Kamaraj R, Davidson DJ, Sozhan G, Vasudevan S (2014) Adsorption of 2, 4-dichlorophenoxyacetic acid (2, 4-D) from water by in situ generated metal hydroxides using sacrificial anodes. J Taiwan Inst Chem Eng 45:2943–2949
Kamaraj R, Davidson DJ, Sozhan G, Vasudevan S (2015) Adsorption of herbicide 2-(2,4-dichlorophenoxy)propanoic acid by electrochemically generated aluminum hydroxides: an alternative to chemical dosing. RSC Adv 5:39799–39809
Khan MA, ALOthman ZA , Naushad M, Khan MR, Luqman M (2015) Adsorption of methylene blue on strongly basic anion exchange resin (Zerolit DMF): kinetic, isotherm, and thermodynamic studies. Environ Sci Pollut Res 53:515–523
Lagergren S (1898) About the theory of so called adsorption of soluble substances. Kungliga Svenska Vetenskapsakademiens Handlingar Band 24:1–39
Lakshmi J, Vasudevan S (2013) Graphene—a promising material for removal of perchlorate (ClO4 −) from water. Environ Sci Pollut Res 20:5114–5124
Langmuir I (1918) The adsorption of gases on plane surfaces of glass, mica and platinum. J Am Chem Soc 40:1361–1403
Lazaro MJ, Galvez ME, Artal S, Palacios JM, Moliner R (2007) Preparation of steam-activated carbons as catalyst supports. J Anal Appl Pyrolysis 78:301–315
Liou TH (2010) Development of mesoporous structure and high adsorption capacity of biomass-based activated carbon by phosphoric acid and zinc chloride activation. Chem Eng J 158:129–142
Marsh H, Rodriguez-Reinoso F (2006) Activated carbon. Elsevier, Amsterdam
Martinez ML, Torres MM, Guzman CA, Maestri DM (2006) Preparation and characteristics of activated carbon from olive stones and walnut shells. Ind Crop Prod 23:23–28
Merzougui Z, Addoun F (2008) Effect of oxidant treatment of date pit activated carbons application to the treatment of waters. Desalination 222:394–403
Molina-Sabio M, Rodríguez-Reinoso F (2004) Role of chemical activation in the development of carbon porosity. Colloids Surf A Physicochem Eng Asp 241:15–25
Molina-Sabio M, Rodríguez Reinoso F, Caturla F, Sellés MJ (1995) Porosity in granular carbons activated with phosphoric acid. Carbon 33:1105–1113
Naushad M, ALOthman ZA, Khan MR, Wabaidur SM (2013) Removal of bromate from water using de-acidite FF-IP resin and determination by ultra-performance liquid chromatography-tandem mass spectrometry. Clean Soil Air Water 41:528–533
Naushad M, Khan MR, ALOthman ZA, Awual MR (2015) Bromate removal from water samples using strongly basic anion exchange resin Amberlite IRA-400: kinetics, isotherms and thermodynamic studies. Desalin Water Treat. doi:10.1080/19443994.2015.1005157
Prahas D, Kartika Y, Indraswati N, Ismadji S (2008) Activated carbon from jackfruit peel waste by H3PO4 chemical activation: characterization of activated carbon prepared by phosphoric acid activation of olive pits, pore structure and surface chemistry characterization. Chem Eng J 140:32–42
Putun E, Uzun BB, Putun AE (2006) Fixed-bed catalytic pyrolysis of cotton-seed cake: effects of pyrolysis temperature, natural zeolite content and sweeping gas flow rate. Bioresour Technol 97:701–710
Reddy KSK, Al-Shoaibi A, Srinivasakannan C (2012) A comparison of microstructure and adsorption characteristics of activated carbons by CO2 and H3PO4 activation from date palm pits. New Carbon Mater 27:344–351
Reinoso FR, Molina-Sabio M, Gonzalez MT (1995) The use of steam and CO2 as activating agents in the preparation of activated carbons. Carbon 33:15–23
Rios RVRA, Martinez-Escandell M, Molina-Sabio M, Rodriguez-Reinoso F (2006) Carbon foam prepared by pyrolysis of olive stones under steam. Carbon 44:1448–1454
Salman JM, Njoku VO, Hameed BH (2011) Bentazon and carbofuran adsorption onto date seed activated carbon: kinetics and equilibrium. Chem Eng J 173:361–368
Sekirifa ML, Hadj-Mahammed M, Pallier S, Baameur L, Richard D, Al-Dujaili AH (2013) Preparation and characterization of an activated carbon from a date pits variety by physical activation with carbon dioxide. J Anal Appl Pyrolysis 99:155–160
Sentorun-Shalaby C, Ucak-Astarlıoglu MG, Artok L, Sarici C (2006) Preparation and characterization of activated carbons by one-step steam pyrolysis/activation from apricot stones. Microporous Mesoporous Mater 88:126–134
Sing KSW, Everett DH, Haul RAW, Moscou L, Pierotti RA, Rouquerol J, Siemieniewska T (1985) Reporting physisorption data for gas/solid systems with special reference to the determination of surface area and porosity. Pure Appl Chem 57:603–619
Toles CA, Marshall WE, John MM, Wartelle LH, McAloon A (2000) Acid-activated carbons from almond shells: physical, chemical and adsorptive properties and estimated cost of production. Bioresour Technol 71:87–92
WHO (2011) Guideline for drinking-water quality, second addendum to fourth edition
Xu C, Shi J, Zhou W, Gao B, Yue Q, Wang X (2012) Bromate removal from aqueous solutions by nano crystalline akaganeite (β-FeOOH)-coated quartz sand (CACQS). Chem Eng J 187:63–68
Youssef AM, Radwan NRE, Abdel-Gawad I, Singer GAA (2005) Textural properties of activated carbons from apricot stones. Colloids Surf A Physicochem Eng Asp 252:143–151
Zeino A, Abulkibash A, Khaled M, Atieh M (2014) Bromate removal from water using doped iron nanoparticles on multiwalled carbon nanotubes (CNTS). J Nanomater 2014:1–9
Acknowledgments
This project was funded by the National Plan for Science, Technology and Innovation (MAARIFAH), King Abdulaziz City for Science and Technology, Kingdom of Saudi Arabia (Award Number 12-WAT3138-02).
Author information
Authors and Affiliations
Corresponding author
Additional information
Responsible editor: Angeles Blanco
Electronic supplementary material
Below is the link to the electronic supplementary material.
ESM 1
(DOCX 161 kb)
Rights and permissions
About this article

Cite this article
Naushad, M., Khan, M.R., ALOthman, Z.A. et al. Removal of BrO3 − from drinking water samples using newly developed agricultural waste-based activated carbon and its determination by ultra-performance liquid chromatography-mass spectrometry. Environ Sci Pollut Res 22, 15853–15865 (2015). https://doi.org/10.1007/s11356-015-4786-y
Received:
Accepted:
Published:
Issue Date:
DOI: https://doi.org/10.1007/s11356-015-4786-y