
Abstract
The Sharm El-Sheikh area is one of the most attractive touristic resorts in Egypt and in the world in general. The Sharm El-Shiekh area is located at the arid region of the South Sinai Peninsula, Egypt. Water desalination is considered the main freshwater supply for hotels and resorts. Scarcity of rainfall during the last decades, high pumping rates, disposal of reject brine water back into the aquifer, and seawater intrusion have resulted in the degradation of groundwater quality in the main aquifer. Water chemistry, stable isotopes, Seawater Mixing Index (SWMI), and factorial analyses were utilized to determine the main recharge and salinization sources as well as to estimate the mixing ratios between different end members affecting groundwater salinity in the aquifer. The groundwater of the Miocene aquifer is classified into two groups: group I represents 10 % of the total samples, has a moderately high saline groundwater, and is mostly affected by seawater intrusion. Group II represents 90 % of the total samples and has a high groundwater salinity due to the anthropological impact of the reject brine saline water deeper into the Miocene aquifer. The main groundwater recharge comes from the western watershed mountain and the elevated plateau while the seawater and reject brine are considering the main sources for groundwater salinization. The mixing ratios between groundwater recharge, seawater, and reject brine water were calculated using water chemistry and isotopes. The calculated mixing ratios of group I range between 25 and 84 % recharge groundwater to 75 and 16 % seawater, respectively, in groundwater located close to the western watershed mountain indicating further extension of seawater intrusion. However, the mixing percentages of group II range between 21 and 88 % reject brine water to 79 and 12 % seawater, respectively, in groundwater located close to the desalination plants. The outcomes and conclusion of this study highlight the importance of groundwater management to limit further groundwater deterioration of the Miocene groundwater aquifer and limit seawater intrusion along the coast.
1 Introduction
Sharm El-Shiekh is a major tourist city in South Sinai due to year-round sunshine and popular beaches. Sharm El-Shiekh is a coastal area, located in the southeastern part of the Sinai Peninsula (Fig. 1a) as a part of an arid region where rainfall is scarce and groundwater is insufficient to meet the water requirements for social and economic development in the area. In addition, the Miocene aquifer has a high salinity and desalination is considered the main source of freshwater for different purposes via 54 reverse osmosis (RO) plants (Lamei et al. 2009; UNESCO 2008). In Sharm El-Shiekh, the desalination plants are fed by seawater directly from the Gulf of Aqaba and indirectly from deep drilled groundwater wells tapping the Miocene aquifer, ranging in depth from 30 to 100 m. The total water capacity of the desalination plants in Sharm El-Shiekh exceeds 64,000 m3/day (Lamei et al. 2009). In the RO desalination processes, the feed water is split into freshwater (30–40 %) and so-called reject brine water (60–70 %), which contains most of the salts, dissolved minerals, and chemical waste products. In general, there are three common methods that have been used for brine water disposal (sea disposal, well injection, and evaporation ponds) (Glater and Cohen 2003). The most common method that has been used for the last decades in Sharm El-Shiekh is the injection well disposal method. In many cases, production wells are not far (less than 50 m) from brine disposal reject wells (60 m depth), consequently, raising the groundwater salinity of the intake water (Hafez and El Manharawy 2002). Reject brine water contains concentrated chemicals that cause damage and reef degradation in the National Park area in Sharm El-Shiekh area (UNEP/PERSGA 1997). In 1994, many verdicts were issued by the Egyptian Ministry of State for Environmental Affairs (EEAA) for forbidding brine disposal into the sea, but this law is not yet well enforced (MSEA 2006).

a Map of the study area. b Conceptual model showing the deterioration of Miocene groundwater aquifer in the Sharm El-Shiekh area due to seawater intrusion and reject brine disposal coming from desalination plants
The groundwater salinization problem is common in most coastal aquifers located in the arid region around the world (Eissa et al. 2013b; Batayneh et al. 2010; Batayneh 2006). In the Sharm El-Shiekh area, groundwater salinization is attributed to high pumping rates under scarce annual precipitation as well as reject brine water deep into the Miocene aquifer arising as groundwater salinization. Total energy requirements of the RO process increase strongly with feed solution salinity (Strathmann 2004; Walha et al. 2007), and desalination costs are four times greater than that of brackish water due to the increase of maintenance and energy costs per cubic meter (Miller 2003; Koussis et al. 2010). The simplified conceptual model diagram in Fig. 1b illustrates and summarizes the environmental impacts of reject brine water and seawater intrusion problems on the Miocene aquifer as a result of the desalination process and high pumping rates in the Sharm El-Shiekh area.
To understand the historic and current geochemical processes affecting groundwater conditions in the study area, groundwater geochemistry, stable isotopes, and statistical approaches were used to (1) characterize the natural seawater intrusion in the Miocene aquifers, (2) delineate groundwater recharge source(s) for groundwater, and (3) investigate the anthropological influence of brine disposal on groundwater quality.
2 Background
The study area extends as an elongated narrow coastal strip on the southwestern coast of the Gulf of Aqaba, on the extreme southern tip of the Sinai Peninsula (Fig. 1a). It is considered one of the most popular tourist destinations in the world due to its pleasant climate and geographical location. Sharm El-Shiekh is located between longitudes 34° 12′ and 34° 18′ east and latitudes 27° 40′ and 28° 00′ north (Fig. 1a). The climate in this region is extremely arid (Moore 1983; Abou Rayan et al. 2001) with scarce rainfall averaging 25 mm/year and thunder showers causing occasional intense flooding events. The average monthly daily temperature ranges between 17 °C in January and 32 °C in August, while the relative humidity ranges between 32 % in July and 48 % in December (El-Refeai 1992; Abd Allah 1999).
3 Geology and Hydrogeology
The study area is formed mainly of crystalline basement rocks (Said 1962) underlain by rocks ranging in age from Quaternary to Precambrian (EGSMA 1981; CONOCO 1987). The area is built mainly on Precambrian basement rocks forming the high rugged granite mountains (Aggour et al. 2000). Basement rocks are formed as a part of the Arabian-Nubian Shield, which includes older granite and younger granite (Bentor 1985; Stern 1994; Abu-Alam and Stüwe 2009; Sherif 2011; Sherif et al. 2013). Granitic rocks are dissected by numerous dike swarms and volcanic flows of different compositions, including mafic and felsic types (Abu-Alam et al. 2010; Farahat et al. 2011). The mineralogical compositions of the granitic rocks are amphiboles, plagioclase, biotite, quartz, and feldspars (Ghoneim et al. 2015).
The sedimentary rocks in the Sharm El-Shiekh area range in age from Miocene to Quaternary. They outcrop as scattered hill exposures at the southern part of the study area where graben fault blocks rest uncomfortably on the granitic rocks nearby the Sharm El-Sheikh town (EGSMA 1994). The Miocene succession, in the Sharm El-Shiekh area, is divided into two units, the Upper Miocene and the Lower Miocene with a total thickness 80.5 and 90 m, respectively (Shata 1969; Abdeltawab 2012). The Lower Miocene is composed of coarse-grained sandstone and red shales with conglomerate lenses and manganese oxides while the Upper Miocene is composed of limestone, dolomitic limestone with intercalations of coarse-grained sandstone, and shale (Shata 1969). At Gabal El-Safra, the Lower and Upper Miocene formations are resting uncomfortably directly over the basement complex (Fig. 2a) (EGSMA 1994; Shata 1969; El Manakhly et al. 1997).

a Geological map of the study area (modified after EGSMA 1981; CONOCO 1987). b Fence diagram for the subsurface cross section in the Miocene aquifer. c NE-SW hydrogeological cross section in the Miocene aquifer. The vertical electrical sounding (VES 1, 14) is after Abdallah and El Hefnawy (2002). The subsurface data for groundwater well sites 7, 12, 35, 30, 82, and 55 are obtained from the Ridgewood Egypt Company for Water Desalination
The Quaternary alluvial deposits are derived from the weathered products of the igneous rocks located upstream of the watershed mountain and from the Miocene sedimentary rock outcrops downstream south Um El Seed Plateau (El Manakhly et al. 1997). Quaternary deposits are represented by continental to littoral sediments made up of coralline limestone and alluvial deposits (Omara 1959). Quaternary deposits are composed of ill-sorted sub-rounded to sub-angular gravel, sand, silt, and clay that rest uncomfortably over the crystalline metamorphic and basement rocks (El Sayed et al. 1990).
In general, annual precipitations and flood storms represent the main source of freshwater resources in the Sinai Peninsula. The northern strip of Sinai receives the maximum amount of annual rainfall during the winter time of approximately 300 mm/year. This amount decreases southward until it reaches less than 25 mm/year at the Sharm El-Shiekh (El-Refeai 1992; RIGWA 1988; Moore 1983; Abou Rayan et al. 2001). Precipitation and runoff represent the main recharge sources for shallow groundwater aquifers in the Gulf of Aqaba drainage basin system (Himida 1997; El-Sayed 2006; Eissa et al. 2013b). Generally, in such arid areas, the total amount of annual groundwater recharge ranges between 5 and 20 % of total annual precipitations and flood storms (Desconnets et al. 1997; Wheater et al. 2010), which occurs in October and January each year (Cools et al. 2012; Himida 1997).
The Miocene aquifer is the main water-bearing formation in the Sharm El-Shiekh. Subsurface cross sections, from NE to SW (Fig. 2c), were built according to the subsurface lithology of three drilled wells (sites 30, 82, and 55) and one vertical electrical sounding (VES 14) located far away in the southwest (Abdallah and El Hefnawy 2002). The fence diagram in Fig. 2b has been constructed according to the subsurface lithology of three drilled wells (7, 12, 35) located in between VES 1 and VES 14. The upper layer in the cross section is formed mainly of surficial alluvial deposits mainly of sand and gravel. The upper layer of the Miocene aquifer composed mainly of fractured limestone ranges in thickness ranging from 10 to 40 m. The lower part of the Miocene aquifer is composed mainly of medium to coarse sandstone, where groundwater occurs under semi-confining conditions due to the presence of shale beds, ranging in thickness from 6 to 10 m (El-Refeai 1999). A field trip, which was carried out in November 2013, collected 58 groundwater samples from the study area and found that the depth of groundwater ranges from 14.5 to 62 m, while the total penetration depth ranges from 91 to 107 m (ESM 1).
The Sharm El-Shiekh area represents the outlet of drainage basins extending northward, where the drainage stream stem encountered the Miocene aquifer. In 1997, the static groundwater level ranged from 4.63 to 5.70 m above the sea mean level (El-Refeai 1999). The static groundwater depth declined from 42 to 75 m between July 1996 and March 2007 (Awwad et al. 2008). The average groundwater salinity showed an increase during the last decades: 27,550 mg/l in 1997; 33,000 mg/l in 2002; 34,000 mg/l in 2007 (El-Refeai 1999; Awwad et al. 2008); and finally 56,443 mg/l by the present authors in 2013.
4 Materials and Methods
4.1 Groundwater Sampling and Laboratory Analyses
One field trip was conducted in November 2013 for groundwater sampling and various field measurements. Chemical analyses of groundwater samples were carried out at the central laboratory of the Desert Research Center (DRC) in Cairo, Egypt. The collection, preservation, and analyses of the samples followed the standard methods of the American Society of Testing and Materials (ASTM 2002; Brown et al. 1970; AWWA 1971; Hem 1991; American Public Health Association (APHA) 1998, 1995).
The hydrogen ion concentration (pH) and electrical conductivity (EC) were measured in the field using portable pH and EC meters (Hanna Instruments, Ann Arbor, Michigan, USA), where EC was expressed in micro-Siemens per centimeter at 25 °C. EC and pH were measured in the field immediately after sampling. Before each measurement, the pH and EC meters were calibrated with reference solutions. The groundwater samples were collected in 1000-ml-capacity polyethylene bottles while groundwater samples for the isotope analyses were collected in 200-ml glass bottles. The groundwater samples were preserved and analyzed in the laboratory for major ions (Ca2+, Mg2+, Na+, K+, HCO3 −, CO3 −, SO4 2−, Cl−) using standard methods suggested by Rainwater and Thatcher 1960; Fishman and Friedman 1985, and American Public Health Association (APHA) 1995. Alkali metal ions sodium (Na+) and potassium (K+) were determined by a flame photometer (Jenway PFP 7). Total hardness (TH), CaCO3, and calcium (Ca2+) were determined titrimetrically using the standard EDTA procedures. Carbonate (CO3) and bicarbonate (HCO3 −) were analyzed by volumetric methods. Magnesium (Mg2+) was calculated from TH and Ca2+ contents. Chloride was estimated by AgNO3 titration. The turbid metric method was used for the analysis of sulfate (Guler and Thyne 2004). Total dissolved solids (TDSs) were computed by multiplying the EC (ds m−1) by a factor of 640 (Subramani et al. 2005). Halogens (I−, Br−) were measured potentiometrically by means of an analyzer (ion-selective electrode) using iodide and bromide electrodes, respectively, by Orion Research Incorporation, model 940. Standard solutions for the above analysis were prepared from the respective salts of analytical reagent grade. The obtained chemical data are expressed in milligram per liter (mg/l) or part per million (ppm). Analytical precision for the measurements of cations and anions, obtained from ionic balance error (IBE), was computed in terms of ions expressed in milliequivalent per liter. The value of IBE is observed to be within a limit of ±5 % (Domenico and Schwartz 1990). The results of all chemical analyses are TDS in milligram per liter, which can be determined as follows:
Ionic balance (IB) is the percentage difference between the cation and anion sum present in water. It is calculated as follows:
where TC = sum of the total cations and TA = sum of the total anions in milliequivalent per liter. An acceptable range for IB to confirm the water quality assessment is within ±5 (Hem 1991).
The 2H and 18O values are expressed as δ2H and δ18O in per mil (‰) deviation from the 2H/1H and 18O/16O ratios in a standard known as the Vienna Standard Mean Ocean Water (VSMOW), which is assigned δ2H and δ18O values of 0 ‰ (Gat and Gonfiantini 1981). The δ2H and δ18O samples were analyzed at the IT2 Isotope Tracer Technologies Inc. Laboratory in Waterloo, Canada, with a precision (two-sigma) of 2 and 0.2 ‰, respectively, using the methods described by Epstein and Mayeda (1953), Coplen et al. (1991), and Coplen (1994).
The saturation indices were determined using the hydrogeochemical equilibrium NETPATH model (Plummer et al. 1992), where the mineral saturation index is obtained from Eq. 3 (Garrels and Mackenzie 1967)
where IAP is the relevant ion activity product in a mineral dissolution reaction, which can be obtained by multiplying the ion activity coefficient γ i and composition concentration m i , and K is the equilibrium constant of mineral dissolution at a certain temperature.
4.2 Statistical Methods
-
1.
Calculation of SWMI
Statistical methods for chemical data were used in the coastal area to understand how geochemical processes influence groundwater quality. For quantitative estimates of the relative degree of seawater mixing with groundwater, a parameter called Seawater Mixing Index (SWMI) is proposed based on the concentrations of four major ions (Na+, Cl−, Mg2+, and SO4 2−) as follows:
$$ \mathrm{SMWI}= ax\frac{C\left(\mathrm{N}\mathrm{a}\right)}{T\left(\mathrm{N}\mathrm{a}\right)}+bx\frac{C\left(\mathrm{Mg}\right)}{T\left(\mathrm{Mg}\right)}+cx\frac{C\left(\mathrm{SO}4\right)}{T\left(\mathrm{SO}4\right)}+dx\frac{C\left(\mathrm{C}\mathrm{I}\right)}{T\left(\mathrm{C}\mathrm{l}\right)} $$(4)Park et al. 2005 estimated the constant factors a, b, c, and d according to the relative proportion of Na+, Mg2+, Cl−, and SO4 2− in seawater, respectively. Ti represents the calculated regional threshold values of selected ions, which can be estimated from the cumulative probability curves for each ion in a specific site. Ci is the measured ion concentration in milligrams per liter.
-
2.
Multivariate analysis
Multivariate analysis has been used to understand the complicity of hydrochemical processes affecting groundwater. In this study, statistical analysis was used to define the origin of chemical elements (major ions) using the 2.0 version of the KyPlot program developed by Yoshioka 2001.
5 Results and Discussion
5.1 Groundwater Chemistry and Salinization Origins
The chemical analyses listed in ESM 1 indicate a wide range of groundwater salinity, where the TDSs vary between 13,551 (site 17) and 75,487 mg/l (site 30) with an average of 56,443 mg/l. All groundwater samples exceed the guideline (1000 mg/l) for human drinking standard (WHO 2011). In Fig. 3, groundwater of low salinity is located toward the west, closer to the mountain blocks and the Um El-Seed plateau (sites 17, 40, 41, 61, and 63). On the other hand, groundwater of high salinity is located near the reject brine well sites, close to the coastal area (Fig. 3). Groundwater represents the main feed source for the desalination plants, with an increase in the daily pumping capacity from 12,000 m3/day in 1999 (El-Refeai 1999) to 64,000 m3/day in 2009 (Lamei et al. 2009). The total groundwater withdrawal exceeds the natural recharge, which is sourced from the mountain blocks. During the last decades, progressive developmental activities in Sharm El-Shiekh have resulted in an aggressive increase of groundwater withdrawal and consequently declining groundwater levels and deteriorating groundwater quality.

Map of well locations within the study area and ranges of groundwater salinity distributions
The major ion chemistry of groundwater is shown by the Piper trilinear diagram in Fig. 4a. The trilinear diagram (Piper 1953) shows the relative proportions of major ions, on a charge equivalent basis, for comparison and classification of the water samples independent of total concentrations (Hem 1989). All groundwater samples fall where the subdivision of alkaline metals exceeds alkaline earths and strong anions exceed weak acid anion, reflecting a sodium chloride water type.

The main processes controlling groundwater chemistry were assessed using Gibbs diagram (Gibbs 1970); inference from this plot shows that groundwater sites 17, 40, 41, 61, and 63, located in Um El-Seed plateau and close to the watershed, are slightly affected by mixing with sea and/or reject brine waters (Fig. 4b). These samples are categorized as group I, which represents 10 % of the total samples. The major ion chemical parameters of group I are in the order of Na+ > Ca2+ > Mg2+ and Cl− > SO4 2− > HCO3 − for cations and anions, respectively. The rest of groundwater samples (group II) are plotted between the reject brine water and seawater end members, which represent the main source for groundwater salinization of the Miocene aquifer due to mixing processes. Group II represents 90 % of the total samples where the major ion chemical parameters are in the order of Na+ > Mg2+ > Ca2+, with the same anionic order of group I. The chemical composition of all groundwater samples in the Miocene aquifer belongs to the hydrochemical facies, where Cl and Na are the dominant ions showing a complete resemblance to that of the saltwater due to the impact of marine conditions and the final stage of groundwater evolution (Sulin 1948).
The Van Wirdum diagram (Fig. 4c) gives a complementary insight to the impact of water–rock interactions on groundwater mineralization, as well as the different salinization source origins. This type of diagram relates the ionic ratio, IR = Ca2+ / (Ca2+ + Cl−), with concentrations expressed in milliequivalent per liter plotted against the total dissolved solid (TDS, mg/l) of the groundwater (Birke et al. 2010; Tanaskovic et al. 2012). The IR can be seen as a measure of the prevalence of Ca2+ among the cations and Cl− among the anions. Based on position within the diagram, the water samples can be classified considering three end members: recharge groundwater (i.e., sites 17 or 41), seawater, and disposal brine water (i.e., reject water, sites R1 to R13, inclusive). Figure 4c shows that most of the groundwater samples are plotted between the recharge groundwater, seawater, and disposal brine water end members. Those samples that lie closest to the original groundwater end member are located in the Um El-Seed plateau, which should be more influenced by water–rock interactions with slight mixing of seawater and reject brine water. However, the local geology of that particular area, which includes the near Um El-Seed plateau of marine terraces (cross section in Fig. 3a), is the main important source of the chemical imprint of these waters.
-
1.
Estimate mixing with different water
Geochemical data were used to estimate an index called SWMI which evaluates the relative mixing of recharge water, seawater, and reject brine water with groundwater into the Miocene aquifer. The probability distribution curves have great importance in dealing with the interpretation of geochemical data and the discrimination of processes affecting groundwater chemistry (Shaw 1961; Sinclair 1974, 1976). In Fig. 5a–d, the inflection points indicate the equivalent regional threshold value: Ti for Na+, Mg2+, Cl−, and SO4 2− ions (Mondal and Singh 2011; Kumar 2014). The inflection points are estimated according to the distribution probability curves, where the inflections are mainly attributed to groundwater mixing with seawater and/or reject brine water into the Miocene aquifer. The estimated focal threshold (Ti) value for different ions was 14,500 mg/l for Na+; 1360 mg/l for Mg2+; 27,913 mg/l for Cl−; and 3180 mg/l for SO4 2−. The constant factors a, b, c, and d were estimated according to the relative concentration of Na+, Mg2+, Cl−, and SO4 2−, in seawater, respectively (Park et al. 2005). The threshold concentrations (mg/l) in seawater are divided by the triple value of the maximum threshold ion concentration as arbitrary number (Cl = 27,913 mg/l, see Sect. 4.2 (Calculation of SWMI)). According to the Gulf of Aqaba’s water sample chemistry, factors a, b, c, and d were estimated to be 0.25, 0.06, 0.31, and 0.03. Using the relative concentration factors of a, b, c, and d and Ti values, in Eq. 4 defined in Sect. 4, the SWMI values can be calculated for individual wells.
Fig. 5 
Cumulative probability curves for the distribution of a Na+, b Mg2+, c Cl−, and d SO4 2− in groundwater of the Miocene aquifer. e Cross-plot of Seawater Mixing Index versus total dissolved solids of the studied groundwater samples
It was found that based on the SWMI, groundwater is classified into two groups (Fig. 5e). Group I (0.17 < SWMI < 0.51) has a moderately high saline groundwater (TDS ranges from 13,551 to 38,957 mg/l) and is located close to the watershed and the Um El-Seed plateau, and such sites (17, 21, 40, 41, 61, and 63) are most likely linked with mixing with seawater. Group II (0.64 < SWMI < 1.04) has a higher salinity than seawater and is mostly affected by reject brine water disposal deep into the aquifer. The TDS values range between 47,246 and 75,488 mg/l.
The SWMI shows a direct relationship between the concentrations of Cl− and Br− and EC in groundwater and can be considered an additional conservative factor. The SWMI can be used in the mass balance equation instead of chloride to calculate the mixing ratios between two different groundwaters to get the value of SWMI for the final water.
$$ (x){\mathrm{SWMI}}_{\left(\mathrm{Initial}\ \mathrm{water}\ 1\right)}+\left(1-x\right){\mathrm{SWMI}}_{\left(\mathrm{Initial}\ \mathrm{water}\ 2\right)}={\mathrm{SWMI}}_{\left(\mathrm{Final}\ \mathrm{water}\right)} $$(5)where x is the mixing ratio of initial water 1 and (1 − x) is the mixing ratio of initial water 2. In this article, the SWMI is used to estimate the mixing percentages between the three end members (dilute groundwater (site 17), seawater, and brine water) to produce the observed chemistry of the Miocene groundwater at different sites (Table 1). The calculated mixing percentages range between 25 and 84 % of dilute groundwater represented by site 17 for groundwater well sites located close to the watershed mountains and the Um El-Seed plateau, 11 to 89 % seawater for groundwater located close to the Gulf of Aqaba coastal line, and 21 to 88 % reject brine water for groundwater located nearby the desalination plants (Fig. 5e).
Table 1 Estimated Sea Water Mixing Index (SWMI) results -
2.
Geochemical ionic ratios and aqueous specification as mixing indicators
Ionic ratios are commonly used to evaluate the salinization sources and the origin of groundwater in coastal aquifers (Barbecot et al. 2000). The changes in the chemical composition of fresh groundwater are caused by mixing with different waters as well as by chemical reactions. The Na/Cl ratio is used for discriminating brackish and saline water, where the values of this ratio are always higher than unity in the worldwide fresh and meteoric water while it is less than unity in seawater or saline water (Starinsky et al. 1983). In Fig. 6a, all groundwater samples have Na/Cl ratios less than 1. Natural water with Na/Cl ratios less than unity may indicate seawater mixing (Klassen et al. 2014). In general, most ions (Na+, Mg2+ and SO4 2−, HCO3 −) are positively correlated with Cl− (Fig. 6b–e), indicating that such ions are derived from mixing with seawater and reject brine water, which acts as the main source of solutes in groundwater salinization.
Fig. 6 
Ionic ratios of the studied groundwater with respect to chloride levels. Dashed line indicates a ratio for the Gulf of Aqaba
In the bivariate diagrams, Br− versus Cl− is plotted in order to distinguish mixing mechanisms, of the original aquifer water with saline water, from chemical reactions (Fig. 6f). The Br− and Cl− ratios have often been used as conservative indicators of salinity origin. Seawater has a Br−/Cl− of 0.005 in Mediterranean countries (Jones et al. 1999; Vengosh et al. 1999), and in the Gulf water, this value is approximately 0.01. In the study area, the Br−/Cl− ratio ranges from 0.007 to 0.012, with a mean value of 0.009. This is close to the ratio in the Gulf of Aqaba and rejects brine samples, indicating that the main sources for groundwater salinization are seawater and reject brines.
To evaluate the water–rock interaction processes, Ca2+ and Sr2+ versus HCO3 − + SO4 2− graphs were used to examine the influence of leaching, dissolution, precipitation/precipitation, and cation exchange on groundwater chemistry of the Miocene aquifer (Fig. 6g, h). Enrichment of Ca indicates SWMI (Bear 1999). Sr2+ behaves like Ca2+, has higher concentrations in Ca2+-bearing minerals, shows a positive correlation with Ca2+, and behaves conservatively in groundwater (Lyons et al. 1995). The graphic representation of calcium and strontium evolution versus the sum of bicarbonate and sulfate represents two tendencies. The first tendency shows high calcium and strontium content, which represents groundwater located in Um El-Seed plateau. This indicates the consequence of leaching and dissolution processes of carbonate minerals embedded in the aquifer matrix. The second tendency, where the majority of the samples present low calcium contents, indicates the probable cation exchange of calcium in groundwater with sodium in clay minerals and precipitation of carbonate minerals (Fig. 6i).
An aqueous specification model was created using the NETPATH model, and saturated indices were calculated for the entire groundwater samples (Plummer et al. 1992). The saturation index (SI) is widely used as an indicator of hydrochemical processes affecting groundwater chemistry (Li et al. 2010; Coetsiers and Walraevens 2006; Langmuir 1997). It describes the saturation status of various minerals in groundwater; when SI = 0, minerals in the aqueous solution are in equilibrium; when SI<0, minerals in the aqueous solution have not reached saturation and bear on the dissolution trend, while an SI>0 indicates a supersaturation (Qian and Ma 2005; Luo et al. 2008). In the study area, the effects of water–rock interactions and mixing with different waters were investigated by calculating the SIs for carbonate minerals (calcite and dolomite), a sulfate mineral (gypsum), and halite. Figure 7a–d and Table 2 show the spatial distribution of SIs for different minerals, where the SI = 0 contour line is highlighted by red dashed color to separate the saturated and supersaturated contour regions. The spatial distribution of the mineral SIs indicates groundwater located close to the watershed mountain and in the Um El-Seed plateau is under saturated with calcite, dolomite, and halite minerals. However, the same site shows supersaturation with gypsum. Unsaturation is mainly attributed to recharge replenishments through the fractured limestone of the Um El-Seed plateau and watershed mountain areas; however, gypsum shows supersaturation due to leaching and dissolution of terrestrial salts from the limestone rock matrix of marine origin (Fig. 7). On the other hand, groundwater located close to the Gulf of Aqaba is typically supersaturated due to the influence of seawater intrusion as a result of overpumping, which exceeds the natural recharge (Fig. 7). It is worth mentioning that the limited deviations and inconsistencies of contour lines nearby the locations of reject well sites (R1, R3, R4, R6, and R10) are mainly attributed to the effect of reject brine disposal deep into the Miocene aquifer.
Fig. 7 
Spatial distributions of the saturation indices of different minerals in the Miocene groundwater. Dashed red line in the map and in the footer plots (total dissolved solids (TDS) versus saturation index (SI)) indicate equilibrium, where, SI = 0. a Calcite, b dolomite, c gypsum, and d halite. Well site numbers and salinity ranges are clearly indicated in Fig. 3
Table 2 Mineral saturation indices for phases in NETPATH geochemical models -
3.
Factorial analyses of hydrogeochemical data
Generally, hydrogeochemical processes are challenging to understand the account of their complexity. Statistical analyses can show the correlation between the hydrochemical compositions of groundwater (Kim et al. 2002; Helena et al. 2000) to investigate the degree of similarity and the probable relation between the chemical and the physical parameters in water. Multivariate analyses can be used to expect the kinds of groundwater deterioration and serve as an indicator of seawater intrusion (El Moujabber et al. 2006). To differentiate the various processes affecting groundwater chemistry, multivariate data sets were reduced to three possible factors using factor analyses. The KyPlot program version 2, developed by Yoshioka 2001, was used to carry out the factorial analyses. The Kaiser–Meyer–Olkin (KMO) test, performed for different parameters (EC, pH, HCO3 −, Cl−, SO4 2−, Na+, K+, Ca2+, Mg2+, B−, and Br−), yielded a value of 0.801, suggesting that the data group is meritorious and eligible for performing factor analyses. The set parameters were grouped in three major factors explaining more than 86.3 % of the cumulative variance in the data set. Factor 1 was able to explain 52 % of the variance of the total geochemical data set and has a strong positive loading (>0.5) for EC, Cl−, SO4 2−, Na+, K+, Mg2+, and Br−, suggesting seawater intrusion. The regional distribution contour map for the factor scores of factor 1 (Fig. 8a, Table 3) shows high values parallel to the gulf coast and low values in the mountain front close to the hilly recharge area and the Um El-Seed plateau. Factor 2 was able to explain 27 % of the variance of the total geochemical data set and has strong positive factor loadings for Ca2+ and B− and a negative factor loading for SO4 2− and pH. The pH shows inverse relationships with calcium and boron concentrations in all groundwater samples (Fig. 9a, b). At low pH, groundwater tends to dissolve calcium from the carbonate aquifer matrix and hence increase the Ca2+ concentration in the groundwater while the adsorption of B− on clay minerals increases with pH at a maximum range of 8–9 (Vengosh 2014). In addition, B and Ca2+ record high concentration in the reject brine water comparing with groundwater. Where, the average concentrations of B and Ca are 4.68 (mg/l) and 64.41 meq/l in reject water, respectively, while it was 3.80 mg/l and 52.30 epm/l in groundwater. This is demonstrating the local impacts of influent reject water disposal deep into the Miocene groundwater (Fig. 8b). Factor 3 explains 6 % of the geochemical data set and has a positive factor loading with HCO3 −, which gives an idea of the recharge area located close to the hilly mountain west of the study area (Fig. 8c).
Fig. 8 
Distribution of score factors in groundwater of the Miocene aquifer: a factor 1, b factor 2, and c factor 3. Well site numbers and salinity ranges are clearly indicated in Fig. 3
Table 3 Varimax factor loading matrix, communalities for each variable analyzed the variance and cumulative proportion of variance of each factor Fig. 9 
a Calcium concentration versus pH. b Boron concentration versus pH of groundwater, seawater, and reject water samples. Well site numbers and salinity ranges are clearly indicated in Fig. 3
-
4.
Stable isotope for evaluation of groundwater origin
The results of the δ18O and δ2H analyses are presented in ESM 1 and are shown in Fig. 10a. The isotopic compositions of the groundwater range from −28.9 to 12.4 ‰ for δ2H and from −3.92 to 2.18 ‰ for δ18O at groundwater well sites 3 and 72, respectively. All samples are plotted in a relatively tight cluster near the Mediterranean Meteoric Water Line (MMWL) obtained from Gat et al. 1969 and IAEA 1981, indicating that they are of meteoric origin. The relation between δ18O and δ2H is described by the equation δ2H = 6.1614 (δ18O)–1.0318 ‰. In Sharm El-Shiekh, the watershed atmospheric moisture coming from the Mediterranean Sea is the main source of precipitation that falls mainly from October to April (Greenwood 1997). The weighted average isotopic value for precipitation between October and April was −4.99 and −21.37 ‰ for δ18O and δ2H, respectively (Eissa et al. 2013a). These values plot close to the MMWL (Gat et al. 1969; Clark and Fritz 1997), and they represent the source of groundwater recharge for the Miocene aquifer.
Fig. 10 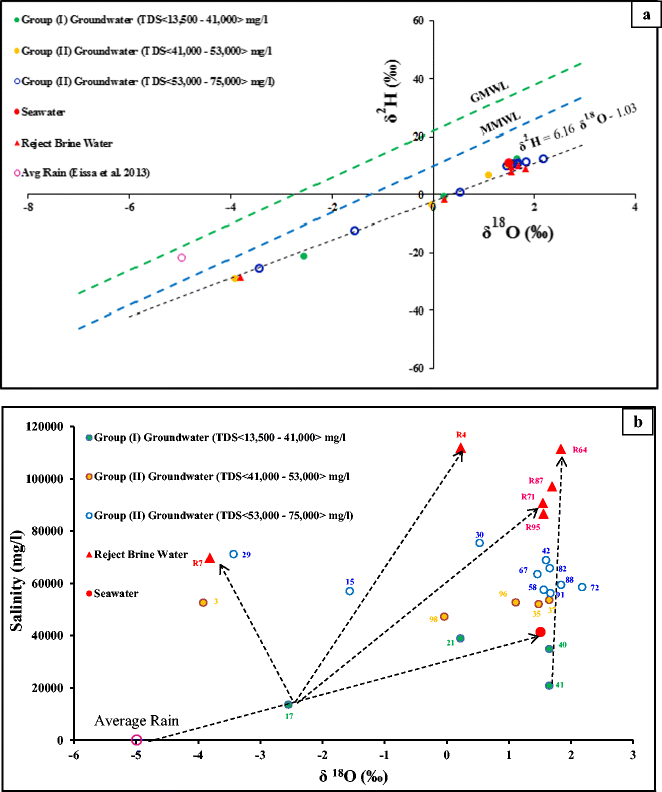
a δ18O versus δ2H for groundwater in the Sharm El-Shiekh area. The Miocene groundwater is shown for group I, group II, seawater, and reject brine water. The rain isotopic value is the amount weighted average (Eissa 2012; Eissa et al. 2013a). GMWL and MMWL are the Global Meteoric Water Line (Craig 1961) and the Mediterranean Meteoric Water Line (Gat et al. 1969; IAEA 1981), respectively. b δ18O versus salinity for group I and group II groundwaters, seawater, and reject brine water in the Sharm El-Shiekh area. Rain values are the amount-weighted averages (Eissa et al. 2013b)
The groundwaters in the Miocene aquifer can be divided into two groups on the basis of the δ18O and δ2H data. Group I is characterized by relatively depleted δ18O and δ2H values, ranging from −3.82 to −2.58 and −19.5 to −13.4 ‰, respectively. Group I is composed of groundwater originating along the mountain front and the Um El-Seed plateau (Fig. 1a). The isotopic values for group I were similar to the δ18O and δ2H of groundwater in the upper watershed recharge areas. The most depleted δ18O and δ2H of group I was locally recorded at site 17, indicating a relatively low withdrawal. The groundwater from group II is located in deep wells along the coast and near the reject wells; the δ18Oand δ2H values ranged from −0.04 to +1.84 ‰ and −3.5 to +10.2 ‰, respectively. Group II groundwater shows a mixing between groundwater, seawater, and reject brine water (δ2H = 6.16 × δ18O–1.3 ‰; Fig. 10a). The δ18O versus salinity plot (Fig. 10b) shows that these samples are plotted on the mixing lines between group I groundwater, seawater, and reject brine water.


6 Conclusion
The Sharm El-Shiekh is located at the southeastern part of the Sinai Peninsula and is bordered on the east by the Gulf of Aqaba. The area is a major tourist destination in the South Sinai with an arid climate and scarce rainfall. In such arid areas, freshwater water is deficient, so RO desalination is considered the only source of freshwater. The saline groundwater in the Miocene aquifer and seawater are considered the main sources for feeding the water desalination plants.
The historical records of groundwater salinity show a progressive increase during the last decades due to high pumping rates which exceed the natural recharge coming from the mountainous area. This result indicates a wide range of groundwater salinity, where the TDSs vary between 13,551 and 75,487 mg/l with an average of 56,443 mg/l. All groundwater samples exceed the drinking water guideline of 1000 mg/l (WHO 2011). Alkaline metals exceed alkaline earth metals, and strong anions exceed weak acid anion according to Chadha (1999), Piper (1953), and Gibbs (1970), indicating the final stage of groundwater evolution. The groundwater in the study area is dominantly characterized by Na+ > Ca2+ > Mg2+ and Cl− > SO4 2− > HCO3 − (10 %) and Na+ > Mg2+ > Ca2+, and Cl− > SO4 2− > HCO3 − (90 %) as hydrochemical facies of sodium chloride water type. Deterioration of groundwater quality, overpumping, seawater intrusion, and anthropological impacts of reject brine water disposal deep into the aquifer are restricting the amount of potable groundwater in this area and cause a potential crisis for the local economy and environment.
Based on the water chemistry and stable isotopes, the groundwater is divided into two main groups: group I contains groundwater more depleted in δ2H and δ18O and generally has a relatively lower salinity. The group I groundwater is primarily subsurface flow from the adjacent watershed and the elevated plateau and shows relative mixing percentages with seawater. The group II contains groundwater that has undergone clearly mixing with both seawater and reject brines disposed deep into the Miocene aquifer. They generally have a higher salinity than group I groundwater and are enriched in δ2H and δ18O due to mixing with seawater and reject brines. Most groundwater samples plotted between the original groundwater, seawater, and disposal brine water end members.
The geochemical ion ratios and the factorial analyses show that all groundwater in the Miocene aquifer is affected by seawater intrusion and mixing with reject brines, except limited regions close to the watershed mountains and the Um El-Seed plateau. The calculated mixing percentages of group 1, using water chemistry and isotopes for groundwater, were estimated by 25 and 84 % recharge groundwater to 75 and 16 % seawater, respectively. However, the estimated mixing percentages for group II range between 21 and 88 % reject brine water to 79 and 12 % seawater, respectively. Consequently, the hydraulic relationship to water quality in the Miocene aquifer, sea aquifer relationships, and the environmental impact of the reject brine disposal were verified. The daily groundwater abstraction has increased; the groundwater in the Miocene aquifer has degraded during the last decades due to pumping exceeding the natural recharge, which comes from the watershed, by orders of magnitude. Primarily, (1) the climatic conditions, especially droughts, could indirectly cause groundwater salinization where recharge and freshwater replenishments are limited, (2) the interaction of seawater–aquifer groundwater can generate an increase in salinity due to lateral seawater intrusion and upconing of deep saline water due to high pumping, and (3) the effluent of reject brine water in the groundwater causes contamination and has destructive environmental impacts. Pumping groundwater in the Miocene aquifer should be well managed as well as judgment verdicts, and authorizations should be issued forbidding disposal of the reject brine deep into the aquifer. New techniques and substitutive alternatives should be employed to deal with reject brine water, and evaporation ponds and zero-liquid discharge are recommended.
References
Abd Allah, A. A. (1999). Geological and geophysical studies for groundwater investigation in Sharm El-Sheikh-Ras Mohamed area South Sinai, Egypt. Dissertation, Ph. D., Al Alzhar University Cairo Egypt, pp. 118.
Abdallah, A. A., & El Hefnawy, M. A. (2002). Groundwater investigation at Sharm El-Sheikh area, South Sinai, Egypt. Annals Geological Survey Egypt, 417–427.
Abdeltawab, S. (2012). Rock fall failure model practical example of Umm Sid Plateau-Sharm El Sheikh area, Egypt. International Journal of Scientific & Engineering Research, 3(10), 2229–5518.
Abou Rayan, M., Djebedjian, B., & Khaled, I. (2001). Water supply and demand and a desalination option for Sinai Egypt. Desalination, 136, 73–81.
Abu-Alam, T. S., & Stüwe, K. (2009). Exhumation during oblique transpression: an example from the Feiran-Solaf region, Egypt. Journal Metamorphic Geology, 27, 439–459.
Abu-Alam, T. S., Stüwe, K., & Hauzenberger, C. (2010). Calc-silicates from Wadi Solaf region Sinai, Egypt. Journal of African Earth Science, 58, 475–488.
Aggour, T. A., Shabana, A. R., Shided, A. G., & Yehia, M. M. (2000). Hydrogeological conditions of the water bearing formations in Wadi Watir basin with emphasis on the deep ones. 2nd International Conference on Basic Science and Advanced Technology, Faculty of Science Assiut University, 13 p.
American Public Health Association (APHA). (1995). American Water Works Association, Water Pollution Control Federation, Standard methods for the examination of water and wastewater. Washington: American Public Health Association.
American Public Health Association (APHA), (1998). Standard methods for the examination of water and wastewater, 20th edn. Washington, DC, 46p.
American Society for Testing Materials (ASTM), (2002). Water and environmental technology. Annual book of ASTM standards, U.S.A. Sec. 11, Vol.11.01and 11.02 West Conshohocken.
American Water Works Association (AWWA). (1971). Water quality and treatment. New York: McGraw-Hill.
Awwad, R. A., Olsthoorn, T. N., Zhou, Y., Uhlenbrook, S., & Smidt, E. (2008). Optimum pumping-injection system for saline groundwater desalination in Sharm El Sheikh. Water Mill Working Paper No. 11, 21 page.
Barbecot, F., Marlin, C., Gibert, E., & Dever, L. (2000). Hydrochemical and isotopic characterisation of the Bathonian and Bajocian coastal aquifer of the Caen area (Northern France). Applied Geochemistry, 15(6), 791–805. doi:10.1016/S0883-2927(99)00088-8.
Batayneh, A. T. (2006). Use of electrical resistivity methods for detecting subsurface fresh and saline water and delineating their interfacial configuration a case study of the eastern Dead Sea coastal aquifers. Jordan, Hydrogeology Journal, 14(7), 1277–1283.
Batayneh, A. T., Elawadi, E. A., & Al-Arifi, N. S. (2010). Use of geoelectrical technique for detecting subsurface fresh and saline water a case study of the eastern gulf of Aqaba Coastal Aquifer Jordan. Journal of Coastal Research, 26(6), 1079–1084. doi:10.2112/JCOASTRES-D-09-00006.1.
Bear, J. (1999). Seawater intrusion in coastal aquifers: concepts methods and practices Boston. Mass: Kluwer Academic.
Bentor, Y. K. (1985). The crustal evolution of the Arabo-Nubian Massif with special reference to the Sinai Peninsula. Precambrian Research, 28, 1–74.
Birke, M., Rauch, U., Harazim, B., Lorenz, H., & Glatte, W. (2010). Major and trace elements in German bottled water, their regional distribution, and accordance with national and international standards. Journal Geochemical Exploration, 107, 245–271.
Brown, E. M., Skougslad, W., & Fishman, M. J. (1970). Methods for collection and analysis of water samples for dissolved minerals and gases. In: U.S. Geological Survey Techniques for water resources investigations. USGS, Washington, DC, Book 5, chap A1.
Chadha, D. K. (1999). A proposed new diagram for geochemical classification of natural waters and interpretation of chemical data. Hydrogeol Journal, 7, 431–439.
Clark, I. D., & Fritz, P. (1997). Environmental isotopes in hydrogeology. Boca Raton Florida: Lewis Publishers.
Coetsiers, M., & Walraevens, K. (2006). Chemical characterization of the Neogene Aquifer Belgium. Hydrogeology Journal, 14, 1556–1568. doi:10.1007/s10040-006-0053-032.
Conoco Continental Oil Company (1987). Geological map of Egypt, (Scale 1:500,000).
Cools, J., Vanderkimpen, P., Afandi, E., Abdelkhalek, A., Fockedey, S., El Sammany, M., Abdallah, G., El Bihery, M., Bauwens, W., & Huygens, M. (2012). An early warning system for flash floods in hyper-arid Egypt. Nat Hazards Earth System Science, 12, 443–457.
Coplen, T. B. (1994). Reporting of stable hydrogen carbon and oxygen isotopic abundances. Pure and Applied Chemistry, 66, 273–276.
Coplen, T. B., Wildman, J. D., & Chen, J. (1991). Improvements in the gaseous hydrogen-water equilibrium technique for hydrogen isotope ratio analysis. Analyt Chemisty, 63, 910–912.
Craig, H. (1961). Isotopic variations in meteoric waters. Science, 133, 1702–1703.
Dames & Moore (1983). Sinai development study final report. Submitted to the advisory committee for reconstructions ministry of development, Arab Republic of Egypt.
Desconnets, J. C., Taupin, J. D., Lebel, T., & Leduc, C. (1997). Hydrology of the HAPEX-Sahel Central Super-Site: surface water drainage and aquifer recharge through the pool systems. Journal of Hydrology, 188–189, 155–178.
Domenico, P. A., & Schwartz, F. W. (1990). Physical and chemical hydrogeology (p. 824). New York: Wiley.
Egyptian Geological Survey and Mining Authority (EGSMA) (1981). Geological map of South Sinai Egypt, (Scale 1:250,000).
Egyptian Geological Survey and Mining Authority (EGSMA) (1994). Geological map of South Sinai scale 1:250,000.
Eissa, M. (2012). Groundwater Resource Sustainability in Wadi Watir Watershed, Sinai, Egypt. Dissertation, submitted in partial fulfillment of the requirements for the degree of Doctor of Philosophy in Hydrogeology University of Nevada, Reno, August, 2012 UMI Number: 3539186.
Eissa, M., Thomas, J. M., Hershey, R. L., Pohll, G. M., Dawoud, M. I., Dahab, K. A., Gomaa, M. A., & Shabana, A. R. (2013a). Geochemical and isotopic evolution of groundwater in the Wadi Watir watershed, Sinai Peninsula, Egypt. Environmental Earth Sciences, 71(4), 1855–1869.
Eissa, M., Thomas, J. M., Pohll, G. M., Hershey, R. L., Dahab, K., Dawoud, M., Gomaa, M., & El Shiekh, A. (2013b). Groundwater resource sustainability in the Wadi Watir delta, Gulf of Aqaba. Hydrogeology Journal, 21(8), 1833–1851.
El Manakhly, M. M., Mohamed, H. A., Osama, M. R. F., El- Hinnawi, M. E., & Soliman, K. A. (1997). Geology and geochemical exploration along the basement-sedimentary contact in south Sinia, Egypt. Final report of expedition No. 20.
El Moujabber, M., Bou Samra, B., Darwish, T., & Atallah, T. (2006). Comparison of different indicators for groundwater contamination by seawater intrusion on the Lebanese coast. Water Resources Management, 20, 161–180. doi:10.1007/s11269-006-7376-4.
El Sayed, A. A., Mohamed, B. S., Shatia, F. A., & Abdalla, A. A. (1990). Preliminary report geophysical study for groundwater prospecting at Wadi Kid, Wadi Mander, Sharm El Sheikh, South Sinai. Internal Report No. 49/1990.
El-Refeai, A. A. (1992). Water resources of southern Sinai Egypt geomorphological and hydrogeological studies Ph.D. Sci. Thesis, Faculty of Science Cairo University, 357p.
El-Refeai, A. A. (1999). Sharm El Sheikh desalination plant: hydrogeological and environmental approach. Journal Petroleum & Engineering, 2, 1–21.
El-Sayed, M. H. (2006). Comparative study of water quality of the Quaternary aquifer in Wadi Watir basin and its delta. Southeast Sinia, Egypt. Egyptian Journal Desert Research, 56(1), 17–46.
Epstein, S., & Mayeda, T. K. (1953). Variations of 18O content of waters from natural sources. Geochimica et Cosmochimica Acta, 4, 213–224.
Farahat, E. S., Zaki, R., Hauzenberger, C., & Sami, M. (2011). Neoproterozoic calc-alkaline peraluminous granitoids of the Deleihimmi pluton Central Eastern Desert Egypt: implications for transition from late- to post-collisional tectonomagmatic evolution in the northern Arabian–Nubian Shield. Geological Journal, 46, 544–560.
Fishman, M. J., & Friedman, L. C. (1985). Methods for determination of inorganic substances in water and fluvial sediments, U.S. Geological Survei Book 5, Chapter A1. Open File Report 84:85–495 Denver Colorado U.S.A. for hydrogen isotope analysis. Analytical Chemistry, 63, 910–912.
Garrels, R., & Mackenzie, F. (1967). Origin of the chemical compositions of some springs and lakes. In R. F. Ground (Ed.), Equilibrium concepts in natural water systems. Washington: American Chemical Society Publications.
Gat, J.R., & Gonfiantini, R. (1981). Stable isotope hydrology deuterium and oxygen-18 in the water cycle. Technical Reports Series No 210 Vienna Austria: IAEA.
Gat, J. R., Mazor, E., & Tzur, Y. (1969). The stable isotope composition of mineral waters in the Jordan Rift Valley. Journal of Hydrology, 7, 334–352.
Ghoneim, M. F., Heikal, M. T. S., El Dosuky, B. T., Abu-Alam, T., & Sherif, M. I. (2015). Neoproterozoic granites of Sharm El-Sheikh area Egypt: mineralogical and thermobarometric variations. Arabian Journal of Geosciences, 8, 125–141. doi:10.1007/s12517-013-1182-0.
Gibbs, R. J. (1970). Mechanisms controlling world water chemistry. Science, 170, 1088–1090.
Glater, J. & Cohen, Y. (2003). Brine disposal from land based membrane desalination plants, a critical assessment (DRAFT). Metropolitan water district of Southern California. Available from: http://www.polysep.ucla.edu/Publications/Papers_PDF/BRINE%20DISPOSAL.pdf (accessed 21.05.08.).
Greenwood, N. H. (1997). The Sinai: a physical geography. Austin: University of Texas Press.
Guler, C., & Thyne, G. D. (2004). Hydrologic and geologic factors controlling surface and groundwater chemistry in Indian Wells-Owens Valley area, southeastern California, USA. Journal of Hydrology, 285, 177–198.
Hafez, A., & El Manharawy, S. (2002). Economics of seawater RO desalination in the Red Sea region, Egypt. Part 1: a case study. Desalination, 153, 335–347.
Helena, B., Pardo, R., Vega, M., Barrado, E., Fernandez, J. M., & Fernandez, L. (2000). Temporal evolution of groundwater composition in an alluvial aquifer (Pisuerga River, Spain) by principal component analysis. Water Research, 34, 807–816.
Hem, J. D. (1989). Study and interpretation of the chemical characteristics of natural water. US Geological Survey Water-Supply.
Hem, J. D. (1991). Study and interpretation of the chemical characteristics of natural water. 3rd ed. Scientific Publication Jodhpur, India 2254.
Himida, I. H. (1997). Water resources of Wadi Watir. Internal report, Desert Research Center (In Arabic).
IAEA, (1981). Stable isotope hydrology: deuterium and oxygen-18 in water cycle. In: Gat JR, Gonfiantini R (eds) Technical report no. 210 International Atomic Energy Agency Vienna, 339 pp.
Jones, B. F., Vengosh, A., Rosenthal, E., & Yechieli, Y., (1999). Geochemical investigations In: Bear J., Cheng A.H.D., Sorek S., Ouazar D., & Herrera I., Eds., Seawater intrusion in coastal aquifers. Kluwer Academic Publishers, Dordrecht/Boston/London, (22) p 1–71.
Kim, R. H., Yum, B. W., & Chang, H. W. (2002). Hydrogeochemical and isotopic characteristics for salinization of a shallow groundwater in coastal area, Youngkwang, Korea (pp. 227–237). The Netherlands: Proc. 17th Salt Water Intrusion Meeting Delft.
Klassen, J., Allen, D. M., & Kirste, D. (2014). Chemical indicators of saltwater intrusion for the Gulf Islands, British Columbia Department of Earth Sciences, Simon Fraser University (SFU), Final Report Submitted to BC Ministry of Forests, Lands and Natural Resource Operations and BC Ministry of Environment, 1-40p. http://www.sfu.ca/personal/dallen/Chemical%20Indicators%20of%20SWI_Final.pdf.
Koussis, A. D., Georgopoulou, E., Kotronarou, A., Lalas, D. P., Restrepo, P., Destouni, G., Prieto, C., Rodriguez, J. J., Rodriguez-Mirasol, J., Cordero, T., & Gomez-Gotor, A. (2010). Cost-efficient management of coastal aquifers via recharge with treated wastewater and desalination of brackish groundwater: general framework. Hydrological Sciences Journal, 55(7), 1217–1233. doi:10.1080/02626667.2010.512467.
Kumar, P. J. S. (2014). Evolution of groundwater chemistry in and around Vaniyambadi industrial area: differentiating the natural and anthropogenic sources of contamination. Chemie der Erde - Geochemistry. doi:10.1016/j.chemer.2014.02.002.
Lamei, A., van der Zaag, P., & von Münch, E. (2009). Water resources management to satisfy high water demand in the arid Sharm El Sheikh on the Red Sea, Egypt. Desalination & Water treatment, 1, 299–306.
Langmuir, D. (1997). Aqueous environmental geochemistry. New Jersey: Prentice Hall, Inc.
Li, P., Qian, H., Wu, J., & Ding, J. (2010). Geochemical modeling of groundwater in southern plain area of Pengyang County Ningxia China. Journal of Water Science and Engineering, 3(3), 282–291.
Luo, Q. B., Kang, W. D., Xie, Y. L., & Zhao, B. F. (2008). Groundwater hydrogeochemistry simulation in the Jingbian area of the Luohe of Cretaceous. Ground Water, 30(6), 22–24.
Lyons, W. B., Tyler, S. W., Gaudette, H. E., & Long, D. T. (1995). The use of strontium isotopes in determining groundwater mixing and brine fingering in a playa spring zone Lake Tyrrell Australia. Journal of Hydrology, 167, 225–239.
Miller, J. E. (2003). Review of water resources and desalination technologies SAND 2003–800.
Mondal, N. C., & Singh, V. P. (2011). Hydrochemical analysis of salinization for a tannery belt in Southern India. Journal of Hydrology, 405, 235–247.
MSEA. (2006). Law 4 for the protection of the environment. http://www.eeaa.gov.eg/English/main/about.asp, 2006.
Omara, S. (1959). The geology of Sharm El-Sheikh sandstone Sinai Egypt. Egypt Journal Geology, 3(1), 107–121.
Park, S. C., Yun, S. T., Chae, G. T., Yoo, I. S., Shin, K. S., Heo, C. H., & Lee, S. K. (2005). Regional hydrochemical study on salinization of coastal aquifers, western coastal area of South Korea. Journal of Hydrology, 313, 182–194.
Piper’s, A. M. (1953). A graphic procedure in the geochemical interpretation of water analysis. American Geophysical Union Transactions, 25(105), 914–923.
Plummer, L. N., Prestemon, E. C., & Parkhurst, D. L. (1992). NETPATH: an interactive code for interpreting NET geochemical reactions from chemical and isotopic data along a flow PATH in Kharaka Y, Maest A.S., eds. International Symposium on Water-rock Interaction 7th Park City Utah July 9–23, 1992 Proceedings: Rotterdam, Balkema, p. 239–242.
Qian, H., & Ma, Z. Y. (2005). Hydrogeochemistry. Beijing: Geological Publishing House.
Rainwater, F. H., & Thatcher, L. L. (1960). Methods for collection and analysis of water samples. U.S. Geological survey water supply, paper 1454. Washington: USGS.
Research Institute for Groundwater (RIGWA), (1988). Hydrogeological map of Egypt (Scale 1:200,000).
Said, R. (1962). The geology of Egypt (p. 377). Amsterdam and New York: Elsevier.
Shata, A. I. (1969). Geology of Wadi Khashaby area Sharm El Sheikh area Southern Sinai Egypt with special reference to kaolinite deposits Dissertation, Ain Shams University.
Shaw, D. M. (1961). Element distribution laws in geochemistry. Geochemical Cosmochimicam Acta, 23, 116–134.
Sherif, M. I. (2011). Petrology, tectonic evolution and radioactivity of granitic rocks Sharm El-Sheikh area, South Sinai, Egypt. M.Sc. Thesis, Faculty of Science, Tanta University, Egypt.
Sherif, M. I., Ghoneim, M. F., Heikal, M. T., & El Dosuky, B. T. (2013). Petrogenesis of granites, Sharm El-Sheikh Area, South Sinai, Egypt petrological constrains and tectonic evolution. Mineralogy and Petrology, 107, 765–783.
Sinclair, A. J. (1974). Selection of threshold values in geochemical data using probability graphs. Journal of Geochemical Exploration, 3, 129–149.
Sinclair, A. J. (1976). Application of probability graphs in mineral exploration. Association of exploration Geochemists, Rexdale, Ontario, Special Volume No. 4.
Starinsky, A., Bielski, M., Ecker, A., & Steinitz, G. (1983). Tracing the origin of salts in groundwater by Sr isotopic composition (the crystalline complex of the southern Sinai Egypt). Isotope Geoscience, 1, 257–267.
Stern, R. J. (1994). Arc assembly and continental collision in the Neoproterozoic East African Orogen: implications for the consolidation of Gondwanaland. Annual Review of Earth and Planetary Science, 22, 319–351.
Strathmann, H. (2004). Ion-exchange membrane separation processes membrane science and technology series 9. Amsterdam 19: Elsevier.
Subramani, T., Elango, L., & Damodarasamy, S. R. (2005). Groundwater quality and its suitability for drinking and agricultural use in Chithar River Basin, Tamil Nadu India. Environmental Geology, 47, 1099–1110.
Sulin, V. A. (1948). Condition of formation, principals of classification and constituents natural waters (p. 215). Moscow: Leningrad Academic Science, USSR.
Tanaskovic, I., Golobocanin, D., & Miljevic, N. (2012). Multivariate statistical analysis of hydrochemical and radiological data of Serbian spa waters. Journal Geochemical Exploration, 112, 226–234.
UNEP/PERSGA, (1997). Assessment of land-based sources and activities affecting the marine environment in the Red sea and Gulf of Aden, UNEP Regional Seas Report and Studies No 166, United Nations Environmental program, http://www.unep.ch/regionalseas/main/persga/redthreat.html.
UNESCO, (2008). World Water Assessment Program: facts and figures. http://www.unesco.org/water/wwap/facts_figures/.
Vengosh, A. (2014). Salinization and saline environments. Environmental geochemistry, vol. 9, Sherwood Lollar, B. (ed.), Treatise in geochemistry second edition. Executive Editors: Holland, H.D. and Turekian, K.T., 11 (2013) 325–378.
Vengosh, A., Spivack, A. J., Artzi, Y., & Ayalon, A. (1999). Geochemical and boron, strontium, and oxygen isotopic constraints on the origin of the salinity in groundwater from the Mediterranean coast of Israel. Water Resources Research, 35, 1877–1894.
Walha, K., Ben Amar, R., Firdaous, L., Quéméneur, F., & Jaouen, P. (2007). Brackish groundwater treatment by nanofiltration, reverse osmosis and electrodialysis in Tunisia: performance and cost comparison. Desalination, 207, 95–106.
Wheater, H. S., Mathias, S. A., & Li, X. (2010). Groundwater modelling in arid and semi-arid areas. Cambridge University Press. ISBN-10: 0521111293; ISBN-13: 9780521111294.
WHO. (2011). WHO guidelines for drinking-water quality (IVthth ed., p. 340). Geneva: World Health Organization.
Yoshioka, K. (2001). KyPlot Program Version 2.0. www.phy.gonzaga. edu. Cited 3 April 2007.
Acknowledgments
Acknowledgement goes to the Egyptian Scientific Technology Development Funding (STDF) for technical support and for funding laboratory and field work during the project. Thanks to the two anonymous reviewers and the editorial board of the Journal of Water, Air, & Soil Pollution who provided their constructive comments to improve the article. We are thankful to them.
Author information
Authors and Affiliations
Corresponding author
Electronic Supplementary Material
Below is the link to the electronic supplementary material.
ESM 1
(XLSX 23 kb)
Rights and permissions
About this article

Cite this article
Isawi, H., El-Sayed, M.H., Eissa, M. et al. Integrated Geochemistry, Isotopes, and Geostatistical Techniques to Investigate Groundwater Sources and Salinization Origin in the Sharm EL-Shiekh Area, South Sinia, Egypt. Water Air Soil Pollut 227, 151 (2016). https://doi.org/10.1007/s11270-016-2848-5
Received:
Accepted:
Published:
DOI: https://doi.org/10.1007/s11270-016-2848-5