
Abstract
Guinea worm and other water borne diseases associated with untreated surface water use have necessitated that communities are supplied with groundwater in the Northern Region of Ghana. The Electrical Resistivity Survey (ERS) method is one of the common geophysical survey techniques used for borehole siting in Ghana. Various groundwater exploration programs have utilized it by employing the four electrode system. However, the ERS has not been able to locate potential borehole sites successfully in the Voltaian Sedimentary Basin (VSB) in the Northern Region of Ghana although it has been successful in other geological formations. Unsatisfactory results obtained from the employment of the ERS system in the VSB therefore necessitated an experiment with the 2-D Multi-Electrode Resistivity Imaging (2-D MERI) technique. Field results show that the 2-D MERI is a robust and efficient technique: an improvement on the four electrode ERS system in terms of amount and quality of data obtained. The 2-D MERI interpretations were confirmed with a much improved borehole drilling success rate of 60% compared to 38% obtained using the ERS within the mudstone and shale formations. The 2-D MERI also indicated that very low resistivity layers in the VSB may not necessarily be good targets for borehole drilling and the generally held notion that groundwater cannot be found at depths more than 25 m is no longer tenable.
Introduction
With the increasing awareness of guinea worm and other water borne infectious diseases associated with untreated surface water bodies, high emphasis has been placed on supplying communities with groundwater by drilling boreholes and engineered hand dug wells in the Northern Region of Ghana (Ewusi, 2006).
The Community Water and Sanitation Agency (CWSA) of Ghana define a successful borehole as one that yields more than 13.5 liters per minute (l/min) (Anon, 2001). Borehole drilling programs have recorded low success rates for “water strike” in the Voltaian Sedimentary Basin (VSB). Dapaah-Siakwan and Gyau-Boakye (2000) have reported an overall success rate of 56% in the VSB. A careful analysis of the success rates of the various projects completed in the VSB in the Northern Region, especially in areas with dominant shale and/or mudstone lithologies give lower success rates. The International Development Agency (IDA) funded project which drilled 80 boreholes in Northern Region and the pilot Community Water and Sanitation Project (CWSP) borehole drilling programs recorded success rates of 35% and 38%, respectively, in the East Gonja and Savelugu-Nanton Districts which are both underlain by the shale/mudstone dominated VSB rocks (Anon, 2000). In the water drilling projects undertaken, the four electrode Electrical Resistivity Survey (ERS) technique has been the commonest geophysical method employed to determine the location for drilling. However, the ERS was not able to delineate potential borehole sites successfully in the VSB although it has been successful in other geological formations (Ewusi, 2006).
In this article, the 2-D Multi-Electrode Resistivity Imaging (2-D MERI) technique has been applied in the VSB of the Northern Region with the objective of determining how effective and efficient its application could enhance the selection of potential borehole drilling sites and also of increasing borehole drilling success rates.
Location and General Information
The Northern Region is one of the ten administrative Regions of Ghana. The Region is rural, sparsely populated with underdeveloped infrastructure and services and has been identified as a critical water deficit area (Anon, 2000). Groundwater is not only feasible but also the most economic source of potable water due to the dispersed nature of the communities (Gyau-Boakye and Dapaah-Siakwan, 1999).
Annual rainfall in the Northern Region ranges from 1016 mm to 1600 mm with evapo-transpiration averaging around 890 mm (Kwei, 1997). The climatic parameters of rainfall and potential evapotranspiration as well as the plant–soil complex and general slope are the major factors that influence groundwater recharge in the Region. Because of the very high temperatures in the Region, rainfall is usually evaporated back into the atmosphere with little water percolating for groundwater recharge (Ewusi, 2006). Acheampong (1988) observed that the Northern Region experiences long periods of dryness and the wet periods are only four months (July–November) of the year.
Geology and Hydrogeology
A good appreciation of geology is fundamental in any groundwater development program since the geology determines where, how, and what quantity and quality of available groundwater (Anon, 2002). The VSB is underlain by consolidated sedimentary rocks predominantly belonging to the Paleozoic era (Fig. 1). The rocks are generally horizontally bedded or gently dipping except near the eastern margin of the VSB adjacent to the contact with the Precambrian rocks where the lower members of the formation are gently folded (Kesse, 1985).

Simplified geological map of the Northern Region of Ghana showing locations where data were collected (Modified from Kesse, 1985)
The VSB consists of quartzite, shale, mudstone, siltstone, sandstone, and conglomerate or pebbly beds. Although there are areas of uniform lithology, interbedding of the different lithological units is a common geological feature. Anon (2002) classifies the VSB into three units namely: Upper, Middle, and Lower Voltaian.
-
(a)
The Upper Voltaian is made up of massive, cross-bedded quartzite and sandstone which in some localities are interbedded with shale and mudstone.
-
(b)
The Middle Voltaian consists essentially of argillaceous Obosum and arenaceous Oti beds. The Obosum beds comprise shale, mudstone, siltstone, and minor limestone and sandstone. The Oti beds comprise arkose, conglomerate, grit, shale, and minor limestone.
-
(c)
The Lower Voltaian or basal sandstone is made up of massive quartzite and sandstone with minor grit.
A total of 200 data points consisting of borehole information from both CWSA and World Vision International (WVI) for the Northern Region have been used to evaluate the hydrogeology of the VSB. It has been observed that areas with unsuccessful groundwater exploration programs consist predominantly of shale and/or mudstone lithology. The characteristics of these areas include: impermeable bedding planes in the shale or mudstone, limited shear zones with no micro-fissures in the mudstone, and unfractured siltstone or sandstone interbeds within the shale or mudstone. Field data indicate that:
-
(a)
Low groundwater yields with low success rates from borehole drilling are obtained in shale dominated areas in the Middle Voltaian Obosum beds with stratigraphy alternating between the upper shale underlain by mudstones and the upper mudstone underlain by meta-shale.
-
(b)
Relatively higher groundwater yields with high borehole drilling success rates are obtained in the sandstone-dominated arenaceous Oti beds which are fractured, permeable, and have good infiltration capabilities.
Geophysical Measurement
The four electrode ERS system previously used and the current 2-D MERI employed in the VSB are briefly described.
Four Electrode ERS System
The Schlumberger array was employed for both Horizontal Electrical Profiling (HEP) and Vertical Electrical Sounding (VES). The HEP determines lateral variations in resistivity and during the surveys; it was deployed in general to detect the water-bearing formations at two-depth horizons. These are: a shallow 5–8 m and a relatively deeper 18–25 m depths because these were the generally accepted view for water-strike in the VSB. Set-up for the HEP consisted of a current electrode pair (AB) and potential electrode pair (MN) both separated at 40 m and 1.0 m, respectively, for the shallow surveys while AB and MN of 80 m and 10 m, respectively, for the deeper water horizon. The mid-point for AB and MN was the same; and pegged with MN positioned in-between AB, all on a straight line. For both lay-out, the entire traverse lines were pegged at 10 m intervals and readings recorded at the mid-point of MN, the whole set-up being moved in steps of 10 m until the traverse is surveyed. HEP results were presented graphically as plots of resistivity against distance and anomalous stations representing where the lowest resistivity values were recorded and noted as the most promising point(s) for the VES survey.
Prior to using the Schlumberger array for the VES, the Dipole–Dipole VES array was usually deployed because it is faster and lends itself to easy field interpretation. If the Dipole–Dipole results were encouraging, then it was followed by the Schlumberger VES and this involved increasing the electrode separations around a station, chosen by the HEP with a logarithmic electrode separation distribution, in order to determine the variation in resistivity of the strata with depth. The results were plotted as resistivity against electrode separation and interpreted using GeoVES XL V1.3 software (de Jong, 2004).
2-D Multi-Electrode Survey
The ABEM Terrameter SAS 4000 which employs the static Lund automatic resistivity imaging system was used for all the field measurements in the VSB after the apparent failure of the four electrode ERS system. The Lund system consists of a multi-electrode arrangement for high resolution 2-D and 3-D resistivity surveys and is used for defining geological structures (Anon, 2007). Both horizontal and vertical variations in resistivity of the rocks are acquired with the instrument. A profile comprises four individual cables each spanning 100 m. Sixty-four (64) electrodes were deployed at 5-m spacing for the two inner cable sets (100–300) m and 10 m electrode spacing for the outer cable sets corresponding to distances (0–100) m and (300–400) m on the standard 400 m profile using the Wenner configuration. Data was recorded automatically along the profile at the electrode stations and processed by the inversion software RES2DINV (Loke, 2004) which optimizes the data to reduce the difference between the calculated and measured apparent resistivity values to a given root mean square (RMS) error by adjusting the resistivity of the model blocks. The resultant was the interpreted resistivity values and depths for the anomalies detected along the profile (Figs. 2–7).

Resistivity profile at station A in Figure 1. Water column is marked in white along the arrow
Results and Discussion
Figures 2–7 show inversion model resistivity sections of fieldwork conducted in the VSB using the 2-D MERI technique in a bid to identify potential borehole drilling sites. After these sites were determined, drilling was conducted to confirm the presence or otherwise of water. These figures were chosen from more than one hundred surveys because they highlight characteristic features of the geology where the traverses were obtained.
Since the sandstones have been identified as the main aquifers in the area, the discussion has been categorized into two main groups based on the dominance of the sandstone units and areas where the other units dominate.
-
(a)
Group 1: Sandstone dominant units have generally higher resistivity distribution between 150 and 10000 ohm-meters (Ωm). In this group, targets for groundwater are the low resistivity layers usually less than 700 Ωm occurring in the high resistivity background. Figures 2, 3, and 4 represent typical 2-D resistivity model sections in this group. About 90% borehole drilling success rate was attained after 10 attempts in this unit.
Figure 3 
Resistivity profile at station B in Figure 1. Water column is marked in white along the arrow
Figure 4 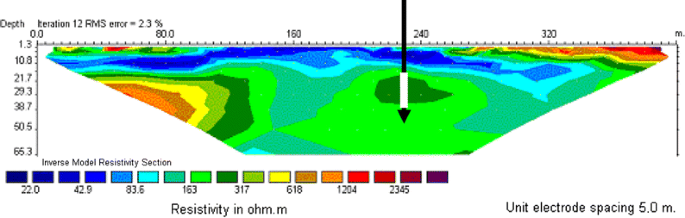
Resistivity profile at station C in Figure 1. Water column is marked in white along the arrow
-
(b)
Group 2: Mudstone, shale, siltstone, grit, limestone etc. dominant units have lower to moderate resistivity layers between 2 and 200 Ωm. The targets for groundwater exploration in this group are structures with resistivity between 20 and 80 Ωm. Figures 5, 6, and 7 represent typical 2-D resistivity models in these units. With 40 drilling attempts, a success rate of 60% was obtained in this group.
Figure 5 
Resistivity profile at station D in Figure 1. Water column is marked in white along the arrow
Figure 6 
Resistivity profile at station E in Figure 1. Water column is marked in white along the arrow
Figure 7 
Resistivity profile at station F in Figure 1. Water column is marked in white along the arrow


Results from field measurements demonstrate the efficiency of the 2-D MERI technique in demarcating potential borehole drilling sites in the VSB. It also revealed that it is faster than the conventional four electrode system and provides information about distinct subsurface boundaries and conditions, which can indicate soil or bedrock lithology variations and also help in defining weathering depths and the different lithologies in the subsurface. An average of about six standard 400 m resistivity profile measurements can be completed in a day with a three-man crew which is an advantage over the four electrode system where only about three such profile lengths can be completed by a five-man crew in a day.
The profile depicted in Figure 2 reveals two main resistivity layers which generally decrease in resistivity with depth. The first resistivity layer from the surface to a depth of about 40 m has a very high resistivity distribution in the range 2800–8000 Ωm. This very high resistivity layer was interpreted as indicating the presence of highly consolidated sandstone rocks. The second layer has resistivity in the range 60–1500 Ωm. Two comparatively low resistivity zones with values 60–120 Ωm are observed beneath stations 150 and 250 in the second layer. These two low resistivity zones were geophysically interpreted as probably due to fracturing in the bedrock and were thus seen as the best sites for borehole drilling on the profile.
Drilling at the station 250 (marked by arrow) revealed that the upper very high resistivity layer is sandstone. Highly fractured sandstone was encountered at a depth of 40–65 m and this accounted for about 95% of the total yield of 320 l/min from the borehole. Therefore, there was a good correlation between the geophysical interpretation and borehole drilling results.
The profile in Figure 3 shows an area overlain by lateritic gravels with very high resistivity between 2000 and 4000 Ωm at the surface to a depth of 15 m followed by a lower resistivity layer in the range 200–1000 Ωm. The zones with relatively low resistivity values of less than 400 Ωm observed at stations 80–170 and 240–320 may consist of highly fractured rocks and are therefore potentially good targets for the presence of groundwater.
Drilling at the station 140 (arrowed) produced a yield of 30 l/min between a depth of 31 and 56 m in a highly fractured sandstone. The interpretation of the geophysical results was accurate except that a higher yield was expected considering the contrast in resistivity values.
In Figure 4 the profile at station C is underlain by low to moderately high resistive rocks ranging from 50 to 2000 Ωm. Two distinct structures, one with a relatively high resistivity between 1200 and 2500 Ωm is interpreted beneath station 70 and the other with a relatively lower resistivity between 160 and 350 Ωm beneath station 230 on the profile. In the Oti beds which is predominantly underlain by the basal sandstones the lower resistivity structures are interpreted as representing zones of potential groundwater occurrence. Drilling at the station 230 (arrowed) intercepted a fractured sandstone at a depth between 15 and 35 m which accounted for the total yield of 420 l/min from the borehole. The geophysical interpretation highly correlated with the drilling results.
The profile depicted in Figure 5 is probably underlain by thin more or less horizontal lithologies with corresponding very low resistivities (that are less than 100 Ωm) that increase with depth to about 35 m. These resistivity layers could also represent intercalations of different rocks or may be showing the different degrees of weathering of a particular rock. The very low resistivity zones are not usually considered targets for groundwater exploration because these zones might be areas of dominant clay materials. Rather, the relatively higher resistivity zones are preferred. The layer with the resistivity range 80–110 Ωm which forms a synclinal structure at station 230 (arrowed) is considered although in general, the profile does not show very good groundwater potential.
Drilling at the station 230 intercepted weathered sandstone/mudstone intercalations at a depth of 15–30 m and this zone accounted for the total yield of 420 l/min of the borehole. Fresh mudstone with minor sandstone was encountered after this depth. The very high yield of 420 l/min was not anticipated from the geophysical interpretation. There was therefore a satisfactory correlation between the geophysical interpretation and borehole drilling results.
In Figure 6, the profile reveals three different resistivity layers with a generally graded increase in resistivity with depth. A moderately high resistivity greater than 1500 Ωm is observed at the surface from station 240 to 380. The three resistivity distributions are between 5–20 Ωm, 30–90 Ωm, and 100–250 Ωm. A geological structure with resistivity in the range of 100–400 Ωm observed beneath station 310 is a typical potential successful borehole drilling site. The size of the structure is significant for a productive aquifer. Drilling at the station 310 (arrowed) was successful within 35–55 m. A sandstone layer with resistivity of about 300 Ωm accounted for the total yield of 1200 l/min of the borehole.
Figure 7 shows the profile of an area generally underlain by two main electrical resistivity layers. The relatively higher resistivity layer in the range 200–1000 Ωm is bound below and above by a lower resistivity layer of between 80 and 150 Ωm. A probable discontinuity is interpreted at station 230. This discontinuity was targeted for drilling although the profile was not considered as portraying a good groundwater potential.
Drilling at the station 230 (arrowed) intercepted mudstone/sandstone intercalations at the depth 40–55 m and accounted for a total yield of 20 l/min from the borehole. The geophysical interpretation therefore correlated well with the borehole drilling results. Geophysical interpretation from the more than a hundred inversion models generated using the 2-D MERI technique in the VSB and followed by drilling 50 boreholes at selected sites on the profiles revealed a combined correlation of 65% in the sandstone dominant and mainly mudstone, shale, siltstone units. In the difficult mudstone, shale, siltstone, grit, units a correlation of 60% was attained. The good correlations obtained within the two units enabled the establishment of relationships between resistivities measured, lithologies drilled as well as structures identified, and groundwater occurrence within VSB. Table 1 summarizes the relationships.
Conclusion
Comparison between the interpreted 2-D MERI models and drilling results from sites selected based on the interpretation gave a combined correlation of 65% in the VSB. In the difficult mudstone, shale, siltstone etc. terrain where only 38% success rate had previously been attained, the MERI technique gave success rate of 60%. This significant improvement achieved by the MERI technique shows that it is superior to the four electrode ERS system and is accurate in determining groundwater targets for drilling in difficult terrain.
Data gathering using the MERI technique is less laborious compared with the four electrode ERS system where equipment and electrodes are moved from one station to the next with a five-man minimum survey team each time for HEP. Electrodes are also moved to greater separations during VES measurements. With the MERI technique a three-man team can successfully carry out a survey and at almost twice a rate compared to the four electrode ERS system. A lot more information is obtained in a single profile measurement and these information are in both horizontal and vertical directions unlike the four electrode ERS system where only a one dimensional data is obtained. Also the large number of measurements carried out along a profile makes it attractive compared to the four electrode ERS. It is possible that the conceptual model built by “experts” to the effect that the maximum water strike depth in the VSB is 25 m, leading to a shorter spread for AB when HEP was used may have partly contributed to the unsatisfactory results the ERS technique gave.
Results of the 2-D pseudo sections profiles show that the technique is effective in differentiating the electrical resistivity of the various lithologies at the subsurface. Different rock materials with different electrical resistivities on the same profile were clearly differentiated. Weathered and fresh rocks on most of the profiles were shown with different resistivity layers in the 2-D models. Distinct lithological boundaries, weak geological zones, and fractures which are good indicators for groundwater availability were clearly observed on the profiles. In areas where there were intercalations of the different units, the layers of each individual rock materials were clearly distinguished by different resistivity layers on the profiles. It was also observed that the MERI technique is quite effective in differentiating between clayey and sandy soil covers.
The study has demonstrated the utility of the ABEM Lund 2-D MERI technique in improving the location of targets for water drilling in a very difficult terrain such as the VSB in the Northern Region of Ghana where the success rate for siting boreholes using the conventional geophysical methods have been low. The technique should begin to enjoy wide application in the Basin and other areas with similar geology.
References
Acheampong, P. K., 1988, Water balance analysis for Ghana: Geography, v. 73, no. 2, p. 125–131.
Anon, 2000, Unpublished technical report, International Development Agency (IDA) funded 80 borehole drilling program, 150 pp.
Anon, 2001, Technical proposal for the rural water supply and sanitation in the Northern Region, Unpublished report for the Community Water and Sanitation Agency (CWSA), 84 pp.
Anon, 2002, Baseline study and inventory of water resources in the Northern Region of Ghana, AFD rural water supply and sanitation project in the Northern Region, 125 pp.
Anon, 2007, ABEM Instruction Manual for SAS 1000/4000 Terameter, ABEM Instrument ABS-17266 Sundbyberg, Sweden, 135 pp.
Dapaah-Siakwan, S., and Gyau-Boakye, P., 2000, Hydrogeologic framework and borehole yields in Ghana: Hydrogeol. J., v. 8, p. 405–416.
de Jong, A., 2004, GeoVES XL V1.3 software: Geosearch International Limited, Northern Ireland, UK.
Ewusi, A., 2006, Groundwater exploration and management using geophysics in the Northern Region of Ghana, Unpublished PhD thesis: Brandenburg Technical University, Chair of Environmental Geology, Germany, 171 pp.
Gyau-Boakye, P., and Dapaah-Siakwan, S., 1999, Groundwater: solution to Ghana’s rural water supply industry?: The Ghana Engineer, Accra, Ghana, p. 8.
Kesse, G. O., 1985, The mineral and rock resources of Ghana: A.A Balkema, Rotterdam, p. 610.
Kwei, C. A., 1997, Evaluation of groundwater potential in the Northern Region of Ghana: Canadian International Development Agency (CIDA) Accra, Ghana, p. 69.
Loke, M. H., 2004, Geoelectrical imaging 2-D & 3-D: Geotomo Software, Malaysia, p. 133.
Author information
Authors and Affiliations
Corresponding author
Rights and permissions
About this article
Cite this article
Ewusi, A., Kuma, J.S. & Voigt, H.J. Utility of the 2-D Multi-Electrode Resistivity Imaging Technique in Groundwater Exploration in the Voltaian Sedimentary Basin, Northern Ghana. Nat Resour Res 18, 267–275 (2009). https://doi.org/10.1007/s11053-009-9102-4
Received:
Accepted:
Published:
Issue Date:
DOI: https://doi.org/10.1007/s11053-009-9102-4