
Abstract
A novel series of naphthalimide polyamine conjugates were designed, synthesized and evaluated for in vitro antiproliferative activity against human leukemia (Jurkat), human cervical adenocarcinoma (HeLa), human breast adenocarcinoma (MCF-7) and human lung adenocarcinoma (A549) cell lines. From the six derivatives, the new I1 and A3 exhibited highest antiproliferative activity with the IC50 values of 5.67–11.02 μmol·L−1. Cell cycle analysis of Jurkat cells exposed to I1 at a concentration of 30 μmol × L−1 for 24 h exhibited a mild increase in S and G2/M fraction caused by accumulation of cells. This arrest was followed by an increase in sub-G0/G1 after 48 h of incubation. Jurkat cells exposed to A3 at a concentration of 30 μmol × L−1 for 24 h showed an increase in G0/G1 fraction and after 48 h an increase in G2/M fraction followed by an increase in sub-G0/G1 after 72 h of incubation. Moreover, the A3 compound was observed to displace the intercalating agent ethidium bromide from calf thymus DNA using fluorescence spectroscopy. The apparent binding constant was estimated to be 3.1 × 10⁶ M−1 what indicates non-intercalating mode of DNA binding. On the other hand, we found no inhibitory effect of studied compounds on topoisomerase I and topoisomerase II activity. Finally, the localization of these compounds in the cells due to their inherent fluorescence was investigated with the fluorescence microscopy. Our results suggest that the naphthalimide polyamine conjugates rapidly penetrate to the cancer cells. Further studies are necessary to investigate the precise mechanism of action and to find out the relationship between the structure, character and position of substituents of naphthalimide polyamine conjugates and their biological activities.
Introduction
The design, synthesis and development of new selective antitumor agents have been one of the main aims in medicinal chemistry for many years. The group of naphthalimide-based anticancer drugs had been attracting attention due to their antitumor activities in the last decades. Naphthalimides and bisnaphthalimides are well-known DNA-intercalating drugs and some of them (amonafide and elinafide) have reached the clinical trials [1]. The bisnaphthalimide elinafide (LU79553) has progressed to clinical trials against solid tumors [2]. However the early generations of naphthalimides were effective in phase 2 clinical trials, especially amonafide showed unpredictable dose-limiting bone marrow toxicity caused by the toxic N-acetyl-amonafide generated through N-acetylation by N-acetyltransferase 2 [3]. It was effort for developing other active compounds without described toxicity. A few years ago Brana and his co-workers [4–6] synthesized series of naphthalimides with imidazole, pyrazine, furan and thiophene ring and some of them showed enhanced cytotoxic activity against cancer cells in vitro in comparison to amonafide. The new generation of naphthalimide analogues like UNBS5162 [7, 8] and R16 [9] not only remove the potential unpredictable toxicity risks of the early ones, but also retain their anticancer activity [3]. In the present UNBS5162 undergoes phase 1 clinical trials in patients with advanced solid tumors and lymphoma [7, 8], which makes it potential agent to enter clinical anticancer therapy. In these compounds has been described a different type of mechanism of action. UNBS5162 uniquely antagonizes CXCL chemokine expression [8], the naphthalimides amonafide and R16 inhibit DNA topoisomerase II and stabilize cleavable complexes. Also both of them induce DNA double-strand breaks and arrest cell cycle at the G2/M phase [9]. We developed the new conjugates, which have naphthalimide chromophore fused with pyridine by polyamines chain.
The naturally occurring polyamines such as putrescine, spermine and spermidine play an important role in the cell growth and cell differentiation. They represent a crucial factor keeping balance between cell growth and apoptosis. Direct binding of polyamines to DNA and their ability to modulate DNA–protein interactions appear to be important in the molecular mechanisms of polyamine action in cell proliferation [10]. Their increased concentration in the cancer cells is associated with initiation and progression of the tumors. The polyamine analogues have demonstrated considerable activity against many important solid tumor models, but precise mechanisms of their antitumor activities are not entirely understood [11]. Many anticancer drugs posses poor tumor selectivity and their therapy causes high incidences of side effects, which is the main reason for improving the tumor selectivity, efficiency and safety of potentially new antitumor drugs. Antitumor agents with polyamine motifs may have enhanced affinity for cancer cells and reach the targeted tissues more specifically [12]. Number of polyamine conjugates have been designed and synthesized following this strategy. The polyamine metabolic pathway also seems to be a promising target for effective strategies in cancer chemoprevention and chemotherapy [13]. This is one of the main reasons why this group of natural and synthetic compounds has been attracting an interest of scientists over last decades. In our work we focused on the compounds consisting of naphthalimide (DNA intercalator) and polyamines (important biological effect) chain.
Materials and methods
Chemistry
General information
Chemicals were commercially available and used without further purification. NMR spectra were recorded on a Varian Mercury Plus spectrometer at 400 MHz for 1H NMR and 100.6 for 13C NMR. Chemical shifts are reported in δ units (ppm) relative to tetramethylsilane. Mass spectra were obtained with Jeol JMS-600 spectrometer using EI technique.
The Imines I1 and I2 were synthesized according to published procedure [14].
I3 2-(6-{[1-Pyridin-2-yl-meth-(E)-ylidene]-amino}-hexyl)-benzo[de]isoquinoline-1,3-dione

A suspension of naphthalic anhydride (5 g, 25 mmol) in water (25 ml) was added dropwise to an solution of 1,6-aminohexane (19.8 g, 0.17 mol) in water (50 ml) kept at 70 °C. The reaction mixture was heated at 80 °C for 15 min and filtered. The filtrate was kept at 4 °C overnight and 4.067 g (54 %) of solid precipitate of N-(6-aminohexyl)-1,8-naphthalimide was collected. To a solution of N-(6-aminohexyl)-1,8-naphthalimide (1.48 g, 5 mmol) in dichloromethane (150 ml) was added 2-pyridinecarbaldehyde (0.478 ml, 0.536 g, 5 mmol) and the mixture was stirred for 24 h. The solvent was then evaporated and residue purified by chromatography on silica gel using dichloromethane/methanol/triethylamine (96:2:2) as an eluent to give 1.442 g (74.8 %) of imine I3.
1H NMR (CDCl3, 400 MHz) δ1.45 (m, 4H), 1.73 (m, 4H), 3.65 (t, J = 6.8 Hz, 2H), 4.15 (t, J = 7.5 Hz, 2H), 7.26 (t, J = 6.0 Hz, 1H), 7.70 (t, J = 7.7 Hz 2H), 7.94 (d, J = 8.1 Hz, 1H), 8.15 (d, J = 8.4 Hz, 2H), 8.34 (s, 1H), 8.54 (d, J = 7.3 Hz, 2H), 8.60 (d, J = 4.8 Hz, 1H).
13C NMR (CDCl3, 100.6 MHz) δ 26.89 (t), 27.02 (t), 27.99 (t), 30.56 (t), 40.26 (t), 61.33 (t), 121.12 (d), 122.53 (s), 124.47 (d), 126.75 (d), 127.90 (s), 130.94 (d), 131.36 (s), 133.66 (d), 136.40 (d), 149.26 (d), 154.55 (s), 161.59 (d), 163.92 (s).
MS (EI): 385 [M+]; HRMS calcd. for C24H23N3O2: 385.1790. Found: 385.1803.
General procedure for the reduction of imines (I1–I3) to amines (A1–A3)
The imine (2 mmol) was dissolved in 20 ml of dichloromethane/methanol (1:1) mixture and sodium borohydride (303 mg, 8 mmol) was added. The mixture was stirred for 4 h and after addition of 10 ml of saturated aqueous sodium carbonate was stirred for 15 min. Organic layer was separated and water layer was extracted with dichloromethane (2 × 10 ml). Combined organic extracts were dried over sodium sulfate, filtered and the solvents evaporated. Crude product was purified by chromatography on silica gel using dichloromethane/methanol (19:1) containing 0.5 % of triethylamine as an eluent.
A1 2-{2-[(Pyridin-2-ylmethyl)-amino]-ethyl}-benzo[de]isoquinoline-1,3-dione

This compound was synthesized according to the general procedure using 659 mg (2 mmol) of imine I1 and yielding 452 mg (68.2 %) of amine A1.
1H NMR (CDCl3, 400 MHz) δ 2.53 (bs, 1H), 3.08 (t, J = 6.5 Hz 2H), 4.01 (s, 2H), 4.41 (t, J = 6.5 Hz, 2H), 7.10 (dd, J = 4.9, 7.5 Hz, 1H), 7.30 (d, J = 7.7 Hz, 1H), 7.58 (dt, J = 1.6, 7.7 Hz, 1H), 7.75 (dd, J = 7.3, 8.2 Hz, 2H), 8.21 (d, J = 8.3 Hz, 2H), 8.47 (d, J = 4.1 Hz, 1H), 8.60 (d, J = 7.2 Hz, 2H).
13C NMR (CDCl3, 100.6 MHz) δ 40.01 (t), 47.49 (t), 54.77 (t), 122.05 (d), 122.39 (d), 122.77 (s), 127.04 (d), 128.23 (s), 131.42 (d), 131.70 (s), 134.09 (d), 136.55 (d), 149.37(d), 159.44 (s), 164.44 (s).
MS (EI): 331 [M+]; HRMS calcd. for C20H17N3O2: 331.1321. Found: 331.1315.
A2 2-{4-[(Pyridin-2-ylmethyl)-amino]-butyl}-benzo[de]isoquinoline-1,3-dione

This compound was synthesized according to the general procedure using 715 mg (2 mmol) of imine I2 and yielding 654 mg (91 %) of amine A2.
1H NMR (CDCl3, 400 MHz) δ 1.68 (m, 2H), 1.79 (m, 2H), 2.27 (bs, 1H), 2.74 (t, J = 7.2 Hz 2H), 3.92 (s, 2H), 4.21 (t, J = 7.4 Hz, 2H), 7.13 (dd, J = 4.9, 7.5 Hz, 1H), 7.31 (d, J = 7.8 Hz, 1H), 7.62 (dt, J = 1.8, 7.7 Hz, 1H), 7.74 (dd, J = 7.5, 8.0 Hz, 2H), 8.20 (d, J = 8.3 Hz, 2H), 8.53 (d, J = 4.8 Hz, 1H), 8.58 (d, J = 7.4 Hz, 2H).
13C NMR (CDCl3, 100.6 MHz) δ 26.02 (t), 27.68 (t), 40.27 (t), 49.36 (t), 55.26 (t), 122.00 (d), 122.37 (d), 122.77 (s), 127.01 (d), 128.23 (s), 131.29 (d), 131.66 (s), 133.98 (d), 136.55 (d), 149.36(d), 159.79 (s), 164.27 (s).
MS (EI): 331 [M+]; HRMS calcd. for C22H21N3O2: 359.1634. Found: 359.1631.
A3 2-{6-[(Pyridin-2-ylmethyl)-amino]-hexyl}-benzo[de]isoquinoline-1,3-dione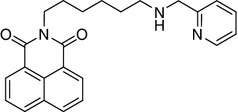

This compound was synthesized according to the general procedure using 715 mg (2 mmol) of imine I3 and yielding 748 mg (96.5 %) of amine A3.
1H NMR (CDCl3, 400 MHz) δ 1.44 (m, 4H), 1.58 (m, 2H), 1.74 (m, 2H), 2.32 (bs, 1H), 2.67 (t, J = 7.2 Hz 2H), 3.91 (s, 2H), 4.17 (t, J = 7.5 Hz, 2H), 7.15 (dd, J = 4.9, 7.5 Hz, 1H), 7.31 (d, J = 7.7 Hz, 1H), 7.63 (dt, J = 1.7, 7.6 Hz, 1H), 7.75 (t, J = 7.8 Hz, 2H), 8.20 (d, J = 8.0 Hz, 2H), 8.54 (d, J = 4.8 Hz, 1H), 8.59 (d, J = 7.0 Hz, 2H).
13C NMR (CDCl3, 100.6 MHz) δ 27.12 (t), 27.16 (t), 28.18 (t), 30.04 (t), 40.46 (t), 49.65 (t), 55.28 (t), 122.02 (d), 122.41 (d), 122.83 (s), 127.01 (d), 128.24 (s), 131.27 (d), 131.67 (s), 133.94 (d), 136.55 (d), 149.38(d), 159.77 (s), 164.27 (s).
MS (EI): 387 [M+]; HRMS calcd. for C24H25N3O2: 387.1947. Found: 387.1941.
Synthetic scheme of naphthalimide derivatives A1, A2, A3 and I1, I2, I3 is presented in Fig. 1.

Synthetic scheme of naphthalimide derivatives A1, A2, A3 and I1, I2, I3
Stock solutions of compounds were solubilised in DMSO (MP Biomedicals, USA) diluted to 5 × 10⁻² mol × L−1.
Cell culture
Jurkat, HeLa, MCF-7, and A549 cell lines were kindly provided by Dr. M. Hajdúch (Olomouc, Czech Republic). The cells were routinely maintained in RPMI 1640 medium with l-Glutamine and HEPES (Jurkat, HeLa) or Dulbecco’s modified Eagle’s medium with Glutamax-I (MCF-7, A-549) supplemented with 10 % fetal bovine serum (FBS), penicillin (100 IU × mL−1) and streptomycin (100 μg × mL−1) (all from Invitrogen, USA), in humidified air with 5 % CO2 at 37 °C. Before each MTT assay, cell viability was determined by trypan blue exclusion method and it was greater than 95 %.
MTT assay
The antiproliferative effects of compounds were determined using colorimetric microculture assay with the MTT end-point [15]. Briefly, 2 × 10³ (A549, MCF-7), 8 × 10³ (HeLa) or 4 × 10³ (Jurkat) cells in 80 μL of suspension were plated per well in 96-well polystyrene microplates (Sarstedt, Germany). Adhesive solid tumor cells (HeLa, A549 and MCF-7) were seeded 24 h before adding the compounds. Further, 20 μL fresh culture medium containing tested chemicals at final concentrations of (0.001, 0.01, 0.1, 1, 10, 100 μmol × L−1) were added. After 72 h of incubation, 10 μL of MTT (5 mg × mL−1) (Sigma, Germany) were added in each well. After additional 4 h, during which insoluble formazan was produced, 100 μL of 10 % sodium dodecyl-sulfate (SDS) were added into each well and another 12 h were allowed for the dissolution of formazan. Diminazene aceturate (Berenil®) was obtained from the Sigma-Aldrich (Germany) and it was used as a reference drug. The absorbance was measured at 540 nm using the automated MRX microplate reader (Dynatech Laboratories, UK). The blank-corrected absorbance of the control wells was taken as 100 % and the results were expressed as a percentage of the control. All experiments were performed in triplicate.
Fluorescence binding studies
DNA binding studies were performed with fluorescent intercalator displacement assay. Ethidium bromide (EtBr) and calf thymus DNA (CT-DNA) were obtained from Sigma. All experiments were carried out in sodium phosphate buffer (0.01 mol × L−1, pH 7.0) at room temperature. The emission spectra of studied compound and CT-DNA–EtBr complex were recorded on a Varian Cary Eclipse fluorescence spectrophotometer with a 5 nm excitation and emission slits and excitation wavelength 290 nm. The complex of CT-DNA (70 μg × mL−1) and EtBr (16 μmol × L−1) in phosphate buffer was titrated with 16 μmol × L−1 aliquots of studied compound with gently stirring. Total volume of solution in fluorescence cuvette was 3 ml. The measurements were repeated at least three times. The apparent binding constant (K app ) was calculated from the equation K EtBr [EtBr] = K app [X] [16], where K EtBr = 1.0 × 10⁷ M−1 [17] and [X] corresponds to the concentration of ligand at which 50 % reduction of fluorescence intensity of complex EtBr–CT-DNA was observed.
Cellular localization
The monolayer growing cells were treated with trypsin and placed on the sterile cover slips in 60 mm dishes (Sarstedt, USA) at density of 1 × 10⁵ cells. After 24 h there were the tested compounds added at concentrations of 10, 30 and 50 μmol × L−1 respectively. The cells were incubated for 2, 4, 8, and 12 h. After incubation, the medium was removed and the cells were washed with PBS. The cover slips were removed from the dishes and mounted on glass slide. The fluorescence was visualized and photographed under UV excitation (400 nm) using a Leica DMI6000B microscope (Leica Microsystems, Germany).
Topoisomerase inhibition assay
The inhibition of DNA topoisomerases was carried out using plasmid DNA pUC19 isolated from Escherichia coli DH5α strain. Plasmid DNA and tested ligands (I1, A3) were incubated for 24 h at 37 °C in volume ratio 1:1 at concentration 100, 75, 50, 25, and 10 μmol × L−1 respectively. Positive controls used: camptothecin (Sigma-Aldrich, Gemany) and etoposide (Ebewe BASF Pharma, Austria) at concentration 30 μmol × L−1. After incubation topoisomerase I (New England BioLabs, England) and topoisomerase II (Sigma-Aldrich, Germany) were added 8U per sample and next incubation at 37 °C for 8–10 h and then the samples were removed to laboratory temperature for 12–16 h. The reaction was stopped adding 2 μL 6 × DNA loading dye (Fermentas, Germany). The electrophoresis was performed on 1 % agarose gel in the presence of Gel Red® dye (Biotium, USA) and separation of the samples was visualized by UV transluminator.
Cell cycle analysis
Cell cycle distribution in cells treated with the tested agents was analyzed by propidium iodide (PI) DNA staining using a Cycle TEST™ PLUS DNA Reagent Kit (Becton–Dickinson, USA). Briefly, 5 × 10⁵ Jurkat cells were treated with compounds I1 and A3 at concentration 30 μmol × L−1 for 24, 48 and 72 h. After treatment, cells were harvested and washed twice in PBS. Then, they were processed and stained according to the manufacturer’s instructions. After staining, samples were immediately acquired on a BD FACSCanto™ flow cytometer using CellQuest software (Becton–Dickinson, USA). Ten thousand cells were required per analysis. PI fluorescence was detected in the pulse-processed FL3 channel (630/22 nm band pass filter). Results were analyzed using Win MDI software and expressed in the form of histograms. Percentages of cells corresponding to G0/G1, S and G2/M phases of the cell cycle were calculated. After DNA fragmentation small fragments of DNA stained with a quantitative DNA-binding dye, take up less stain and appear to the left of the G0/G1 peak that why cells with DNA content less than that of G0/G1-phase cells are considered to be apoptotic (sub-G0/G1). Performance of the instrument and sensitivity of measurement were checked prior to acquisition by using a DNA QC Particle Kit (Becton–Dickinson, USA).
Statistical analysis
Statistical data are expressed as mean ± SD. Student’s t test and analysis of variance were employed to determine statistical significance. Values of P < 0.05 were considered to be statistically significant.
Results and discussion
Antiproliferative activity
The in vitro antiproliferative activity of novel conjugates was examined by the MTT assay against four cancer cell lines (Jurkat, HeLa, MCF-7, and A549). The results shown in Table 1 reveal, the IC50 values of the naphthalimide derivatives ranging between 5.6 and 11.0 μmol × L−1. The tested compounds are more effective in growth inhibition in comparison to minor groove binder diminazene aceturate (Berenil®) especially in Jurkat leukemia cells. We selected the typical DNA binding agent with intercalating and minor groove binding properties [18] to compare growth inhibition with new potential DNA binding compounds. The potency of I1 and A3 compounds was lower, but still comparable with mitonafide [19] and with mono- and bisnaphthalimides in the human HT-29 cell line with IC50 values range from 0.04 to 6.1 μmol × L−1 [20]. Actually we observed about 50 % lower IC50 in case of A549 cells than Li with co-workers using amonafide [21]. The IC50 values over 50 μmol × L−1 were not relevant for next experiments, because it represents a half of the maximum concentration used. All compounds except A1 exhibit antiproliferative effect for the human leukemia Jurkat cells. The most potent were the I1 and A3 compounds, which significantly inhibit cell growth of the three lines tested.
These two compounds showed similar antiproliferative activity against MCF-7 cell like bisnapthalimidopropyl polyamine derivatives synthesized by Pavlov and co-workers. The IC50 values of I1 and A3 were 6.53 and 5.67 μmol × L−1 compared to 1.38–8.45 μmol × L−1 of bisnapthalimidopropyl compounds. Whereas the compound with the shortest polyamine linker (BNIPSpd) between the two propylnaphthalimido moieties was found to be the most active compound (IC50 = 1.38 μmol × L−1). It was described, that increase in the length of the polyamine chain between the two naphthalimide groups in the structure of BNIPSpm led to an increase in its IC50 [22]. We have not observed this phenomenon. Almost identical results in growth inhibition using I1 and A3 against Jurkat, MCF-7 and A549 cancer cells were observed. Interestingly, I1 and A3 show very similar antiproliferative effect in face of their structure. The I1 is a derivative with the shortest polyamine side chain with a double bond and the A3 is a derivative with the longest side chain and a single bond. We suppose that the polyamine chain length of I1 and A3 compounds did not play a role in the growth inhibition. This finding suggests that the positively charged nitrogen atoms of polyamine chain may interact with the anionic part of DNA and biological activity was probably enhanced by amino group localized in polyamine chain. However, correlations between the antiproliferative effect, structure and length of the side chain of tested compounds were not validated. The lowest antitumor activity was found in A1, which IC50 values were over 50 μmol × L−1 in all the tested cell lines. On the other hand, there was a very weak antiproliferative activity exhibited against HeLa cells, which could indicate a potential tumor selectivity of novel naphthalimide derivatives. We selected compounds A3 and I1 for the next experiments in light of their highest antiproliferative activity against tested tumor cell lines.
Ethidium displacement assay
The fluorescent intercalator (EtBr) displacement assay was used to establish binding affinity of novel A3 derivative within DNA. Standard intercalator EtBr displays a significant increase of fluorescence intensity after intercalation into the DNA base pairs. The fluorescence enhance of CT-DNA–EtBr complex can be quenched by the other intercalating ligands [23] or a groove binder [24]. The basis of assay is the decreasing in the emission fluorescent intensity of the pre-bound EtBr due to addition of concentrations of the tested ligand A3. The found C50 value (ligand concentration, which gives a 50 % decrease in the fluorescence of complex CT-DNA–EtBr) of A3 (C50 = 51 × 10−6 mol × L−1) displaces 16 × 10−6 mol × L−1 of EtBr which indicates, that A3 is not a perfect intercalator agent such as EtBr is (Fig. 2). The apparent binding constant of A3 with CT-DNA was calculated to be 3.1 × 10⁶ M−1. EtBr shows higher values of binding constant than groove binders [25, 26]. The ethidium displacement assay supports the non-intercalating or groove-binding mode. In case of the I1 decreasing of fluorescence CT-DNA–EtBr was not observed (data not shown).

Decreasing of fluorescence intensity of CT-DNA (70 μg × mL−1) and EtBr (16 μmol × L−1) because of increasing concentrations of A3 at 610 nm. Results were obtained in three independent experiments
Cell penetration and key enzymes inhibition
We used inherent fluorescence properties of the tested naphthalimide derivatives to confirm their penetration to the tumor cells and subcellular distribution. The fluorescence of A3 and I1 in the membranes, cytoplasm and nuclei after 2 h drug exposure is shown in Fig. 3. The rate of the penetration into the tumor cells of the tested naphthalimide polyamine conjugates was higher than bisnaphthalimidopropyl polyamine derivatives, with similar antiproliferative properties against MCF-7 cells [22]. The penetration was observed for 0 h in practice a few minutes after exposure to the tested drugs (not shown).

A549 cells incubated with I1 (a) and A3 (b) (both 30 μmol × L−1) for 2 h visualized by fluorescence microscopy (×40). The compounds penetrate cell membrane and they are localized in the cytoplasm and nuclei. The picture c is negative control—A549 cells without any derivative. This is a representative picture of one of three separate experiments with similar results
As compared with the bisnaphthalimidopropyl ones, I1 and A3 are characterized by rapid penetration through cell membranes. Similar results were documented also by Dance et al. [27] who found rapid cellular distribution of a new bisoxynaphthalimidopolyamines in cancer cells. As they concluded, induction of DNA damage was consistent with rate of uptake of naphthalimide polyamines into the cells.
To detect some key enzymes inhibition we performed the topoisomerase and polymerase inhibition assays. Both of the tested derivatives were tested on polymerase inhibition by standard PCR reaction [28]. Any inhibition effect at a concentration range 10–100 μmol × L−1 was observed neither with A3 nor I1 (not shown). The antiproliferative effect of these derivatives is not established on interference of replication via DNA-polymerase.
The next key enzymes to analyze their potential inhibition were DNA topoisomerase I and topoisomerase IIα. Compounds I1 and A3 were evaluated by using DNA plasmid pUC19 as substrate for the topoisomerase I and the recombinant human DNA topoisomerase IIα assays to verify whether the tested compounds act as topoisomerase inhibitors eventually topoisomerase IIα poisons [29]. Our findings did not confirm any topoisomerase I inhibition using tested concentrations 10–100 μmol × L−1. Furthermore, we found topoisomerase II inhibition in both tested compounds only at the highest tested concentration (100 μmol × L−1; not shown). Based on the results of our experimental data, we suggest these compounds do not belong to the family of topoisomerase II inhibitors. Our data indicates different mechanism of action as it was documented by Ingrassia and co-workers [30].
Cell cycle analysis
The results of cell cycle analysis are shown in Table 2. Cell cycle analysis of Jurkat cells exposed to I1 at a concentration of 30 μmol × L−1 for 24 h exhibited a mild increase in S and G2/M fraction caused by accumulation of cells. This arrest is followed by an increase in sub-G0/G1 after 48 h of incubation. Jurkat cells exposed to A3 at a concentration of 30 μmol × L−1 for 24 h showed an increase in G0/G1 fraction and after 48 h an increase in G2/M fraction followed by an increase in sub-G0/G1 after 72 h of incubation. The increase of G2/M fraction is probably caused by block in mitosis.
This data indicates that compound A3 at a concentration of 30 μmol × L−1 is more active compared to I1 and induced G0/G1 and G2/M arrest leading to non repairable damage followed to apoptosis.
Conclusions
We synthesized six novel naphthalimide polyamine derivatives with the pyridine molecule. The only most potent compounds A3 and I1 we used for the next experiments. These structures possessed significant antiproliferative activity against various human cancer cell lines comparable to mitonafide, amonafide and another related derivatives. Interestingly, the compounds showed ability to rapidly penetrate into cancer cells. We localized A3 and I1 in cell′s cytoplasm and nuclei due to their inherent fluorescence properties. Since we did not prove any inhibition of key enzymes (polymerase and topoisomerases I, II), we suggest that the antiproliferative effect of novel derivatives lies in binding to the DNA in a non-specific manner. The apparent binding constant and structure of A3 supports a minor groove binding mode. Exactly the strong interactions with DNA play a crucial role for their pharmacological properties [20]. Moreover, we found G0/G1 and G2/M arrest in the Jurkat cells using derivatives A3 and I1. Potential pathway to apoptosis is not caused by topoisomerases inhibition, but possible minor groove binding or another mechanism of action. The present work opens up new options to development of DNA-targeted antitumor agents. Our results generate a rationale for in vivo efficacy studies with these compounds in preclinical cancer models.
Abbreviations
- A549:
-
Human lung adenocarcinoma cell line
- DMSO:
-
Dimethyl sulfoxide
- EtBr:
-
Ethidium bromide
- Jurkat:
-
Human T cell acute lymphoblastic leukemia
- HeLa:
-
Human cervical adenocarcinoma
- MCF-7:
-
Human breast adenocarcinoma
- MTT:
-
3-(4,5-dimethylthiazol-2-yl)-2,5-diphenyltetrazolium bromide
- CT-DNA:
-
Calf thymus DNA
- PBS:
-
Phosphate buffered saline
References
Brana FM, Cacho M, Garcia MA, Pascual-Teresa B, Ramos AM, Dominguez T, Pozuelo JM, Abradelo C, Rey-Stolle MF, Yuste M, Banez-Coronel M, Lacal JCJ (2004) New analogues of amonafide and elinafide, containing aromatic heterocycles: synthesis, antitumor activity, molecular modeling, and DNA binding properties. Med Chem 47:1391–1399
Villalona-Calero MA, Eder JP, Toppmeyer DL, Allen LF, Fram R, Velagapudi R, Myers M, Amato A, Kagen-Hallet K, Razvillas B, Kufe DW, Von Hoff DD, Rowinsky EK (2001) Phase I and pharmacokinetic study of LU79553, a DNA intercalating bisnaphthalimide, in patients with solid malignancies. J Clin Oncol 19:857–869
Zhu H, Miao ZH, Huang M, Feng JM, Zhang ZX, Lu JJ, Cai YJ, Tong LJ, Xu YF, Qian XH, Ding J (2009) Naphthalimides induce G2 arrest through the ATM-activated Chk2-executed pathway in HCT116 Cells. Neoplasia 11:1226–1234
Brana FM, Cacho M, Garcia MA, Pascual-Teresa B, Ramos A, Acero N, Llinares F, Munoz-Mingarro D, Abradelo C, Rey-Stolle MF, Yuste M (2002) Synthesis, antitumor activity, molecular modeling, and DNA binding properties of a new series of imidazonaphthalimides. J Med Chem 45:5813–5816
Brana FM, Cacho M, Ramos A, Dominguez MT, Pozuelo JM, Abradelo C, Rey-Stolle MF, Yuste M, Carrasco C, Bailly C (2003) Synthesis, biological evaluation and DNA binding properties of novel mono and bisnaphthalimides. Org Biomol Chem 1:648–654
Brana FM, Gradillas A, Gomez A, Acero N, Llinares F, Munoz-Mingarro D, Abradelo C, Rey-Stolle F, Yuste M, Campos J, Gallo MA, Espinosa A (2004) Synthesis, biological activity, and quantitative structure-activity relationship study of azanaphthalimide and arylnaphthalimide derivatives. J Med Chem 47:2236–2242
Quaquebeke EV, Mahieu T, Dumont P, Dewelle J, Ribaucour F, Simon G, Sauvage S, Gaussin JF, Tuti J, Yazidi ME, Van Vynckt F, Mijatovic T, Lefranc F, Darro F, Kiss R (2007) 2,2,2-Trichloro-N-({2-[2-(dimethylamino)ethyl]-1,3-dioxo-2,3-dihydro-1H-benzo[de]isoquinolin-5-yl}carbamoyl)acetamide (UNBS3157), a novel nonhematotoxic naphthalimide derivative with potent antitumor activity. J Med Chem 50:4122–4134
Mijatovic T, Mahieu T, Bruyère C, Nève ND, Dewelle J, Simon G, Dehoux MJM, Aar E, Haibe-Kains B, Bontempi G, Decaestecker Ch, Quaquebeke EV, Darro F, Kiss R (2008) UNBS5162, a novel naphthalimide that decreases CXCL chemokine expression in experimental prostate cancers. Neoplasia 10:573–586
Zhu H, Huang M, Yang F, Chen Y, Miao ZH, Qian XH, Xu YF, Qin YX, Luo HB, Shen X, Geng MY, Cai YJ, Ding J (2007) R16, a novel amonafide analogue, induces apoptosis and G2-M arrest via poisoning topoisomerase II. Mol Cancer Ther 6:484–495
Thomas T, Thomas TJ (2001) Polyamines in cell growth and cell death: molecular mechanisms and therapeutic applications. Cell Mol Life Sci 58:244–258
Huang Y, Hager ER, Phillips DL, Dunn VR, Hacker A, Frydman B, Kink JA, Valasinas AL, Reddy VK, Marton LJ, Casero RA Jr, Davidson NE (2003) A novel polyamine analog inhibits growth and induces apoptosis in human breast cancer cells. Clin Cancer Res 9:2769–2777
Tian ZY, Xie SQ, Du YW, Ma YF, Zhao J, Gao WY, Wang ChJ (2009) Synthesis, cytotoxicity and apoptosis of naphthalimide polyamine conjugates as antitumor agents. Eur J Med Chem 44:393–399
Basuroy UK, Gerner EW (2006) Emerging concepts in targeting the polyamine metabolic pathway in epithelial cancer chemoprevention and chemotherapy. J Biochem 139:27–33
Licchelli M, Biroli AO, Poggi A, Sacchi D, Sangermani C, Zema M (2003) Excimer emission induced by metal ion coordination in 1,8-naphthalimide-tethered iminopyridine ligands. Dalton Trans 3:4537–4545
Mossman T (1983) Rapid colorimetric assay for cell growth and survival: application to proliferation and cytotoxicity assays. J Immunol Methods 65:55–63
Ghosh R, Bhowmik S, Bagchi A, Das D, Ghosh S (2010) Chemotherapeutic potential of 9-phenyl acridine: biophysical studies on its binding to DNA. Eur Biophys J 39:1243–1249
Morgan AR, Lee JS, Pulleyblank DE, Murray NL, Evans DH (1979) Ethidium fluorescence assays. Part 1 physicochemical studies. Nucleic Acids Res 7:547–569
Pilch DS, Kirolos MA, Liu X, Plum GE, Breslauer KJ (1995) Berenil [1,3-bis(4′-amidinophenyl)triazene] binding to DNA duplexes and to a RNA duplex: evidence for both intercalative and minor groove binding properties. Biochemistry 34:9962–9976
Tumiatti V, Milelli A, Minarini A, Micco M, Campani AG, Roncuzzi L, Baiocchi D, Marinello J, Capranico G, Zini M, Stefanelli C, Melchiorre C (2009) Design, synthesis, and biological evaluation of substituted naphthalene imides and diimides as anticancer agent. J Med Chem 52:7873–7877
Filosa R, Peduto A, Micco SD, Caprariis P, Festa M, Petrella A, Capranico G, Bifulco G (2009) Molecular modelling studies, synthesis and biological activity of a series of novel bisnaphthalimides and their development as new DNA topoisomerase II inhibitors. Bioorg Med Chem 17:13–24
Li F, Cui J, Guo L, Qian X, Ren W, Wang K, Liu F (2007) Molecular design, chemical synthesis, and biological evaluation of ‘4-1’ pentacyclic aryl/heteroaryl-imidazonaphthalimides. Bioorg Med Chem 15:5114–5121
Pavlov V, Kong Thoo Lin P, Rodilla V (2001) Cytotoxicity, DNA binding and localisation of novel bis-naphthalimidopropyl polyamine derivatives. Chem-Biol Interact 137:15–24
Vaidyanathan VG, Nair BU (2003) Synthesis, characterization and binding studies of chromium(III) complex containing an intercalating ligand with DNA. J Inorg Biochem 95:334–342
Shim YH, Arimondo PB, Laigle A, Garbesi A, Lavielle S (2004) Relative DNA binding affinity of helix 3 homeodomain analogues, major groove binders, can be rapidly screened by displacement of prebound ethidium bromide. Comp study Org Biomol Chem 2:915–921
Boger DL, Fink BE, Hedrick MP (2000) Total synthesis of distamycin A and 2640 analogues: a solution-phase combinatorial approach to the discovery of new, bioactive DNA binding agents and development of a rapid, highthroughput screen for determining relative DNA binding affinity or DNA binding semence selectivity. J Am Chem Soc 122:6382–6394
Lee M, Rhodes AL, Wyatt MD, Forror S, Hartley JA (1993) GC base sequence recognition by oligoimidazolecarboxamide and C-terminusmodified analogs of distamycin deduced from circular dichroism, proton nuclear magnetic resonance, and methidium-propylethylenediaminetetraacetate–iron(II) footprinting studies. Biochemistry 32:4237–4245
Dance AM, Ralton L, Fuller Z, Milne L, Duthie S, Bestwick CS, Lin PK (2005) Synthesis and biological activities of bisnaphthalimido polyamines derivatives: cytotoxicity, DNA binding, DNA damage and drug localization in breast cancer MCF 7 cells. Biochem Pharmacol 69:19–27
Lunn RM, Langlois RG, Hsieh LL, Thompson CL, Bell DA (1999) XRCC1 polymorphisms: effects on aflatoxin B1-DNA adducts and glycophorin A variant frequency. Cancer Res 59:2557–2561
De Isabella P, Zunino F, Capranico G (1995) Base sequence determinants of amonafide stimulation of topoisomerase II DNA cleavage. Nucleic Acids Res 23:223–229
Ingrassia L, Lefranc F, Kiss R, Mijatovic T (2009) Naphthalimides and azonafides as promising anti-cancer agents. Curr Med Chem 16:1192–1213
Acknowledgments
This work was supported by the Slovak Research and Development Agency under the contract No. APVV-0325-07. This work was also partially supported by the Agency of the Slovak Ministry of Education for the Structural Funds of the EU, under Projects ITMS: 26220120039.
Author information
Authors and Affiliations
Corresponding author
Rights and permissions
About this article
Cite this article
Seliga, R., Pilatova, M., Sarissky, M. et al. Novel naphthalimide polyamine derivatives as potential antitumor agents. Mol Biol Rep 40, 4129–4137 (2013). https://doi.org/10.1007/s11033-013-2523-5
Received:
Accepted:
Published:
Issue Date:
DOI: https://doi.org/10.1007/s11033-013-2523-5