
Abstract
The results of calorimetric investigations of liquid In–Sn alloys using Oelsen calorimetry are presented in this article. Based on obtained enthalpy space diagram and enthalpy isotherm diagram, thermodynamic parameters for the liquid In–Sn alloys, including mixing and excess integral and partial molar quantities at temperature of 600 K, have been determined and compared with available literature data.
Introduction
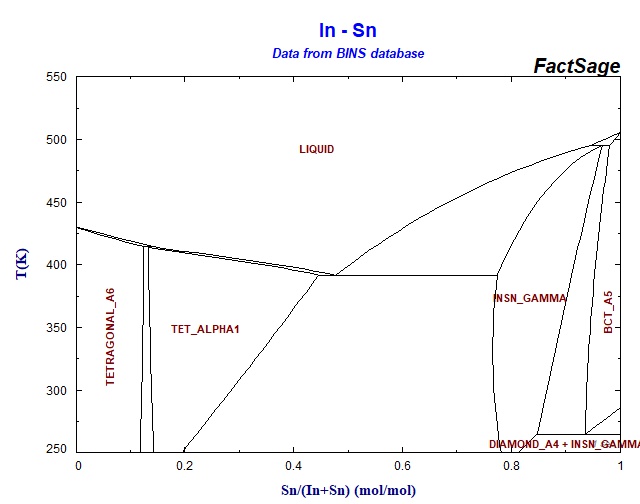
The In–Sn binary system belongs to the wide group of low-melting lead-free alloys [1, 2]. Its phase diagram is well known and defined (i.e., work of Okamoto [3], SGTE BINARY free binary alloy database calculated by FACT [4], etc.), as presented in Fig. 1 according to Ref. [3]. Also, there are other literature data concerning phase equilibria investigation of mentioned binary system [5–8].

Phase diagram of the In–Sn binary system [3]
Thermodynamic behavior of In–Sn system has been widely investigated up to now, by different researchers. Liquid In–Sn alloys have been determined using EMF measurements by Terpilowski et al. [9] and Cakir et al. [10], while Kleppa [11], Wittig et al. [12], and Yazawa et al. [13] expolored them using direct reaction calorimetry, and newest reference by Brunetti et al. [14]. Optimal thermodynamic activities for indium and tin, as well as integral molar quantities for the In–Sn system, has been selected by Hultgren et al. [15] and, recently, in COST531 Thermodynamic Database [16].
The results of experimental determination of thermodynamic parameters for investigated binary In–Sn systems, obtained using Oelsen thermodynamic quantitative analysis, are presented in this article, as a contribution to the thermodynamic knowledge of mentioned lead-free system.
Experimental
The Oelsen calorimetry method was used for the experimental thermodynamic analysis of the binary In–Sn system. Detailed descriptions of this experimental technique are reported in Refs. [17–24], while schematic representation of the used Oelsen water calorimeter is given in Fig. 2.

Oelsen calorimeter (1 Dewar flask; 2 water; 3 Beckman thermometer; 4 stirrer; 5 NiCr–Ni thermocouple; 6 sample; 7 sample holder; 8 copper sheet; 9 thermal insulation)
Such calorimeter consists of a Dewar flask with water, a stirrer and a thermometer. It also contains a housing from copper sheet into which the iron holder with the sample is added, after these have been heated in a separate oven to the initial temperature. The temperature of the sample is followed with NiCr–Ni thermocouple during cooling and simultaneously the temperature of the water is measured.
The water equivalent for the calorimeter used was determined by a standard method using dissolved Na2CO3 and its value was 4465 J/K.
All experiments were carried out in an air atmosphere, with In and Sn metals of 99.99 mass% purity. Composition and masses of the experimentally investigated alloys are given in Table 1, having constant total volume of 0.3 cm3 for all samples—according to the requirements of the method used. The samples were cooled in the furnace to the room temperature.
Results and discussion
Thermodynamic analysis of the investigated section in the In–Sn system was done according to the Oelsen procedure [17–24]. Based on the cooling curves obtained by calorimetric measurements, temperature changes of the calorimeter were determined for all samples in the temperature range up to 800 K. According to these data, the enthalpy space diagram and enthalpy isotherm diagram were constructed and presented in Figs. 3 and 4, respectively. (It should be noted that in presented diagrams 1 K corresponds to the water equivalent equal to 4465 J/K.)

Enthalpy space diagram

Enthalpy isotherm diagram
The basic equation in Oelsen thermodynamic analysis [17–19] is given as:
where are \( G_{i}^{M} \)is the partial molar Gibbs energy for component i, T o is the starting temperature, T is the final temperature, H x,T is the enthalpy value measured in the Oelsen calorimeter for the temperature change from T o to T, R is the gas constant, and a i is the activity of the component i. Further calculation in the thermodynamic analysis was done based on Eq. 1 and the results of the graphic planimetry [17–19], which enabled the determination of activities, activity coefficients and partial molar quantities at 600 K. The results are given in Table 2.
A negative deviation from Raoult law is noticed for the partial thermodynamic quantities of indium at 600 K in whole concentration range, while tin shows weak positive deviation up to the eutectic concentration and negative trend for higher tin contents, indicating to mixing tendencies of both components in the system, especially over the eutectic concentration.
Further step in the investigation of In–Sn behavior was a comparative thermodynamic analysis, in order to compare obtained experimental results by Oelsen calorimetric method with the literature thermodynamic data, taken from COST531 Database [16]. These data, for liquid phase in the In–Sn system, are presented in the form of Redlich–Kister–Muggianu model, given as follows [25]:
where term φ is related to the investigated phase and the parameters are given in Table 3.
Based on given expression and data in Table 3, optimized thermodynamic data for the In–Sn system were calculated and compared with experimental results presented in this work. The comparison, done for investigated temperature 600 K is given in Fig. 5, where reasonable mutual agreement could be noticed.

Comparison between indium and tin activities for the In–Sn system obtained by Oelsen calorimetry (this work) and literature RKM data [16] at 600 K
Also, the results of cooling curves obtained by Oelsen calorimetry were compared with literature phase diagram of In–Sn system [4] (Fig. 6) and good agreement was noticed.

Comparison between literature phase diagram [4] and experimental results obtained from cooling curves
Conclusions
Thermodynamic analysis of binary In–Sn system was done experimentally using Oelsen’s calorimetry at 600 K. Results of the comparative analysis between obtained thermodynamic parameters and literature showed negative deviation from the Raoult’s law for both components over the eutectic concentration, as well as noticeable agreement.
References
Speckbrock G, Kamitz S, Alt M, Schmitt H. Low melting gallium, indium, and tin eutectic alloys, United States Patent 6019509; 2000.
White CET, Okamoto H, editors. Phase diagrams of indium alloys and their engineering applications. Utica, NY: Indium Corporation of America, Ohio: Materials Information Soc., Materials Park; 1992.
http://www.crct.polymtl.ca/fact/Documentation/BINARY/In-Sn.jpg.
Vicentini M, Paoletti A. Self diffusion in liquid In-Sn alloys. Phys Astron. 1959;14:1373–80.
Swarnalata N, Padmini ARKL. Ultrasonic velocities and elastic constants in tin–indium alloys. Patrmana. 1984;23:155–63.
Maciejewski S. Band structure and fermi surface on In3Sn alloys in the β-phase. Phys Status Solidi B. 2006;66:633–38.
Degtyareva VF. The fcc-bcc bain path in In-Sn and related alloys at ambient and high pressure. J Phys. 2009;21:95702–6.
Terpilowski J, Przedziecka-Mycielska E. EMF measurements of In-Sn alloys. Arch Hutn. 1960;5:281–9.
Cakir O, Alpaut O. Thermodynamic properties of solid In-Sn alloys. J Less-Common Met. 1988;141:11–27.
Kleppa OJ. Calorimetric investigation of the In-Sn system. J Phys Chem. 1956;60:842–50.
Wittig FE, Scheidt P. Direct reaction calorimetry of In-Sn alloys. Z Phys Chem. 1961;28:120–6.
Yazawa A, Kawashima T, Itagaki K. Thermodynamics of the In-Sn system. J Jpn Inst Met Sendai. 1968;32:1281–7.
Brunetti B, Gozzi D, Iervolino M, Piacente V, Zanicchi G, Parodi N, Borzone G. Bismuth activity in lead-free solder Bi-In-Sn-alloys. Calphad. 2006;30:431–42.
Hultgren R, Desai PD, Hawkins DT, Gleiser M, Kelley KK. Selected values of thermodynamic properties of binary alloys. Metals Park, OH: American Society of Metals; 1973.
Dinsdale AT, Watson A, Kroupa A, Zemanova A, Vrestal J, Vizdal J. COST531 thermodynamic database, Ver. 2.2; 2006.
Oelsen W, Zuhlke P. Zur thermodynamischen Analyse VIII. Arch Eisenhuttenwes. 1956;27:743–52.
Oelsen W, Johannsen F, Podgornik A. Kalorimetrie und Thermodynamik der Blei-Antimon-legierungen. Zeitsch Erzbergbau Metallhüttenwes. 1956;9:1–11.
Oelsen W, Schürmann E, Weigt HJ, Oelsen O. Zur thermodynamischen Analyse IV. Arch Eisenhuttenwes. 1956;27:487–511.
Pool MJ, Predel B, Schulheiss E. Application of the Setaram high temperature calorimeter for determination of mixing enthalpies of liquid alloys. Thermochim Acta. 1979;28:349–58.
Zivkovic D, Manasijevic D, Zivković Z. Thermodynamic and phase diagram investigation of Pb-BiIn section in Pb-Bi-In ternary system. Thermochim Acta. 2004;417:119–25.
Sorai M, editors. Comprehensive handbook of calorimetry and thermal analysis. Chichester: Wiley; 2004. p 297.
Zivkovic D, Katayama I, Gomidzelovic L, Manasijevic D, Novakovic R. Comparative thermodynamic study and phase equilibria of the Bi-Ga-Sn ternary system. Int J Mater Res. 2007;98:1025–30.
Gomidzelovic L, Zivkovic D. Thermodynamic analysis of AuIn-Sb system using Oelsen calorimetry and predicting methods. J Therm Anal Calorim. 2009;98:743–8.
Saunders N, Miodownik AP. CALPHAD calculation of phase diagrams—a comprehensive guide. Amsterdam: Elsevier; 1998.
Acknowledgements
The authors are grateful to support of the Ministry of Science and Technological Development of the Republic of Serbia under project No 142043. Presented investigations were done also in the frame of COST project MP0602.
Author information
Authors and Affiliations
Corresponding author
Rights and permissions
About this article
Cite this article
Živković, D., Mitovski, A., Balanović, L. et al. Thermodynamic analysis of liquid In–Sn alloys using Oelsen calorimetry. J Therm Anal Calorim 102, 827–830 (2010). https://doi.org/10.1007/s10973-010-0785-x
Received:
Accepted:
Published:
Issue Date:
DOI: https://doi.org/10.1007/s10973-010-0785-x