
Abstract
Dielectric properties on natural fibres reinforced unsaturated polyester were investigated. Dielectric spectra were measured in the frequency range from 10−1 Hz to 106 Hz and temperature interval from 40 °C to 150 °C. For the composite, three relaxation processes were identified. The first one is the α mode relaxation associated with the glass transition of the unsaturated polyester resin matrix. The second relaxation process associated with conductivity occurs as a result of the carriers charges diffusion noted for high temperature above glass transition and low frequencies. As for the third process, it is the interfacial or Maxwell–Wagner–Sillars (MWS) relaxation that is attributable to the accumulation of charges at the natural fibres/polyester resin interfaces. The third relaxation (MWS) was analysed using the Havriliak–Negami model and its intensity was calculated in order to probe the interfacial region between fibres and matrix. This analysis was accomplished by a thorough study of the fibres/matrix interfacial adhesion aspect, by using a differential scanning calorimeter (DSC) and a scanning electron microscope (SEM) observation.
Introduction
Over the last two decades, a number of researchers have been interested in the investigation of the cellulosic fibres exploitation as load-bearing constituents in composite materials [1]. The use of these natural fibres in composites has increased due to some reasons [2]. In fact, they are relatively cheap compared to conventional materials such as glass and aramid fibres. They are also capable of being recycled. Besides, these natural fibres compete well in terms of strength per weight of material [2]. Natural fibres like jute, coir, sisal, hemp and bamboo, etc., and their products have been widely used in engineering materials in various industries as textile, paper, chemical, construction [3–11] and automotive [12–15]. Actually, manufacturers and engineers are always looking for new materials and improved processes to use in fabricating better products so that they maintain their competitive edge and increase their profit margin [16]. In automotive industry, European car manufacturers are again applying natural fibre composites in interior parts [17]. The future trend of extreme light-weight car design [18] will further enhance the application potential of natural fibre composites, leading to the ultimate vision of cars that grow on trees [19].
The desert of North Africa is rich in Alfa plant. This xerophilous plant belongs to the family of grasses and grows to a maximal height of 120 cm in the form of cylindrical rods. Moreover, this vivacious plant has been used only in high-quality paper industry [20]. As natural resources play a dominant role in the economic activities of any country, they contribute substantially to the gross domestic product [21]. In the case of developing and underdeveloped countries, this also helps social as well as economic development. Therefore, it is not surprising to observe an increasing world trend towards the maximum utilization of such resources through new processes and products. These in turn help not only in preventing environmental pollution which would be caused by throwing these materials in the environment without proper use, but also in creating employment, particularly in the countryside, and contributing to the improvement of people’s standards of living [22, 23]. A great deal of recent research has been carried out to promote Alfa fibres in reinforced polymeric systems [24–29], which can be applied in automotive industry. Unsaturated polyester is commonly used as a polymer matrix in composites while the reinforcement of polyesters with cellulosic fibres has been widely reported [30–33]. This is thanks to the relatively low cost, ease of handling and good balance of mechanical, electrical and chemical properties [33]. Natural fibres reinforced polyester composites have been commercially successful in the infrastructure area primarily for low-cost housing applications. The engine and transmission covers of Mercedes-Benz transit buses now contain polyester resin reinforced with natural fibres [34].
However, these advantages could be reduced by the marked hydrophilic character of these macromolecules that does not only limit their compatibility with widely used hydrophobic polymeric matrix but also reduces the mechanical properties of the composite if moisture is absorbed as they age [28]. Interfacial adhesion and resistance to moisture absorption of natural fibre composites can be improved by the suitable modification of fibres surface [35, 36], or by using coupling agent [27] or by modifying matrix to make it more compatible with cellulose fibres [37]. Many techniques have been used to give evidence for the effect of these treatments on the fibres/matrix interfacial adhesion. The most used ones are dynamic mechanical analysis and scanning electron microscope (SEM) observation. However, the recourse to other methods, able to explore the interface, still attracts many interests and should help for better adapting the appropriate coupling agent according to the fibre’s surface and the matrix.
Dielectric spectroscopy is a technique that gives valuable information on the thermal and frequency behaviour of polymer composites. When an electrical field is applied across a parallel-plate capacitor containing a dielectric material, the various atomic and molecular charges present in the dielectric are displaced from their equilibrium positions and the material is said to be polarized. Different polarization mechanisms can occur, including dipole orientation, extrinsic free charges or intrinsic charge migration, electrode polarization and the Maxwell–Wagner–Sillars (MWS) interfacial polarization in the case of heterogeneous or composite system, [38, 39].
The objective of this study is to analyze the dielectric relaxation of non-woven Alfa and wool fibres composite using unsaturated polyester resin as matrix. It aims at the examination of the interfacial polarization in order to investigate the interfacial region between fibres and matrix. This analysis was achieved by a thorough study of the fibres/matrix interfacial adhesion aspect, by means of a differential scanning calorimeter (DSC) and a SEM observation.
Experimental
Materials
The matrix material used in this study was based on a commercially available unsaturated polyester, whose Trade Name is ‘NORSODYNE H13372TAE’ supplied by Cray Valley/Total. The matrix was mixed with initiator Methyl ethyl Ketone peroxide, MEKP, and Cobalt octanone at a concentration of 1.5% w/w before introducing Alfa fibres. These fibres extracted from the plant were attacked chemically by a solution of NaOH and bleached in a NaClO solution. Then fibres were separated mechanically using a shirley analyser. As the elaboration of non-woven fibres with only Alfa fibres were not possible due to the non-cohesion between fibres, these were mixed with wool fibres to assure the cohesion. The diameters of Alfa and wool fibres were 204.86 μm and 37.21 μm, respectively. For our composite, the relative volume fraction of the two fibres had a ratio of Alfa and wool 4:1. To prepare the sheet of non-woven fibres (Alfa + wool), four steps were conducted. First, Alfa fibres and wool fibres were, separately, cleaned and opened using an industrial bale opener (two passages). Afterwards, to improve blending, two other passages through the bale opener were necessary. Then, fibres were combed into a web by a carding machine, which was a rotating drum or series of drums covered in fine wires. Finally, the obtained web has little strength in their unbonded form. The web had therefore to be consolidated in some way. In our case, needle punching, which is a type of mechanical bonding, was used. In needle punching, the strengthening of the web is achieved by inter-fibre friction as a result of the physical entanglement of the fibres by needles. We used a laboratory needle punching machine (4 passages were needed). After this consolidation, the non woven fibres are calendared at 120 °C in an industry of developing non woven materials in order to decrease the thickness of the sheet. Finally, the composite was manufactured using the classical ‘contact mould method’ [40]. Fibres were deposited on the mould and impregnated with the liquid resin mixed with suitable proportions of Methyl ethyl Ketone peroxide and Cobalt octanone as hardener and catalyst, respectively. The saturated material was then pressed by a roller to remove bubbles. After the hardness of the resin, the composite was withdrawn from the mould. The composite obtained had 7.4% fibres volume fraction.
Measurements
Samples were subject to the following measurements.
Dielectric measurements
Dielectric measurements were carried out with an Alpha Dielectric/impedance Analyser (Novocontrol) allowing measurements over the temperature range from the ambient to 300 °C and a frequency interval from 10−2 to 107 Hz. In the dielectric analysis, the sample was placed between two gold parallel electrodes. A sinusoidal voltage was applied creating an alternating electric field. This produced polarization in the sample, which oscillated at the same frequency as the electric field, but had a phase angle shift δ. This phase angle shift was measured by comparing the applied voltage to the measured current, which was separated into capacitive and conductive components. Measurements of capacitance and conductance were used to calculate:
-
Real part of the permittivity (apparent permittivity) ε′ which is proportional to the capacitance and measures the alignment of dipoles.
-
Imaginary part of permittivity (loss factor) ε″ which is proportional to the conductance and represents the energy required to align dipoles and move ions.
-
Dissipation factor, tan δ = ε″/ε′
Two kinds of dielectric experiments were conducted in isochronal runs with fixed frequencies and varying temperatures from the ambient to 150 °C with a heating rate of 2 °C/min in a nitrogen atmosphere and isothermal runs with fixed temperatures and scanning frequencies from 10−1 to 106 Hz.
DSC
Differential thermal analysis was used to evaluate the thermal characteristics of the composite. Samples weighing between 10 and 15 mg were placed in a hermetic pan and sealed. A Jade DSC (Perkin Elmer) was operated with a heating scheme of −50–150 °C and heating rate of 5 °C/min in a nitrogen environment purged at 20 mW. The thermograms were analysed for any changes in the thermal behaviour of the composite.
SEM
The morphology of the matrix surfaces and their composite were observed at room temperature by SEM PHILIPS XL30 (SEM). A gold coating of a few nanometers in thickness was formed on the surfaces of the samples.
Results and discussions
Dielectric analysis
Resin polyester matrix
The dielectric characterization of the resin polyester matrix was conducted from the room temperature to 150 °C. Figure 1a, b shows the variation of the real permittivity, ε′, and dissipation factor, tan δ, versus temperature for the frequency range from 10−1 to 106 Hz, respectively. Two successive parts can be pointed out from the analysis of the real part of the permittivity and the dissipation factor, tan δ, depending on the temperature range.

a, b Isochronal runs of the dielectric permittivity ε′ and dissipation factor, tan δ, versus temperature for the polyester matrix. The inset shows a magnification region of the α-relaxation on tan (δ)
-
(i)
The first one emerging around 93.8 °C at 1.6 kHz is attributed to the α relaxation which is associated with the glass rubbery transition of the polymer. Segmental mobility of the polymer molecules increased with temperature, leading to the increase in permittivity. The relaxation peak shifted to high frequency when the temperature increases, due to faster molecule movements leading to the decrease in the relaxation times [41].
-
(ii)
The second part reveals the ionic conduction that appears for the temperature above transition temperature, T g, and low frequency ranges which arises from the increase in the mobility of electrical charges in the polymer with temperature thus giving rise to a conduction process that brings about a big increase in both real and imaginary parts of the dielectric function [42–44]. For polyester resin, −1 slope of ε″ in the low frequencies region (Fig. 2) is typical for dc conductivity effect [45, 46]. These results are confirmed by the corresponding ac conductivity plots for the polyester (Fig. 3) σac(f), which exhibits a dc conductivity plateau at low frequencies and high temperatures. It is clear that dc conductivity decreases and shifts to lower frequencies with temperatures reduction which is an expected behaviour owing to the reduction in the carrier mobility.
Fig. 2 
Isothermal runs of the loss factor ε″ versus frequency for the polyester matrix
Fig. 3 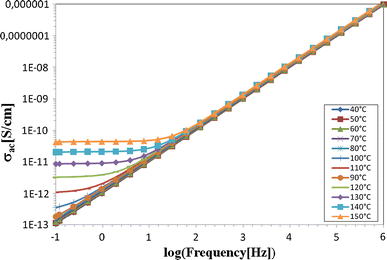
ac conductivity (σac) as a function of frequency for the pure polyester matrix at various temperatures


Composites
The real part of permittivity, ε′, and the dissipation factor, tan δ, versus frequency for the composite are shown in Fig. 4a, b for different temperatures varying from 40 °C to 150 °C in increments of 10 °C. For low frequencies, the permittivity reaches high values when temperatures increase. It is worthy to note that at low temperatures, ε′ is steadily constant and approximately equal to that of the polyester resin, which indicates the absence of water dipoles polarization. This result is confirmed by the dissipation tan δ curve that proves the absence of this polarization. As temperature increases, ε′ increases due to the enhanced conductivity of the composite at higher temperatures.

a, b Isothermal runs of the dielectric permittivity ε′ and dissipation factor versus frequency of the composite. The inset shows a magnification region of the MWS-relaxation on tan (δ) curve
The analysis of the dissipation effect in comparison to that of the unfilled matrix shows the presence of two dielectric relaxations. The first relaxation observed at roughly 90 °C for the 0.627 Hz frequency was attributed to the interfacial polarization, known as the MWS effect [47]. This relaxation arises from the fact that free charges (catalysts, impurities, etc.), which were present at the stage of processing, are now immobilized in materials. When the temperature is sufficiently high to ensure a certain conductivity of the medium, the charges can migrate in the applied electric field. These free carriers are then blocked at the interface between the cellulose fibres and polyester matrix having different conductivity and permittivity. This relaxation shifts to higher frequencies as temperature increases. Indeed, when temperature increases the mobility of molecular dipoles increases and thus relaxation frequency shifts to higher values. Besides, the ionic conduction is amplified with temperature that gives rise to the second relaxation related to dc conductivity occurring in the low frequency and high temperature. It should be noted that MWS relaxation is often mixed up with ionic conduction as these two phenomena originate from charged carrier mobility.
The α relaxation, which is already poorly seen in the polyester resin, is completely masked by the MWS relaxation in the case of the composite. In fact, the maxima of tan δ for α relaxation of the matrix is 0.0321 for a temperature of 89.4 °C and for a frequency of 3.2 × 10² Hz. Nevertheless, in the case of the composite, the isothermal runs of the dissipation factor tan δ in the same temperature range shows an enhancement of the intensity and appearance of a relaxation peak associated with the MWS relaxation. Indeed, this relaxation appears at temperatures above the glass transition temperature resulting from the accumulation of charges at the fibres/polyester interfaces. The increase in the temperature leads to a gradual increase in the mobility of charges, and therefore, a second relaxation peak associated with dc conductivity appears. The same result is observed in the work of Okrassa et al. [48] in which the α relaxation of the hyroxypropyl cellulose (HPC) related to its glass transition is not visible in the dielectric spectra. This behaviour has been connected with the presence of strong hydrogen between celluloses chains.
To minimize the effect of the dc conductivity, the formalism of the ‘electric modulus’ or ‘inverse complex permittivity’ is introduced. This electric modulus has recently been adapted for the investigation of dielectric processes occurring in composite polymeric systems and also proposed for the description of systems with ionic conductivity [27]. The electric modulus, M*, is defined by the following Eq. 1 [49]:
where M′ and M″ are the real and imaginary parts of electric modulus, respectively. An advantage of using the electric modulus to interpret bulk relaxation properties is that the variation in the large values of real part of permittivity and the loss factor at low frequencies are minimised. In this way common difficulties of electrode nature and contact, space charge injection phenomena and absorbed impurity conduction effects, which appear to obscure relaxation in the permittivity representation, can be solved or even ignored [50].
On transforming the dielectric permittivity and loss values into the electric modulus formalism, Fig. 5a, b are obtained, giving the real part, M′, and imaginary part, M″, of the electric modulus versus frequency for the polyester matrix. It can be clearly seen that the values of M′ increase with frequency at a constant temperature and reach a rather constant value in the end of the spectrum. Yet, as expected, the values of ε′ decrease quickly to an almost constant value. The evolution towards a constant of M′ at high frequency is due to the fact that polarization is ineffective at high frequency since the dipoles cannot follow the applied electric fields when the frequency is very high. The variation of the imaginary part of the electric modulus according to the temperature of the polyester is given in Fig. 5b. These curves show the presence of two relaxation peaks related to ionic conduction at low frequencies and α relaxation associated with the glass transition for the high frequencies when the temperature increases. Adopting this electric modulus formalism, Fig. 6 shows a different behaviour of M″ as the composite is heated over the temperature range from 40 °C up to 150 °C in comparison with that of the polyester resin matrix. A series of two distinct relaxations can be considered. The first of them is related to the α relaxation associated with the glass rubbery transition of the polymer and the second one, which appeared at high temperatures, is attributed to the filler and more precisely to the fibre/matrix region giving rise to MWS interfacial relaxation. To further support these assignments the activation energy relative to the different relaxation, was evaluated. The frequency, f max, associated with the maximum of M″ for a fixed temperature was determined. These frequencies associated with each relaxation, i.e. conduction and α relaxations for the polyester matrix (UP) and α and MWS relaxations for the composite, were plotted in Fig. 7 as function of the temperature. The temperature dependence of the frequency f max can be described by an Arrhenius law; thus the activation energy is calculated from the Eq. 2 below:
where k B, T, E a and f o are Boltzmann constant, temperature, activation energy of the process and frequency at high temperature. The mean value of activated energy relative to α relaxation is 151.79 kJ/mol for the matrix (Table 1). This value is in accordance with that reported in other work [27]. But, for the composite, the α relaxation is characterized by an energy activation of about 112.36 kJ/mol and a time relaxation of 10−17.68 s. One can notice that apparent activation energy, E αa , associated with α relaxation decreases after fibres incorporation. The decrease in E αa could be attributed to the interaction between non woven natural fibres and the matrix and therefore to the nature of interfacial regions. To probe this region, SEM observation will be carried out later. The MWS relaxation, for the composite, is characterized by an energy activation of about 87.87 kJ/mol and a time relaxation of 10−14.47 s. These values seem to be a typical thermoactivated phenomenon that is not related to an elementary relaxation of dipoles as the characteristic time, τo, is slightly different from that of Debye (10−13 s). The use of the Argand representation (Cole–Cole diagram) provides interesting regarding the nature of relaxation. Cole–Cole plots of the matrix and the composite at 150 °C are depicted in Fig. 8a, b. It is well established that the response of every relaxation mechanism can be represented very precisely by a model function with four parameters at the most. Among others [28, 51] the function:
introduced by Havriliak–Negami [52] which is widely used because of its suitability for mathematical processing.

a, b The real part M′ and imaginary part M″ of the electric modulus versus frequency of the polyester matrix. The inset was illustrated by the α mode relaxation

The imaginary part M″ of the electric modulus versus frequency of the composite

Arrhenius plots of the frequency of M″ versus the reciprocal temperature for the polyester matrix (UP), and the composite

Argand’s plots of the electric modulus, M* of the matrix (a) and the composite (b) at 150 °C
εs and ε∞ are the dielectric constants on low and high frequency sides of the relaxation, τ is the central relaxation time, ω is the radial frequency, α and β are fractional shape parameters describing the skewing and broadening, of the dielectric function, respectively. Both α and β range between 0 and 1. These coefficients act for the deviation from the Debye equation. In fact, when α and β = 1, this equation reduces to the Debye equation. In the electric modulus formalism, the Havriliak–Negami equations (4, 5) have the following form [52]:
where
Accordingly, the dotted curves are produced by best fitting experimental points using the Havriliak–Negami equations (4, 5). In Fig. 8a, the Cole–Cole diagram of the polyester resin corresponds to the ionic conduction process. Nonetheless, for the composite (Fig. 8b), we note that it was impossible to fit to the Havriliak–Negami model with all the experimental points. Similarly, it can be noted that at low frequencies domain (lower values of M′ and M″), the experimental points reach the origin of the graph contrary to the theoretical ones, which is a typical behaviour of dc conduction effect. So, two semicircles are obtained in every examined temperature. The first one for 0 < M′ < 0.013 is related to the conduction effect and the second one for 0.013 < M′ < 0.3 is attributed to the MWS effect. The parameters evaluated by fitting data were listed in Table 2. To determine the parameters characteristic of the Havriliak and Negami model (α, β, M s, M ∞), the experimental M′ and M″ data are smoothed through a numerical simulation in the complex plane. The purpose of such simulation is to find the theoretical values \((M_{\text{th}}^{\prime }, M_{\text{th}}^{\prime \prime })\). The values of α, β, M s and M ∞, which smoothed best the Havriliak–Negami data are obtained by a successive approach method where the following expressions (10, 11) are minimized:
It has been proven that only one-quadruplet value is able to tone with these conditions. The values of α and β obtained for conductive effect are in harmony with a pure Debye-type both for the matrix and the composite. While, the values of α and β obtained for MWS relaxation go in the same line with the Havriliak–Negami response. For the α relaxation, the deviation of the parameter α value from 1 is an indication that these phenomena could not be associated with a single relaxation time process or a pure Debye-type relaxation [49].
Table 3 presents the interfacial relaxation strength of MWS relaxation in permittivity values defined by (\( \Updelta \varepsilon = \varepsilon_{\text{s}} - \varepsilon_{\infty } \)) [53].
From Table 3, we note that the relaxation strength of MWS relaxation increases with temperature. This can be due to the increase in free charges, which come to be blocked in greater numbers at the interfaces, thus increasing the aptitude of the dipoles to be polarized. It should be born in mind that for a given sample, a rise in the temperature leads to an increase in the relaxation and shift of the maximum towards the high frequencies suggesting that the aptitude of the ions to be polarized at the interface is more significant at high temperatures. This phenomenon is due to the greatest number of free charges, which migrate towards the interfaces and block themselves there.
Thermal analysis of the composite
Thermal analysis can be performed to determine the moisture content present in composites. Since moisture content has a deteriorating effect on the properties of composites, this analysis is of great importance [54]. DSC analysis was performed on the composite to determine the thermal behaviour of the composite in temperature range from −50 to 150 °C. Figure 9 shows the DSC curves of the composite in the first and second runs. A little endotherm shoulder observed in the temperature range 57–63 °C from the first run indicates the presence of a little absorbed water in the composite. Water present in the composite originates largely from the fibres. Water is not observed on dielectric spectra as mentioned before and this is probably due to the lowness of this water. The second run shows a flat base line indicating complete water removal. An analogous study was done by Aziz et al. on hemp–polyester and kenaf–polyester composites in which they showed a wide endotherm on thermographs associated with the presence of water molecules linked to fibres. In their work, they also indicated that high moisture content leads to poor wetting ability with the resin and weak interfacial bonding between the fibres and the polyester matrix. In our case, the lowness of water lets us think for a better adhesion of fibres in the matrix. This prediction will be verified by means of the SEM observation in the section that follows.

DSC thermograms of the composite in the first and second runs
Morphology of the composite
The fibre–matrix interface in the composite was investigated by SEM. SEM micrographs of the matrix and its composite are displayed in Figs. 10, 11, 12 and 13. The micrograph in Fig. 10 illustrates the unfilled material, i.e. polyester matrix. By comparing this micrograph with those of the composite, fibres can be clearly identified. Figure 11a, b represents the micrographs of the longitudinal fibres aspects for the composite. These micrographs illustrate that Alfa fibres are randomly dispersed in the matrix and that individual separation of the fibres are not in the form of single fibres. Some fibres are tightly connected with the matrix as illustrated in Fig. 11b. Figures 12 and 13 depict the micrographs of the polished cross-sections for the composite. As natural fibres in the composite are dispersed randomly, different shaped cross-sections are observed in Figs. 12a and 13a. In Figs. 12b, c and 13b, c, closer observation of the interface in micrographs shows tiny holes around the fillers and also indicates some physical contacts in this surrounding region. The lack of interactions at the interface between filler and matrix is equally pointed out by Kaddami et al. in palm tree fibres composite based on polyester matrix [55]. They showed that the chemical modification of the filler with acetate did not succeed in improving the adhesion between the polymer and the palm tree filler.

SEM micrograph of the polyester matrix

SEM micrographs of the longitudinal fibres aspects for the composite: a 100 μm and b 10 μm

SEM micrographs of the polished cross-sections for the composite: a 100 μm and b, c 10 μm

SEM micrographs of the polished cross-sections for the composite: a 100 μm and b, c 20 μm
Conclusion
In the present work, we have investigated dielectric measurements performed on polyester resin matrix and its composite using non-woven Alfa fibres mixed with wool fibres, over the temperature range from room temperature to 150 °C and over the frequency range from 0.1 to 106 Hz. In addition to the α relaxation associated with the glass transition of the polyester resin matrix and ionic conduction relaxation caused by the mobility of electric charges, the presence of natural fibres in the composite gives rise to a dielectric relaxation associated with MWS interfacial polarization. The MWS relaxation arises from the trapping of electric charges at the interfaces between fibres and polyester resin for the composite. The recourse to the Argand representation confirms that the MWS relaxation is consistent with the Havriliak–Negami process for the studied composite. Calculating the intensity of this relaxation and analysing the thermal behaviour and the morphology of the composite reveal low interactions between the filler and the matrix.
References
Eichhorn SJ, Baillie CA, Zafeiropoulos N, Mwaikambo LY, Ansell MP, Dufresne A, Entwistle KM, Herrera-Franco PJ, Escamilla GC, Groom L, Hughes M, Hill C, Rials TG, Wild PM (2001) J Mater Sci 36:2107. doi:10.1023/A:1017512029696
Robson D, Hague J, Newman G, Jeronomidis G, Ansell M (1996) Survey of natural materials for use in structural composites as reinforcement and matrices. Woodland Publishing Ltd, Abingdon
Thwe MM, Liao K (2003) J Mater Sci 38:363. doi:10.1023/A:1021130019435
Bledzki AK, Gassan J (1999) Prog Polym Sci 24:221
Mwaikambo LY, Ansell MP (2002) J Appl Polym Sci 84:2222
Gassan J (2002) Composites A 33:369
Ruys D, Crosky A, Evans WJ (2002) Int J Mater Prod Technol 17:2
Mishra S, Tripathy SS, Misra M, Mohanty AK, Nayak SK (2002) J Reinf Plast Compos 21:55
Gassan J, Chate A, Bledzki AK (2001) J Mater Sci 36:3715. doi:10.1023/A:1017969615925
Mohanty AK, Drzal LT, Misra M (2002) J Adhesion Sci Technol 16:999
Mohanty AK, Misra M, Drzal LT (2001) Compos Interfaces 8:313
Ermolaeva NS, Kaveline KG, Spoormaker JL (2002) Mater Des 23:459
Li Y, Lin Z, Jiang A (2004) Mater Des 25:579
Adam H (1997) Mater Des 18:349
Shibata S, Cao Y, Fukumoto I (2006) Polym Test 25:142
Farag MM (2008) Mater Des 29:374
Zah R, Hischier R, Leao AL, Braun I (2007) J Clean Prod 15:1032
Lovins AB, Cramer DR (2004) Int J Veh Des 35:50
Hill S (1997) New Sci 153:36
Bessadok A, Marais S, Gouanve F, Colasse L, Zimmerlin I, Roudesli S, Metayer M (2007) Compos Sci Technol 67:685
Satyanarayana KG, Guimaraes JL, Wypych F (2007) Composites A 38:1694
Niox C (1954) Géographie militaire Tome VI: Algérie et Tunisie.Librairie de L. Baudoin et Cie, Paris
Ben Brik T (1992) Tunisie: Menaces sur l’Alfa et son papier d’or, SYFIA international
Ben Abderrahmane M, Ben Cheikh R (2008) Surf Eng Appl Electrochem 44:484
Bessadok A, Roudesli S, Marais S, Follain N, Lebrun L (2009) Composites A 40:184
Maafi EM, Malek F, Tighzert L, Dony P (2010) J Polym Environ 18:638
Ghallabi Z, Rekik H, Boufi S, Arous M, Kallel A (2010) J Non-Cryst Solids 356:684
Arous M, Ben Amor I, Boufi S, Kallel A (2007) J Appl Polym Sci 106:3631
Ben Brahim S, Ben Cheikh R (2007) Compos Sci Technol 67:140
De Alburquerque A, Joseph K, Hecker de Carvalho L, Morais D, Almeida J (1999) Compos Sci Technol 60:833
Devi L, Bhagawan S, Thomas S (1997) J Appl Polym Sci 64:1739
Mwaikambo L, Bisanda E (1999) Polym Test 18:181
Alsina OLS, de Carvalho LH, Ramos Filho FG, d’Almeida JRM (2005) Polym Test 24:81
Mishra S, Mohanty AK, Drzal LT, Misra M, Parija S, Nayak SK, Tripathy SS (2003) Compos Sci Technol 63:1377
Laly AP, Sabu T (2003) Compos Sci Technol 63:1231
Bisanda ETN, Anshell MP (1991) Compos Sci Technol 41:165
Aziz SH, Ansell MP, Clarke SJ, Panteny SR (2005) Compos Sci Technol 65:525
Li Y, Cordovez M, Karbhari VM (2003) Composites B 34:383
Pethrick RA, Hayward D (2002) Prog Polym Sci 27:1983
Kaynak C, Akgul T (2001) Handbook of composite fabrication. Polestar Scientifica Exeter, UK
Tsangaris GM, Psarras GC, Kontopoulos AJ (1991) J Non-Cryst Solids 131–133:1164
Kyritsis A, Pissis P, Gramtikakis J (1995) J Polym Sci B 33:1737
Jonscher AK (1999) J Phys D 32:R57
Schaumburg G (1997) On the accuracy of dielectric measurements. Novocontrol, Dielectric Newslett, November 8
Arous M, Ben Amor I, Kallel A, Fakhfakh Z, Perrier G (2007) Phys Chem Solids 68:1405
Kanapitsas A, Pissis P, Kislkova R (2002) J Non-Cryst Solids 305:204
Hammami H, Arous M, Lagache M, Kallel A (2006) Composites Appl Sci Manuf 37:1
Okrassa L, Boiteux G, Ulanski J, Seytre G (2001) Polymer 42:3817
Howard W, Starkweather JR, Avakian P (1992) J Polym Sci Part B 30:637
Tsangaris GM, Psarras GC, Kouloubi N (1998) J Mater Sci 33:2027. doi:10.1023/A:1004398514901
Hill RM (1981) Phys Stat Sol(b) 103:319
Havriliak S, Negami S (1966) J Polym Sci C 14:99
Puertolas JA, Castro M, Telleria I, Algeria A (1999) J Polym Sci B 37:1337
Aziz SH, Ansell MP (2004) Compos Sci Technol 64:1219
Kaddami H, Dufresne A, Khelifi B, Bendahou A, Taourirte M, Raihane M, Issartel N, Sautereau H, Gérard JF, Sami N (2006) Composites A 37:1413
Author information
Authors and Affiliations
Corresponding author
Rights and permissions
About this article
Cite this article
Triki, A., Guicha, M., Ben Hassen, M. et al. Studies of dielectric relaxation in natural fibres reinforced unsaturated polyester. J Mater Sci 46, 3698–3707 (2011). https://doi.org/10.1007/s10853-010-5136-6
Received:
Accepted:
Published:
Issue Date:
DOI: https://doi.org/10.1007/s10853-010-5136-6