
Abstract
Peripheral blood mononuclear cells (PBMCs) are essential to the study of autoimmune, infectious, parasitic diseases, and cancer. In the rapidly growing field of cancer immunology, cellular phenotyping provides critical information about patient responses to treatments and treatment efficacies. Notably, the evaluation of T cell based therapies relies on the isolation of highly viable CD3+ T cell, CD4+ Helper T cell, and CD8+ Cytotoxic T cell populations before and during patient treatments. Cryopreservation of PBMC populations allows researchers to thaw and characterize clinical samples by flow cytometry, mass cytometry, sequencing, etc. in a high-throughput manner and in batches. Therefore, it is important to separate and bank an abundance of robust circulating immune cells. Here, we report our internal protocols for the high-quality separation, banking, and thawing of clinically relevant PBMC populations. We present quality control data from 11 melanoma patients and characterize their CD3+, CD4+, and CD8+ T cells by 4-color flow cytometry.
Background
Circulating immune cells are critical to understanding the pathologies of autoimmune, infectious, and parasitic diseases (De la Cruz-Mosso et al. 2018; Speiser et al. 2005; Cosma et al. 2017; Kutscher et al. 2008; Rao et al. 2018; Singh et al. 2017). In the field of cancer immunology, cellular phenotyping reveals valuable information about patient responses to immunotherapies and the ability of novel treatments to target tumors (Kalos 2011; Malyguine et al. 2012). The separation and banking of peripheral blood mononuclear cells (PBMCs) enables laboratories to cryopreserve patient samples from multiple study visits. Researchers may then thaw and characterize PBMCs by flow cytometry, mass cytometry, sequencing, etc. in a high-throughput manner and in batches. High-throughput and batch analyses are efficient, cost-effective ways to limit variability across laboratory sites and assay runs. In the context of clinical research, it is therefore extremely important to isolate and store an abundance of high-quality immune cells before and during patient therapies (Weinberg et al. 2009; Ben-Ami et al. 2017; Sridharan et al. 2016a, b).
Various methodologies describe the cryopreservation of circulating immune cells for cellular phenotyping. However, these protocols differ in level of detail, quality of PBMCs obtained, banking instructions, and quality of immune phenotyping (Paredes et al. 2018; Schleker et al. 2018). Specifically, the study of T-cell based therapies requires the separation of robust CD3+ T cell, CD4+ Helper T cell, and CD8+ Cytotoxic T-cell populations. These parent populations must be present in order to examine T-cell subsets, activation and checkpoint markers of clinical interest (Weinberg et al. 2009). Our separation protocol has been used to bank thousands of clinical samples with applications far beyond the realm of cancer immunotherapy. Here, we report our well-proven methods of separating, banking, and thawing highly-viable PBMC populations for immune monitoring purposes, as applied in healthy donor samples by Patel et al. (2018) and in clinical publications by Ben-Ami et al. (2017) and Subrahmanyam et al. (2018). Using these protocols, we present quality control data from 11 melanoma patients and characterize their CD3+, CD4+, and CD8+ T cells by 4-color flow cytometry. Additionally, cells processed at Dana-Farber Cancer Institute using the methods described below were also validated for quality via mass cytometry by Subrahmanyam et al. (2018).
Materials and methods
Collection and isolation of PBMCs from melanoma patients
Whole blood samples were drawn from melanoma patients receiving clinical immunotherapies at Dana-Farber Cancer Institute. All individuals gave written informed consent to participate in research prior to blood collection in accordance with an Institutional Review Board (IRB)-approved protocol. On average, 30–35 mL of blood were drawn per patient at pre- and post-study visits using BD Vacutainer Plastic Blood Collection Tubes with Sodium Heparin or BD Vacutainer EDTA Tubes (BD Biosciences, Billerica, MA, USA). Blood was kept at room temperature until peripheral blood mononuclear cells (PBMCs) were isolated no later than 3 h (h) from draw time using the following protocol for density gradient separation. All materials and instruments for high-quality PBMC separation are cataloged below in order of use (Table 1).
High-quality PBMC isolation from whole blood by density gradient separation
-
1.
Using sterile technique in a Biological Safety Cabinet (BSC), blood samples were poured in equal volume into two 50 mL conical tubes (Fig. 1a)
Fig. 1 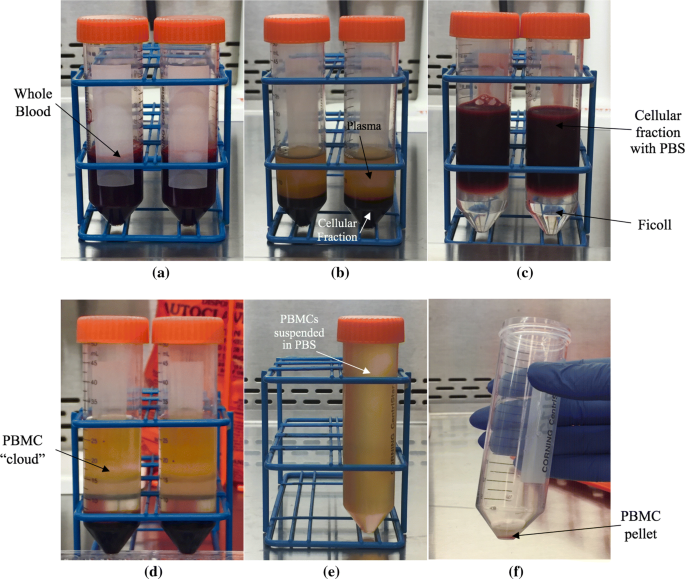
Isolation of peripheral blood mononuclear cells (PBMCs) by density gradient separation. Images depict whole blood after a pouring sample in equal volume into two 50 mL conical tubes, b centrifugation at 272 RCFs for 10 min at room temperature (RT), c aspiration of plasma, dilution 1:1 with phosphate-buffered saline (PBS), and gentle overlaying onto 12 mL of Ficoll-Paque Plus, d centrifugation at 436 RCFs with gentle brake for 20 min at RT, e aspiration of cloud-like PBMC layer into fresh 50 mL conical and filling to top with PBS, and f pouring off supernatant into liquid waste container to yield PBMC pellet
-
2.
Tubes were capped and centrifuged at 272 RCFs for 10 min at room temperature (RT) (Fig. 1b)
-
3.
Plasma was carefully aspirated using a micropipette, and 8 mL of plasma aliquoted into four 2 mL pre-labeled cryogenic vials to be stored at − 80 °C for use in soluble cytokine assays. Care was taken not to aspirate the cellular fraction when pulling plasma (see white arrow, Fig. 1b)
-
4.
Blood was diluted 1:1 with PBS
-
5.
Blood was carefully pipetted down the sides of two 50 mL conical tubes containing 12 mL of Ficoll-Paque Plus. Ficoll-Paque layer was not disturbed; the cellular fraction must sit cleanly on top for proper separation (Fig. 1c)
-
6.
Tubes were centrifuged at 436 RCFs with gentle brake (using the ThermoFisher Scientific Sorvall Legend XTR Centrifuge, setting the acceleration and deceleration to 7 creates a gentle brake) for 20 min at RT (Fig. 1d)
-
7.
The cloud-like PBMC layer (see arrow, Fig. 1d) was aspirated into a fresh 50 mL conical tube. The 50 mL tube containing the PBMC layer was then filled with PBS (Fig. 1e)
-
8.
To count viable cells, the 50 mL conical tube was inverted to mix cell suspension and PBS. 20 μL of cell suspension was pipetted into a 2 mL Eppendorf Flex tube and 20 μL of Cellometer AOPI Staining Solution added and pipetted up and down to gently mix. 20 μL of combined cell suspension and staining solution mixture was loaded onto a Cellometer Cell Counting Chamber. The chamber was inserted into the Cellometer Auto 2000 Cell Viability Counter to obtain cell count and % viability using the setting Immune Cells, low RBC (Fig. 2)
Fig. 2 
Peripheral blood mononuclear cells (PBMCs) after isolation with some red blood cells as shown by the Cellometer Auto 2000 Cell Viability Counter optimally focused. The immune cells, low RBC setting displays a the bright field image depicting all cells and b the green fluorescent image depicting nucleated cells
-
9.
Cell count and viability were recorded for quality control
-
10.
50 mL conical tube containing cell suspension and PBS was then capped and centrifuged at 272 RCFs for 5 min at RT
-
11.
Cell supernatant was poured into a liquid waste container, leaving PBMC pellet in ~ 200 μL residual volume (Fig. 1f)
-
12.
Cell pellet was resuspended in 1.8 mL FBS with 15% DMSO for a final concentration of ~ 13.5% DMSO
-
13.
PBMCs were immediately resuspened and aliquoted into 2 mL pre-labeled cryogenic vials at a concentration of 5 million cells per 0.5 mL freezing media
-
14.
PBMC vials were immediately placedin CoolCell® LX cell freezing containers to establish a controlled cooling rate of − 1 °C/min
-
15.
Vials were stored in freezing containers at − 80 °C overnight
-
16.
After 24 h, samples were transferred to liquid nitrogen for long-term storage


Banking, tracking, and immune phenotyping of PBMCs
Since 2015, the Immune Assessment Lab (IAL) has banked over 1000 melanoma patient PBMC samples. All samples were logged in a principal spreadsheet organized by processing date to include internal subject IDs, treatment protocols, and study visits. The cell counts and viability readings were recorded for each sample at the time of PBMC isolation (mean viability of melanoma samples immediately after separation was 96.99% ∓ 6.08%, n = 1024).
Prior to isolation, all PBMC and plasma aliquots were added to a virtual map on the FreezerPro Cloud software system (Brooks Life Science Systems, Chelmsford, MA, USA). PBMC samples appeared on FreezerPro in a 9 × 9 box format that corresponded to the physical 9 × 9 boxes stored in lab liquid nitrogen tanks. Boxes were specific to the treatment protocol and organized by processing date. The ability to track and thaw samples efficiently allows for immuno-phenotyping of clinical collections in a high-throughput manner and in batches.
Select PBMCs have been thawed for phenotyping by multicolor flow cytometry following the protocol detailed below. Cells were acquired on a Fortessa HTS (BD Biosciences). Electronic FCS files were assessed using FlowJo software (Treestar, Ashland, OR, USA) and gated using Fluorescence Minus One (FMO) controls as previously described by Patel et al. (2018).
PBMC thawing for immune phenotyping by multicolor flow cytometry
-
1.
Frozen PBMCs were transferred from liquid nitrogen onto dry ice
-
2.
PBMC vials were submerged one at a time in a 37 °C water bath until cells were uniformly thawed
-
3.
The entire volume of the vial was then pipetted into a 15 mL conical tube filled with 12 mL warm DMEM
-
4.
Samples were centrifuged at 272 RCFs for 5 min at 4 °C
-
5.
Viable cells were counted (see Step 8 of High-quality PBMC isolation from whole blood by density gradient separation)
-
6.
Viable cells were resuspended in PBS to a concentration of 1 × 10⁷ cells/mL and aliquotted into a 96 well v-bottom plate at a concentration of 1 × 10⁶ cells/100 μL/well
-
7.
Cells were washed once more with 200 μL PBS and the plate placed on ice
-
8.
The staining protocol for multicolor flow cytometry was followed as previously described by Patel et al. (2018)
Results and discussion
Of all melanoma samples banked in the IAL since 2015, we report viability data from 11 stage III or IV patient collections after thawing and phenotyping by 4-color flow cytometry. PBMC viability prior to freezing was 96.10% ∓ 2.42% (n = 11). Lymphocyte populations evaluated for quality control included CD3+ T cells, CD4+ Helper T cells, and CD8+ Cytotoxic T cells (Table 2, Fig. 3). The mean total lymphocyte viability after thawing, staining, and gating down on single cells was 99.74% ∓ 0.09% (n = 11). All T-cell populations of interest had mean viabilities of 99.7% after thawing (Fig. 4). Quality of CD3+, CD4+, and CD8+ T cell populations from clinical melanoma samples is corroborated by mass cytometry data (Subrahmanyam et al. 2018).

Gating strategy to determine % viability of CD3+ T cells, CD4+ Helper T cells, and CD8+ Cytotoxic T cells stained with Zombie NIR viability dye after thawing (Biolegend). Black dots represent outliers. Cells were isolated from whole blood of 11 stage III or IV melanoma patients and acquired on a Fortessa HTS (BD Biosciences). Electronic FCS files were assessed using FlowJo software (Treestar, Ashland, OR, USA)

Percent viability of 11 peripheral blood mononuclear (PBMC) samples isolated from whole blood of stage III or IV melanoma patients after thawing. Dot plot reflects mean with standard deviation. Percent viability of lymphocyte populations was determined by extracellular fluorescent immunolabeling for CD3+ T cells, CD4+ Helper T cells, and CD8+ Cytotoxic T cells stained with Zombie NIR viability dye. Image generated using Prism 7 from GraphPad Software (La Jolla, CA, USA)
Unlike past protocols for the separation of PBMCs (Paredes et al. 2018; Schleker et al. 2018), we provide additional information related to sample banking on the FreezerPro Cloud software system. Logging and tracking samples using FreezerPro ensures all samples may be located and removed from liquid nitrogen storage in an efficient manner, enabling high-throughput or batch analyses of clinical collections from multiple study dates. High-throughput and batch characterizations reduce variability between laboratory sites and assay runs, cutting costs and standardizing data output (Weinberg et al. 2009).
As previously described, the study of CD3+, CD4+ Helper, and CD8+ Cytotoxic T cells is central to understanding patient responses to clinical immunotherapies and more generally, immune responses to pathological conditions. Many T-cell based therapies rely on the cytotoxic response to attack tumors. CD8+ T cells activate immunogen-specific responses to virally-infected and tumor cells by releasing cytokines and initiating cell-mediated killing (Harty et al. 2000; Salti et al. 2011; Pender et al. 2014). In circulation, approximately 5–25% of total PBMCs are CD8+ T cells and only a fraction of these express clinically relevant markers (Patel et al. 2018). Therefore, an abundance of high-quality PBMCs must be present to evaluate specific T cell subsets, activation and checkpoint markers. Our PBMC separation protocol yields large cell counts of total lymphocyte, CD3+, CD4+, and CD8+ populations from ~ 30 mL of whole blood (Fig. 5). Critically, the data reported above from the Cellometer Auto 2000 Cell Viability Counter and multicolor flow cytometry corroborates the quality of CD3+, CD4+, and CD8+ T cells before freezing and after thawing.

Mean cell counts of 11 peripheral blood mononuclear (PBMC) samples isolated from whole blood of stage III or IV melanoma patients after thawing. Error bars reflect standard deviation. Cell counts were determined by extracellular immunolabeling for CD3+ T cells, CD4+ Helper T cells, and CD8+ Cytotoxic T cells stained with Zombie NIR viability dye. Image generated using Prism 7 from GraphPad Software (La Jolla, CA, USA)
Summary
Our detailed protocols for the separation, banking, and thawing of PBMCs yield highly-viable lymphocyte populations including CD3+, CD4+, and CD8+ T cells. Cell quality has been validated by the Cellometer Auto 2000 Cell Viability Counter prior to freezing and by multicolor flow cytometry after thawing. Further study has validated cell quality by mass cytometry (Subrahmanyam et al. 2018). The breadth of technologies used here confirms that PBMCs generated from clinical samples following the described protocol present high quality in numbers and viability. This allows the application of flow cytometry or mass cytometry for immune phenotyping studies to generate consistent data. Our streamlined system of banking and tracking allows for the analysis of clinical samples in a high-throughput manner and in batches, reducing variability across laboratory sites and assay runs. In addition to our own studies, these methods are routinely applied to external research efforts, two of which have translated into clinical publications on leiomyosarcoma and melanoma (Ben-Ami et al. 2017; Subrahmanyam et al. 2018). The study of circulating immune cells in relation to cancer, autoimmune, infectious, and parasitic diseases relies on well-described, reproducible methods of cellular banking and phenotyping. Our protocols have applications in any lab examining circulating immune cells from whole blood. Moving forward, these methods may provide valuable information about patient responses to pathologies and elucidate therapeutic mechanisms that harness the power of the human immune system (Cosma et al. 2017; Kutscher et al. 2008; Speiser et al. 2005).
References
Ben-Ami E et al (2017) Immunotherapy with single agent nivolumab for advanced leiomyosarcoma of the uterus: results of a phase 2 study. Cancer 123(17):3285–3290
Cosma G et al (2017) Identifying the presence of prostate cancer in individuals with PSA levels < 20 ng ml−1 using computational data extraction analysis of high dimensional peripheral blood flow cytometric phenotyping data. Front Immunol 8:1771
De la Cruz-Mosso U et al (2018) MIF promotes a differential Th1/Th2/Th17 inflammatory response in human primary cell cultures: predominance of Th17 cytokine profile in PBMC from healthy subjects and increase of IL-6 and TNF-α in PBMC from active SLE patients. Cell Immunol 324:42–49
Harty JT et al (2000) CD8+ T cell effector mechanisms in resistance to infection. Annu Rev Immunol 18:275–308
Kalos M (2011) Biomarkers in T cell therapy clinical trials. J Transl Med 9:138–147
Kutscher S, Dembek CJ, Allgayer S, Heltai S, Stadlbauer B, Biswas P, Nozza S, Tambussi G, Bogner JR, Stellbrink HJ, Goebel FD, Lusso P, Tinelli M, Poli G, Erfle V, Pohla H, Malnati M, Cosma A (2008) The intracellular detection of MIP-1Beta enhances the capacity to detect IFN-gamma mediated HIV-1-specific CD8 T-cell responses in a flow cytometric setting providing a sensitive alternative to the ELISPOT. AIDS Res Ther 6:5–22
Malyguine AM et al (2012) ELISPOT assay for monitoring cytotoxic T lymphocytes (CTL) activity in cancer vaccine clinical trials. Cells 1(2):111–126
Paredes RM et al (2018) Cryopreservation of human whole blood allows immunophenotyping by flow cytometry up to 30 days after cell isolation. J Immunol Methods 452:32–38
Patel T et al (2018) Development of an 8-color antibody panel for functional phenotyping of human CD8+ cytotoxic T cells from peripheral mononuclear cells. Cytotechnology 70:1–11
Pender MP et al (2014) Deficiency of CD8+ effector memory T cells is an early and persistent feature of multiple sclerosis. Mult Scler 20(14):1825–1832
Rao D et al (2018) Alterations in natural killer and dendritic cell subsets in individuals with HIV-associated neurotuberculosis. J Med Virol. https://doi.org/10.1002/jmv.25042
Salti SM et al (2011) Granzyme B regualtes antiviral CD8+ T cell responses. J Immunol 187(12):6301–6309
Schleker T et al (2018) Preserved in vitro immunoreactivity in children receiving long-term immunosuppressive therapy due to inflammatory bowel disease or autoimmune hepatitis. Mol Cell Pediatr 5(1):1
Singh N et al (2017) Inflammatory chemokines and their receptors in human visceral leishmaniasis: gene expression profile in peripheral blood, splenic cellular sources and their impact on trafficking of inflammatory cells. Mol Immunol 85:111–119
Speiser DE et al (2005) Rapid and strong human CD8+ T cell responses to vaccination with peptide, IFA, and CpG oligodeoxynucleotide 7909. J Clin Investig 15(3):739–746
Sridharan V et al (2016a) Definitive chemoradiation alters the immunologic landscape and immune checkpoints in head and neck cancer. Br J Cancer 115(2):252–260
Sridharan V et al (2016b) Immune profiling of adenoid cystic carcinoma: PD-L2 expression and associations with tumor-infiltrating lymphocytes. Cancer Immunol Res 4(8):679–687
Subrahmanyam PB et al (2018) Distinctive predictive biomarker candidates for response to anti-CTLA-4 and anti-PD-1 immunotherapy in melanoma patients. J Immunother Cancer 6:18
Weinberg A et al (2009) Optimization and limitations of use of cryopreserved peripheral blood mononuclear cells for functional and phenotypic T-cell characterization. Clin Vaccine Immunol 16(8):1176–1186
Funding
The Melanoma Research Alliance (F.S.H.), the Sharon Crowley Martin Memorial Fund for Melanoma Research (F.S.H.) and the Malcolm and Emily Mac Naught Fund for Melanoma Research (F.S.H.) at Dana-Farber Cancer Institute.
Author information
Authors and Affiliations
Corresponding author
Ethics declarations
Conflict of interest
F.S. Hodi serves as a consultant to Genentech, Bristol-Myers Squibb, Merck, Novartis, Amgen, Sanofi, Bayer, Pfizer, EMD Serono, Verastem, Aduro, Celldex and Incyte.
Informed consent
All individuals gave written informed consent to participate in research prior to blood collection in accordance with Dana-Farber/Harvard Cancer Center Institutional Review Board (IRB) approved protocols.
Rights and permissions
About this article

Cite this article
Holland, M., Cunningham, R., Seymour, L. et al. Separation, banking, and quality control of peripheral blood mononuclear cells from whole blood of melanoma patients. Cell Tissue Bank 19, 783–790 (2018). https://doi.org/10.1007/s10561-018-9734-x
Received:
Accepted:
Published:
Issue Date:
DOI: https://doi.org/10.1007/s10561-018-9734-x