
Abstract
Potentially, Agatston coronary artery calcium (CAC) score could be calculated on contrast computed tomography coronary angiography (CTA). This will make a separate non-contrast CT scan superfluous. This study aims to assess the performance of a novel fully automatic algorithm to detect and quantify the Agatston CAC score in contrast CTA images. From a clinical registry, 20 patients were randomly selected for each CAC category (i.e. 0, 1–99, 100–399, 400–999, ≥1,000). The Agatston CAC score on non-contrast CT was calculated manually, while the novel algorithm was used to automatically detect and quantify Agatston CAC score in contrast CTA images. The resulting Agatston CAC scores were validated against the non-contrast images. A total of 100 patients (60 ± 11 years, 63 men) were included. The median CAC score on non-contrast CT was 145 (IQR 5–760), whereas the contrast CTA CAC score was 170 (IQR 23–594) (P = 0.004). The automatically computed CAC score showed a high correlation (R = 0.949; P < 0.001) and intra-class correlation (R = 0.863; P < 0.001) with non-contrast CT CAC score. Moreover, agreement within CAC categories was good (κ 0.588). Fully automatic detection of Agatston CAC score on contrast CTA is feasible and showed high correlation with non-contrast CT CAC score. This could imply a radiation dose reduction and time saving by omitting the non-contrast scan.
Introduction
Coronary artery disease (CAD) is one of the leading causes of death worldwide [1]. Coronary artery calcium (CAC) is a representative marker of the overall coronary atherosclerosis burden [2]. The amount of coronary artery calcium is routinely detected and quantified on a non-contrast computed tomography (CT) scan according to the Agatston scoring approach [3, 4]. This Agatston CAC score has been demonstrated to have prognostic value for cardiovascular events, independent of age, ethnicity and sex [5–10]. However, for the estimation of severity and extent of coronary stenosis a contrast computed tomography coronary angiography (CTA) has to be performed [11, 12]. This technique allows evaluation of coronary stenosis with good accuracy compared to invasive coronary angiography [13–16]. Moreover, contrast CTA provides accurate visualization of the coronary vessel wall and allows assessment of coronary plaque constitution.
In current clinical practice, a non-contrast CT scan is often performed to quantify the Agatston CAC score. Subsequently, depending on the clinical question, a contrast CTA scan is performed to assess coronary stenosis severity. While the non-contrast CT scan and contrast CTA are performed separately, they both contribute to radiation exposure [17]. Since calcified lesions can be distinguished on contrast CTA, it is conceivable that contrast CTA images could be used to detect coronary calcium and calculate the Agatston score. If Agatston CAC score calculation on contrast CTA images is accurately achievable, it could result in making a separate non-contrast CT scan superfluous, hence resulting in a decrease in cost, time and radiation exposure. Previous studies have addressed this topic, aiming to assess the potential of software tools to quantify CAC on CTA datasets, however, these algorithms required (partial) manual interference or provided moderate results [18–22]. Recently, using a novel software algorithm, fully automatic quantification of the Agatston CAC score on contrast CT has become feasible. However, the accuracy of this tool has yet to be determined.
Therefore, the aim of this present study was to (1) assess the feasibility of a novel tool to fully automatically detect and quantify CAC in contrast CTA images, and calculate the Agatston CAC scores and (2) to compare the derived Agatston scores with Agatston CAC scores obtained from traditional non-contrast CT scans and assess the agreement per Agatston CAC score risk category. (3) The contribution of the non-contrast CT to the overall radiation exposure was calculated.
Methods
Patients and study protocol
The population consisted of 100 patients from an ongoing clinical registry. Per Agatston CAC score risk categories (i.e. 0, 1–99, 100–399, 400–999, ≥1,000), 20 patients, with sufficient image quality of the non-contrast CT and the contrast CTA, were randomly selected to ensure an equal distribution. These patients had known or suspected CAD and were clinically referred for the evaluation of chest pain to the Leiden University Medical Center, between 2008 and 2012. All patients underwent a non-contrast CT scan followed by a contrast CTA.
Patients with previous, myocardial infarction, percutaneous coronary intervention (PCI) or coronary artery bypass graft surgery (CABG) were excluded. The clinical data were prospectively entered into the departmental Cardiology Information System (EPD-Vision©, Leiden University Medical Center, the Netherlands) and retrospectively analyzed. The Institutional Review Board of the Leiden University Medical Center approved this retrospective evaluation of clinically collected data, and waived the need for written informed consent.
Cardiac CT and CTA acquisition
Patients were scanned with either a 64-slice CT scanner (Aquilion 64, Toshiba Medical System, Otowara, Japan) or a 320-row volumetric scanner (Aquilion ONE, Toshiba Medical System, Otowara, Japan). Contra-indications for CTA were, (1) impaired renal function (glomerular filtration rate < 60), (2) pregnancy, (3) (supra-) ventricular arrhythmias, (4) known allergy to contrast agent, (5) severe claustrophobia. Prior to CT examination, beta-blocking medication was administered if the heart rate was ≥65 beats per minutes, unless contra-indicated. Patients received 0.4 mg of nitrates sublingual prior to the scan. Non-contrast CT and contrast CTA were performed according to standard clinical practice [23, 24]. For assessment of the CAC-score on non-contrast CT, images with a 3 mm slice-thickness were reconstructed. Scan parameters for 64-slice CTA were 400 ms gantry rotation time, collimation of 64 × 0.5 mm, tube voltage of 100–135 kV and tube current of 250–350 mA, depending on body mass index. Scan parameters for 320-row CTA were 350 ms gantry rotation time, collimation of 320 × 0.5 mm, tube voltage of 100–135 kV and tube current of 400–580 mA, depending on body mass index. Images were acquired prospectively and reconstructed at 75 % and at the best phase of the R–R interval [25]. Radiation dose was calculated with a dose-length product conversion factor of 0.014 mSv/(mGy × cm) [26].
Quantification of Agatston CAC score on non-contrast CT scan
The standard non-contrast CT scan was made to manually assess the total amount of CAC in the coronary arteries, defined according to the Agatston CAC-scoring method. To analyze the CAC score, the collected images were transferred to a workstation for evaluation using dedicated post-processing software (CalcSore v1.1.1 by Medis specials bv). Coronary calcified lesions were manually selected and quantified in non-contrast CT scans with a threshold of 130 Hounsfield Unit (HU).
Quantification of Agatston CAC score on contrast CTA
Prior to coronary artery calcium quantification, image quality of both non-contrast CT and contrast CTA was assessed using the following ordinal scale: good image quality, moderate image quality or poor image quality. Image data sets without motion artefacts or increased image noise were evaluated as good quality datasets with motion artefacts or increased image noise were classified as moderate. Clinically non-diagnostic scans were classified as poor image quality and were excluded.
A novel algorithm for fully automatic detection and quantification of the calcium volume and Agatston CAC score on the contrast CTA datasets was developed. The Agatston CAC score was automatically derived in the following steps:
-
1.
The coronary tree was automatically extracted from the CTA dataset using a 3D vessel-tracking algorithm [27].
-
2.
Using an automatic tree labeling algorithm, the segments of the coronary tree were automatically labeled according the AHA 17-segment model [27–29]. Subsequently, the four main coronaries, i.e., right coronary artery (RCA), left main (LM) artery, left anterior descending (LAD) artery and left circumflex (LCx) artery and corresponding side-branches were identified based on this labeling result. Multi-planar reformations (MPRs) were created based on the centerlines of the detected coronaries. An experienced observer verified the extracted and labeled coronary tree.
-
3.
To automatically detect and quantify CAC, a novel algorithm was used to identify the presence of calcium in the coronary arteries. A reference trend line on the lumen intensity values along the centerline was fitted for each individual vessel, ranging from the proximal to the distal part of the vessel. After this, only the pixels near the centerline with intensity values higher than the reference trend line are considered to be calcified and selected for further processing using and advanced region growing scheme (Fig. 1.)
Fig. 1 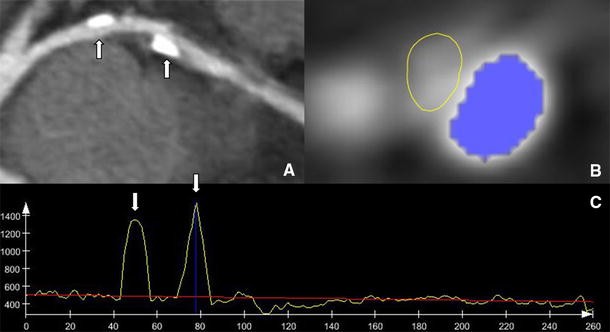
Method for automatic coronary calcium detection. Example of the method for automatic coronary calcium detection. a An MPR with two calcified coronary lesions (white arrows). c Demonstrates the luminal intensities plot. The x axis represents the distance from the coronary ostium, the y axis represents the peak intensity along the centerline (HU). The red line is the trendline of this plot. Large deviations from this trendline are considered coronary calcium (white arrows). b Demonstrates a cross-sectional view of the coronary artery with the detected coronary calcium marked in blue. The yellow line indicates the coronary lumen border
-
4.
All detected calcified pixels in the MPRs are projected back into the original volume. Any emerging gaps within projected spots are filled if needed. Next, the volume is resampled to have a slice thickness of 3 mm.
-
5.
Based on the detected CAC volumes for each of the four main coronaries and side-branches, the Agatston CAC score was automatically calculated using a predefined conversion factor of 2.74 [19].

An example of the automatic CAC assessment on contrast CTA with corresponding non-contrast CT reference is depicted in Fig. 2.

Patient example of coronary calcium detection with both methods. A 66 year old male patient with calcified coronary plaque in the LAD. a Illustrates the coronary artery calcium (CAC) on the non-contrast CT scan (arrows). b Depicts the manual detection of the calcified lesions on the same non-contrast CT scan. c CAC in the same patient on the contrast CTA scan. d Depicts the automatic detection and quantification of the calcium on the contrast CTA scan with a novel fully automatic algorithm. The Agatston CAC score was 63 on the non-contrast CT scan and 58 on the contrast CTA scan as assessed with the fully automatic algorithm
First, the Agatston CAC scores derived from contrast CTA using the novel software tool were compared to the Agatston CAC score from non-contrast CT as a reference. Second, differences in performance of the software per coronary vessel were assessed. Third, the agreement between the two methods per Agatston CAC score risk category was assessed. Last, the contribution of the non-contrast CT to the overall radiation exposure was calculated.
Statistical analysis
Continuous data are presented as mean ± SD if normally distributed or as median (interquartile range, IQR) if non-normally distributed. Categorical data are presented as absolute numbers and percentages. A comparison was made between the non-contrast CT Agatston CAC score and the contrast CTA Agatston CAC score. Non-parametric tests were used to compare the absolute difference between the CAC score derived from non-contrast CT scan and contrast CTA. A non-parametric correlation (Spearman) and intra-class correlation (ICC) were used to calculate the correlation between the two methods. An ICC < 0.4 indicated poor correlation, an ICC between 0.4 and 0.75 indicated fair to good correlation, and an ICC greater than 0.75 indicated excellent correlation [30]. Thereafter, the Bland–Altman method was used to assess the limits of agreement for the Agatston CAC score between the two methods [31]. The Bland–Altman was calculated for both absolute and percentage differences. For clarity, a magnified view of the Bland–Altman plot with an X-axis range up to 1,000 was provided. The agreement within the Agatston CAC score risk categories, was evaluated using the weighted kappa (κ) statistics. Poor, fair-to-good and excellent were defined by a κ-value of <0.4, between 0.4 and 0.75, and >0.75, respectively [32]. All statistical tests were two-sided and a P value < 0.05 was considered statistically significant. All statistical analyses were performed with SPSS software (Version 20.0, SPSS Inc., Chicago, Illinois).
Results
Patient population
The total patient population consisted of 100 patients with a mean age of 60 ± 11 years and 63 patients (63 %) were male. The clinical baseline characteristics of the patients are listed in Table 1. Hypercholesterolemia was observed in 33 % of patients, and 21 % of patients presented with obesity. Of the 100 scans, 54 were classified as good; the remaining 46 were classified as moderate quality.
Agreement between non-contrast CT and contrast CTA Agatston CAC score
The median Agatston CAC score on non-contrast CT was lower compared to the Agatston CAC score on contrast CTA (145 (IQR 5–760) and 170 (IQR 23–594), P = 0.004, respectively) (Table 2). Overall, the median difference was 0 (−217 to 35).
The correlation between the non-contrast CT- and contrast CTA Agatston CAC score is displayed in Fig. 3. The Agatston CAC score on non-contrast CT was highly correlated with the contrast CTA Agatston CAC score (R = 0.949, P < 0.001 and ICC = 0.863, P < 0.001). The correlation was similar between scans of good image quality (R = 0.934) and moderate image quality (R = 0.949). The correlation was similar for patients scanned with 100 kV (n = 13), R = 0.994, P < 0.001, 120 kV (n = 72), R = 0.935, P < 0.001, or 135 kV (n = 15), R = 0.960, P < 0.001. For all three kV settings the ICC between the non-contrast CT and contrast CTA CAC score was 0.784.

Correlation between non-contrast CT Agatston CAC score and contrast CTA Agatston CAC score. The left figure shows the full range scatter plot. The right figure shows a magnified view of the non-contrast CT Agatston CAC score up to 1000
The Bland–Altman analysis of the Agatston CAC score as assessed with both methods is shown in Fig. 4. The non-contrast CT Agatston CAC score was lower compared to the contrast CTA Agatston CAC score as demonstrated by a bias of −176 with 95 %-limits of agreement ranging from −1,248 to 896. The bias on a percentage basis was 3 % with 95 %-limits of agreement ranging from −174 to −168 %. As demonstrated in the Bland–Altman analysis the absolute error increases with increasing CAC-scores (lower panels). However, on a percentage basis this trend is not observed (upper panels).

Bland–Altman of non-contrast CT Agatston CAC score and contrast CTA Agatston CAC score. The left panel shows the Bland–Altman plot. De dotted vertical lines represent the bias with corresponding 95 % limits of agreement. The right panel shows a magnified view of the same Bland–Altman plot with an X axis range of 1,000. In the two upper panels the Y axis represents the percentage difference of the Agatston CAC score between the two methods. In the lower two panels the Y axis represents the absolute difference
The per-vessel analysis, as described in Table 2, demonstrated similar results. Correlations for LAD, RCA and LCX were 0.894, 0.827 and 0.754, respectively (P < 0.001). However, the correlation for LM CAC score was lower (R = 0.513, P < 0.001) compared to the correlation for the overall CAC score. Except for RCA, there were no significant absolute differences between non-contrast CT Agatston CAC score and contrast CTA Agatston CAC score per vessel.
Agreement within Agatston CAC score risk categories
The agreement between the two methods within the traditional Agatston CAC score risk categories was assessed and depicted in Table 3. The fully automatic algorithm used on contrast CTA classified 67/100 patients (67 %) in the same cardiovascular risk category compared with the non-contrast CT Agatston CAC score. Of the remaining 33 (33 %) patients, 10 (10 %) shifted to a higher category and 23 (23 %) to a lower category. Importantly, of the 20 patients with a non-contrast CT Agatston CAC score of 0, 18 (90 %) patients were accurately classified as CAC score of 0 on the contrast scan. Only two patients shifted to a higher category, these patient had a contrast CTA Agatston CAC score of 11 and 14. Furthermore, in the CAC score category of 1–99, 14 (70 %) patients remained in the same category while 3 (15 %) patients shifted to a lower category and 3 (15 %) patients to a higher category. In the category 100–399, 11 (55 %) patients remained in the same category, while 5 (25 %) patients shifted to a lower category of 1–99 and 4 (20 %) patients shifted to a higher category of 400–999. Of the 20 patients in the category 400–999, 10 (50 %) patients remained in the same category after calcium scoring on CTA images, while 9 (45 %) patients shifted to a lower category and 1 (5 %) patient to a higher category of ≥1,000. Lastly, 6 (30 %) patient in the risk category of ≥1,000, shifted to a lower category. Overall, the agreement within the Agatston CAC score risk categories was good (κ = 0.588). This was the same for scans with good (κ = 0.578) and fair (κ = 0.586) image quality.
Radiation dose
In total, the mean radiation dose was 9.10 ± 5.78 mSv. For non-contrast CT the radiation dose was 1.39 ± 0.39 mSv and for the contrast CTA 7.60 ± 5.78 mSv. On average, the radiation dose of the non-contrast CT was 20 % of the total radiation exposure.
Discussion
The present study assessed the feasibility and accuracy of a novel software tool for fully automatic detection of CAC and subsequent quantification of the Agatston CAC score on contrast CTA images. The automatic algorithm was evaluated by using the non-contrast CT Agatston CAC score as a reference standard. The Agatston CAC score derived from contrast CTA was well-correlated with non-contrast CT Agatston CAC score. Moreover, even though a third of the patients were reclassified in a different CAC-risk category, the overall agreement within the traditional Agatston CAC score risk categories was good, thus providing accurate assessment of cardiovascular risk in correspondence with the Agatston CAC score derived from non-contrast CT. Based on these results, the novel software tool allows for accurate quantification of CAC on contrast CTA and could thus provide an important prognostic and well validated marker of risk. Omitting the non-contrast CT from the scan protocol could have potentially reduced the radiation exposure in this study cohort by 20 %.
Contrast CTA conversion factor
Different voxel size, contrast attenuation and applied threshold for calcium scoring influences the Agatston CAC score between the non-contrast CT images and contrast CTA [20, 21, 25, 33, 34]. To adapt for this difference, a conversion factor is required. This factor was previously established by Mylonas et al. [19]. For this purpose, 92 patients underwent both a non-contrast CT scan and contrast CTA scan to measure CAC. Using linear regression analysis, a conversion factor of 2.74 for the CAC score on contrast CTA was established. A subsequent validation study in 47 patients, revealed an excellent correlation between Agatston CAC score derived from non-contrast CT and contrast CTA after applying the predefined conversion factor. The same conversion factor was used in the present study to calculate the Agatston CAC score on contrast CTA.
Different methods for quantification of CAC score on contrast CTA
Several previous studies have focused on the feasibility of assessing and computing the CAC scores from contrast CTA images [18–22, 35]. The main challenge in all these studies was to establish an accurate method to differentiate between CAC and coronary artery luminal contrast.
Manual delineation of CAC
Manually segmentation of CAC from the contrast filled lumen by delineating the calcified spots was performed by Bijl et al. [36] in 100 patients, of which 50 presented without CAC. To derive the Agatston CAC score from contrast CTA images, calcifications were manually delineated and thereafter quantified with a HU threshold of 130 for each voxel within the marked area. The CAC score, derived from the contrast CTA, was well correlated with non-contrast CT CAC score. Similar to the present study, in only a small number of patients with a non-contrast CAC score of zero, CAC was detected on contrast CTA. Even though manual input was needed, the inter-observer agreement was as excellent for the CTA-derived Agatston scores.
Fixed HU thresholds
Another method to differentiate between CAC and contrast was sought in increasing the HU threshold for CAC detection hence avoiding the need for manually drawn contours. Glodny et al. [20] used a detection threshold of 600 HU to compute the Agatston CAC on CTA images. Although the increased attenuation threshold revealed an excellent correlation for the Agatston CAC score between non-contrast CT and contrast CTA, an overall underestimation of the calcium scoring in CTA images was observed. The authors provide no detail on the CAC-risk categories. In contrast, Hong et al. [21] selected 50 patients to derive a Agatston CAC score on contrast CTA images, with a detection threshold of 350 HU. In this study, the CAC score on contrast CTA was significantly overestimated. The under- and overestimation of the Agatston CAC score in the previous studies can be the result of inadequate threshold definitions in some patients. Luminal contrast could have exceeded the HU threshold level, thereby being detected as coronary artery calcium, or vice versa, CAC being mistakenly characterized as luminal contrast.
Patient specific HU thresholds
Previous publications have indicated that HU threshold for coronary plaque quantification are dependent on luminal contrast intensity and CT scan protocol [33, 37]. To account for this, a scan (or patient) specific threshold could be preferable. Mylonas et al. [19] determined the HU threshold for CAC scoring based on contrast attenuation. For this purpose, the calcium detection threshold was set at aortic attenuation (HU) +2 standard deviations (SD). In this study, an excellent correlation was observed between CAC score on contrast CTA and non-contrast CT. Moreover, 83 % of patients were classified in the same CAC risk category. However, this method needed manual threshold determination and manual CAC selection.
Similarly, Bischoff et al. [22] used 150 % of the mean attenuation (HU) in the ascending aorta as a threshold. An excellent correlation was observed between CAC score based on contrast CTA compared to non-contrast CT and >90 % of patients were classified in the same CAC risk category. However, manual interference forms part of the method; the study used a manual threshold determination and semi-automated system for CAC scoring.
Advanced algorithms
In the present study, a novel HU adaptive algorithm was used. This trend-line based algorithm facilitates patient specific calcium detection that adapts itself to the contrast attenuation. Similar to the present study, Ebersbergen et al. [35] described a tool to fully automatically derive coronary artery calcium scores from contrast CTA studies in a cohort of 127 patients. This study used an automated model-based image processing algorithm, whereas the present study used an algorithm based on HU intensities. Ebersbergen et al. demonstrated no significant difference in Agatston CAC scores between non-contrast CT calcium scoring and contrast coronary CTA. Moreover, a significant relation was noted between both methods as well as good agreement within the CAC score risk categories. Similar to our study, the approach of Ebersbergen et al. underlined the superiority of advanced algorithms for CAC scoring on CTA. These algorithms are accurate, reproducible and provide a patient specific approach, adaptive to luminal contrast attenuation.
Clinical implications
Risk classifications
The prognostic value of CAC score has been extensively studied [10, 23, 38, 39]. For this purpose the CAC score is usually stratified into risk categories [23, 39]. An increase in mortality was observed per increment in CAC score risk category [10, 38, 39]. For clinical purpose, accurate determination of the CAC score risk category is sufficient for risk classification of patients (i.e. the exact CAC score is less important). In this study, a good agreement within the Agatston CAC risk categories was observed. This indicates that quantifying the Agatston CAC score on contrast CTA is sufficiently accurate for clinical decision making. In addition to the clinical value of the CAC score, the prognostic value of CAC progression has been established [40, 41]. However, in the present study, no serial CAC-score or CTA were available. Therefore, the accuracy of the assessment of CAC progression could not be established.
Radiation exposure reduction
The risk of cancer per 10.000 CAC scans in female patients of 50 years old is 3/10,000 [42]. Even though this number seems relatively small, it is estimated that the incidence of cancer induced by non- contrast CT for CAC score in the United States is around 80–400 per year. In the present patient cohort there is potential for 20 % radiation dose reduction, if the non-contrast CT scans are excluded from the protocol. Recently, modifications to contrast CTA scan protocol have resulted in decreased radiation dose, thus reducing CTA radiation exposure [43]. These radiation dose reduction advances could not contribute to less radiation exposure by the non-contrast CT scan because the Agatston CAC score requires a fixed scan protocol. Therefore, with the current low-dose scan protocols the radiation dose of the non-contrast CT is relatively high and the gain of omitting the non-contrast CT from the scan protocol even greater.
Limitations
Some limitations of the present study need to be considered. For this analysis, patients with poor quality images were excluded for the detection and quantification of Agatston CAC score on contrast CTA. It is unclear how the software tool would perform in datasets with high noise levels or severe motion artifacts. In this study the algorithm performed suboptimal in the RCA. This coronary artery is most affected by motion during the cardiac cycle and therefore more prone for motion artefacts [44]. Moreover, the relative lower correlation for LM calcifications could be due to low number of patients (n = 38) with a positive CAC score in the LM. The observer variability for the assessment of the CAC-score on non-contrast CT was not assessed in this study. However, this method is widely used and accepted as a robust measurement. The observer variability for the contrast CTA CAC-score could not be assessed since this was a fully automatic method. All cardiac CTA datasets were performed with either a 64-slice CT scanner or a 320-row volumetric scanner from one vendor. Therefore, the applicability of this algorithm to datasets acquired on other vendor machines needs to be further studied. Differences in the detection of the Agatston CAC score between non-contrast CT and contrast CTA could have been caused by the difference in image slice thickness [45]. CAC in non-contrast CT is visually detected in the axial plane in 3.0 mm reconstructed images, whereas CAC in the contrast CTA scan was detected on MPRs based on images with a 0.5 mm slice thickness. Due to this difference, calcified spots located in-between slices of the non-contrast CT are detected on the contrast CTA, resulting in an overestimation of CAC score on contrast CTA. In clinical practice, observers could perform an additionally manual verification of the contrast CTA Agatston CAC scores, thereby reducing the number of false positive/negative results. For the present study a predefined conversion factor was applied based on a previous study [19]. It is expected that a conversion factor specific for the present algorithm would have provided even higher correlations and better agreement.
Conclusion
A fully automatic detection and quantification of Agatston CAC score on contrast CTA is feasible and shows an excellent correlation with the Agatston CAC score derived from non-contrast CT. Furthermore, a good agreement was obtained between the non-contrast CT and the contrast CTA within the Agatston CAC score risk categories. Importantly, the accuracy to rule-out CAC on contrast CTA compared to non-contrast CT was excellent. By virtue of the excellent correlation between both methods, this fully automatic system could be applied in future clinical practice, thereby saving time on manual interpretation and potentially reduce radiation exposure, by obviating the need for a separate non-contrast CT scan.
References
Roger VL, Go AS, Lloyd-Jones DM, Benjamin EJ, Berry JD, Borden WB, Bravata DM, Dai S, Ford ES, Fox CS, Fullerton HJ, Gillespie C, Hailpern SM, Heit JA, Howard VJ, Kissela BM, Kittner SJ, Lackland DT, Lichtman JH, Lisabeth LD, Makuc DM, Marcus GM, Marelli A, Matchar DB, Moy CS, Mozaffarian D, Mussolino ME, Nichol G, Paynter NP, Soliman EZ, Sorlie PD, Sotoodehnia N, Turan TN, Virani SS, Wong ND, Woo D, Turner MB (2012) Executive summary: heart disease and stroke statistics–2012 update: a report from the American Heart Association. Circulation 125:188–197
Genders TS, Pugliese F, Mollet NR, Meijboom WB, Weustink AC, van Mieghem CA, de Feyter PJ, Hunink MG (2010) Incremental value of the CT coronary calcium score for the prediction of coronary artery disease. Eur Radiol 20:2331–2340
Greenland P, Bonow RO, Brundage BH, Budoff MJ, Eisenberg MJ, Grundy SM, Lauer MS, Post WS, Raggi P, Redberg RF, Rodgers GP, Shaw LJ, Taylor AJ, Weintraub WS (2007) ACCF/AHA 2007 clinical expert consensus document on coronary artery calcium scoring by computed tomography in global cardiovascular risk assessment and in evaluation of patients with chest pain: a report of the American College of Cardiology Foundation Clinical Expert Consensus Task Force (ACCF/AHA Writing Committee to Update the 2000 Expert Consensus Document on Electron Beam Computed Tomography) developed in collaboration with the Society of Atherosclerosis Imaging and Prevention and the Society of Cardiovascular Computed Tomography. J Am Coll Cardiol 49:378–402
Agatston AS, Janowitz WR, Hildner FJ, Zusmer NR, Viamonte M Jr, Detrano R (1990) Quantification of coronary artery calcium using ultrafast computed tomography. J Am Coll Cardiol 15:827–832
Folsom AR, Kronmal RA, Detrano RC, O’Leary DH, Bild DE, Bluemke DA, Budoff MJ, Liu K, Shea S, Szklo M, Tracy RP, Watson KE, Burke GL (2008) Coronary artery calcification compared with carotid intima-media thickness in the prediction of cardiovascular disease incidence: the Multi-Ethnic Study of Atherosclerosis (MESA). Arch Intern Med 168:1333–1339
Budoff MJ, Gul KM (2008) Expert review on coronary calcium. Vasc Health Risk Manag 4:315–324
Detrano R, Guerci AD, Carr JJ, Bild DE, Burke G, Folsom AR, Liu K, Shea S, Szklo M, Bluemke DA, O’Leary DH, Tracy R, Watson K, Wong ND, Kronmal RA (2008) Coronary calcium as a predictor of coronary events in four racial or ethnic groups. N Engl J Med 358:1336–1345
Polonsky TS, McClelland RL, Jorgensen NW, Bild DE, Burke GL, Guerci AD, Greenland P (2010) Coronary artery calcium score and risk classification for coronary heart disease prediction. JAMA 303:1610–1616
Budoff MJ, Shaw LJ, Liu ST, Weinstein SR, Mosler TP, Tseng PH, Flores FR, Callister TQ, Raggi P, Berman DS (2007) Long-term prognosis associated with coronary calcification: observations from a registry of 25,253 patients. J Am Coll Cardiol 49:1860–1870
Greenland P, LaBree L, Azen SP, Doherty TM, Detrano RC (2004) Coronary artery calcium score combined with Framingham score for risk prediction in asymptomatic individuals. JAMA 291:210–215
Meijboom WB, Meijs MF, Schuijf JD, Cramer MJ, Mollet NR, van Mieghem CA, Nieman K, van Werkhoven JM, Pundziute G, Weustink AC, de Vos AM, Pugliese F, Rensing B, Jukema JW, Bax JJ, Prokop M, Doevendans PA, Hunink MG, Krestin GP, de Feyter PJ (2008) Diagnostic accuracy of 64-slice computed tomography coronary angiography: a prospective, multicenter, multivendor study. J Am Coll Cardiol 52:2135–2144
Hamon M, Biondi-Zoccai GG, Malagutti P, Agostoni P, Morello R, Valgimigli M, Hamon M (2006) Diagnostic performance of multislice spiral computed tomography of coronary arteries as compared with conventional invasive coronary angiography: a meta-analysis. J Am Coll Cardiol 48:1896–1910
Meijer AB, YL O, Geleijns J, Kroft LJ (2008) Meta-analysis of 40- and 64-MDCT angiography for assessing coronary artery stenosis. AJR Am J Roentgenol 191:1667–1675
Mowatt G, Cook JA, Hillis GS, Walker S, Fraser C, Jia X, Waugh N (2008) 64-Slice computed tomography angiography in the diagnosis and assessment of coronary artery disease: systematic review and meta-analysis. Heart 94:1386–1393
Budoff MJ, Dowe D, Jollis JG, Gitter M, Sutherland J, Halamert E, Scherer M, Bellinger R, Martin A, Benton R, Delago A, Min JK (2008) Diagnostic performance of 64-multidetector row coronary computed tomographic angiography for evaluation of coronary artery stenosis in individuals without known coronary artery disease: results from the prospective multicenter ACCURACY (Assessment by Coronary Computed Tomographic Angiography of Individuals Undergoing Invasive Coronary Angiography) trial. J Am Coll Cardiol 52:1724–1732
Miller JM, Rochitte CE, Dewey M, Arbab-Zadeh A, Niinuma H, Gottlieb I, Paul N, Clouse ME, Shapiro EP, Hoe J, Lardo AC, Bush DE, de Roos A, Cox C, Brinker J, Lima JA (2008) Diagnostic performance of coronary angiography by 64-row CT. N Engl J Med 359:2324–2336
Einstein AJ (2012) Effects of radiation exposure from cardiac imaging: how good are the data? J Am Coll Cardiol 59:553–565
van der Bijl N, Joemai RM, Geleijns J, Bax JJ, Schuijf JD, de Roos A, Kroft LJ (2010) Assessment of Agatston coronary artery calcium score using contrast-enhanced CT coronary angiography. AJR Am J Roentgenol 195:1299–1305
Mylonas I, Alam M, Amily N, Small G, Chen L, Yam Y, Hibbert B, Chow BJ (2013) Quantifying coronary artery calcification from a contrast-enhanced cardiac computed tomography angiography study. Eur Heart J Cardiovasc Imaging 15(2):210–215
Glodny B, Helmel B, Trieb T, Schenk C, Taferner B, Unterholzner V, Strasak A, Petersen J (2009) A method for calcium quantification by means of CT coronary angiography using 64-multidetector CT: very high correlation with Agatston and volume scores. Eur Radiol 19:1661–1668
Hong C, Becker CR, Schoepf UJ, Ohnesorge B, Bruening R, Reiser MF (2002) Coronary artery calcium: absolute quantification in nonenhanced and contrast-enhanced multi-detector row CT studies. Radiology 223:474–480
Bischoff B, Kantert C, Meyer T, Hadamitzky M, Martinoff S, Schomig A, Hausleiter J (2012) Cardiovascular risk assessment based on the quantification of coronary calcium in contrast-enhanced coronary computed tomography angiography. Eur Heart J Cardiovasc Imaging 13:468–475
van Werkhoven JM, Schuijf JD, Gaemperli O, Jukema JW, Kroft LJ, Boersma E, Pazhenkottil A, Valenta I, Pundziute G, de Roos A, van der Wall EE, Kaufmann PA, Bax JJ (2009) Incremental prognostic value of multi-slice computed tomography coronary angiography over coronary artery calcium scoring in patients with suspected coronary artery disease. Eur Heart J 30:2622–2629
de Graaf FR, Schuijf JD, van Velzen JE, Kroft LJ, de Roos A, Reiber JH, Boersma E, Schalij MJ, Spano F, Jukema JW, van der Wall EE, Bax JJ (2010) Diagnostic accuracy of 320-row multidetector computed tomography coronary angiography in the non-invasive evaluation of significant coronary artery disease. Eur Heart J 31:1908–1915
Rutten A, Krul SP, Meijs MF, de Vos AM, Cramer MJ, Prokop M (2008) Variability of coronary calcium scores throughout the cardiac cycle: implications for the appropriate use of electrocardiogram-dose modulation with retrospectively gated computed tomography. Invest Radiol 43:187–194
Valentin, J. (2007) Managing patient dose in multi-detector computed tomography(MDCT). ICRP Publication 102. Ann ICRP 37:1–79, iii
Yang G, Kitslaar P, Frenay M, Broersen A, Boogers MJ, Bax JJ, Reiber JH, Dijkstra J (2012) Automatic centerline extraction of coronary arteries in coronary computed tomographic angiography. Int J Cardiovasc Imaging 28:921–933
Yang G, Broersen A, Petr R, Kitslaar P, de Graaf MA, Bax JJ, Reiber JHC, Dijkstra J (2012) Automatic coronary artery tree labeling in coronary computed tomographic angiography datasets. Comput Cardiol 38:109–102
Austen WG, Edwards JE, Frye RL, Gensini GG, Gott VL, Griffith LS, McGoon DC, Murphy ML, Roe BB (1975) A reporting system on patients evaluated for coronary artery disease. Report of the Ad Hoc Committee for Grading of Coronary Artery Disease, Council on Cardiovascular Surgery. Am Heart Assoc Circ 51:5–40
Rosner B (2005) Fundamentals of biostatistics
Bland JM, Altman DG (1986) Statistical methods for assessing agreement between two methods of clinical measurement. Lancet 1:307–310
Fleiss JL, Levin B, Paik MC (1981) Statistical methods for rates and proportions
Dalager MG, Bottcher M, Andersen G, Thygesen J, Pedersen EM, Dejbjerg L, Gotzsche O, Botker HE (2011) Impact of luminal density on plaque classification by CT coronary angiography. Int J Cardiovasc Imaging 27:593–600
Muhlenbruch G, Wildberger JE, Koos R, Das M, Flohr TG, Niethammer M, Weiss C, Gunther RW, Mahnken AH (2005) Coronary calcium scoring using 16-row multislice computed tomography: nonenhanced versus contrast-enhanced studies in vitro and in vivo. Invest Radiol 40:148–154
Ebersberger U, Eilot D, Goldenberg R, Lev A, Spears JR, Rowe GW, Gallagher NY, Halligan WT, Blanke P, Makowski MR, Krazinski AW, Silverman JR, Bamberg F, Leber AW, Hoffmann E, Schoepf UJ (2013) Fully automated derivation of coronary artery calcium scores and cardiovascular risk assessment from contrast medium-enhanced coronary CT angiography studies. Eur Radiol 23:650–657
van der Bijl N, Joemai RM, Geleijns J, Bax JJ, Schuijf JD, de Roos A, Kroft LJ (2010) Assessment of Agatston coronary artery calcium score using contrast-enhanced CT coronary angiography. AJR Am J Roentgenol 195:1299–1305
Akram K, Rinehart S, Voros S (2008) Coronary arterial atherosclerotic plaque imaging by contrast-enhanced computed tomography: fantasy or reality? J Nucl Cardiol 15:818–829
Shareghi S, Ahmadi N, Young E, Gopal A, Liu ST, Budoff MJ (2007) Prognostic significance of zero coronary calcium scores on cardiac computed tomography. J Cardiovasc Comput Tomogr 1:155–159
Shaw LJ, Raggi P, Schisterman E, Berman DS, Callister TQ (2003) Prognostic value of cardiac risk factors and coronary artery calcium screening for all-cause mortality. Radiology 228:826–833
Budoff MJ, Young R, Lopez VA, Kronmal RA, Nasir K, Blumenthal RS, Detrano RC, Bild DE, Guerci AD, Liu K, Shea S, Szklo M, Post W, Lima J, Bertoni A, Wong ND (2013) Progression of coronary calcium and incident coronary heart disease events: MESA (Multi-Ethnic Study of Atherosclerosis). J Am Coll Cardiol 61:1231–1239
Budoff MJ, Hokanson JE, Nasir K, Shaw LJ, Kinney GL, Chow D, Demoss D, Nuguri V, Nabavi V, Ratakonda R, Berman DS, Raggi P (2010) Progression of coronary artery calcium predicts all-cause mortality. JACC Cardiovasc Imaging 3:1229–1236
Berrington de AB, Gonzalez A, Mahesh M, Kim KP, Bhargavan M, Lewis R, Mettler F, Land C (2009) Projected cancer risks from computed tomographic scans performed in the United States in 2007. Arch Intern Med 169:2071–2077
Achenbach S, Marwan M, Ropers D, Schepis T, Pflederer T, Anders K, Kuettner A, Daniel WG, Uder M, Lell MM (2010) Coronary computed tomography angiography with a consistent dose below 1 mSv using prospectively electrocardiogram-triggered high-pitch spiral acquisition. Eur Heart J 31:340–346
Achenbach S, Ropers D, Holle J, Muschiol G, Daniel WG, Moshage W (2000) In-plane coronary arterial motion velocity: measurement with electron-beam CT. Radiology 216:457–463
Mao S, Child J, Carson S, Liu SC, Oudiz RJ, Budoff MJ (2003) Sensitivity to detect small coronary artery calcium lesions with varying slice thickness using electron beam tomography. Invest Radiol 38:183–187
Acknowledgments
We thank A. Rares for his contribution to the preliminary experiments regarding this algorithm.
Conflict of interest
Michiel A. de Graaf is supported by a research grant from the Interuniversity Cardiology Institute of the Netherlands (ICIN, Utrecht, The Netherlands). The department of Cardiology received research grants from Biotronik, Medtronic, Boston Scientific Corporation, St Jude Medical, Lantheus Medical Imaging and GE Healthcare. This work was supported by Dutch Technology Foundation STW, Utrecht, the Netherlands, grant 10084. Pieter Kitslaar is employed by Medis medical imaging systems bv and has a research appointment at the Leiden University Medical Center. Hans Reiber is the Chief Executive Officer of Medis medical imaging systems bv and a Professor of Medical Imaging at the Leiden University Medical Center.
Author information
Authors and Affiliations
Corresponding author
Additional information
W. Ahmed and M. A. de Graaf share first authorship.
Rights and permissions
About this article

Cite this article
Ahmed, W., de Graaf, M.A., Broersen, A. et al. Automatic detection and quantification of the Agatston coronary artery calcium score on contrast computed tomography angiography. Int J Cardiovasc Imaging 31, 151–161 (2015). https://doi.org/10.1007/s10554-014-0519-4
Received:
Accepted:
Published:
Issue Date:
DOI: https://doi.org/10.1007/s10554-014-0519-4