
Abstract
Since the first Butterfly Monitoring Scheme in the UK started in the mid-1970s, butterfly monitoring in Europe has developed in more than ten European countries. These schemes are aimed to assess regional and national trends in butterfly abundance per species. We discuss strengths and weaknesses of methods used in these schemes and give examples of applications of the data. A new development is to establish supra-national trends per species and multispecies indicators. Such indicators enable to report against the target to halt biodiversity loss by 2010. Our preliminary European Grassland Butterfly Indicator shows a decline of 50% between 1990 and 2005. We expect to develop a Grassland Butterfly Indicator with an improved coverage across European countries. We see also good perspectives to develop a supra-national indicator for climate change as well as an indicator for woodland butterflies.
Introduction
Insects are by far the most species-rich group of animals, representing over 50% of the world’s biodiversity (May 1988; Gaston 1991; Groombridge 1992). Contrary to most other groups of insects, butterflies are well-documented, easy to recognize and popular with the general public (De Heer et al. 2005; Thomas 2005). Many European butterflies have decreased considerably in recent years (Van Swaay et al. 2006). As a result, nowadays 71 out of the 576 European butterfly species are considered as threatened in Europe (Van Swaay and Warren 1999). The decline of butterfly species has largely been assessed by examining the change in their area of distribution (Van Swaay 1990, Maes and Van Swaay 1997; Telfer et al 2002). But this approach has several shortcomings. First, it underestimates the rate of population decline because generally species decrease in population numbers first before they disappear locally and regionally (Thomas and Abery 1995). Secondly, most available distributional data suffer from differences in sampling effort over time, which makes it difficult to separate changes in distribution from changes in sampling effort (Dennis et al. 1999). Reliable estimates of trends can only be based on long series of distributional data, because only then correction for sampling effort is possible (Van Swaay 1990, Maes and Van Swaay 1997; Telfer et al 2002), but even then the results should be treated with caution. In order to get early warning signals, it is better to assess trends in population numbers based on monitoring schemes with standardized sampling efforts.
These were the reasons for setting up a national butterfly monitoring scheme in the UK in 1976 (Pollard 1977). This has inspired many others and the number of schemes has gradually increased in Europe (Table 1; Fig. 1; see Kühn et al. 2005, and contributions therein). New schemes are being planned, e.g. in Denmark and Sweden. The number of transects differs much between the current schemes, ranging from just a few transects per country to several hundreds in the UK and the Netherlands. In 2004 Butterfly Conservation Europe (www.bc-europe.eu) was founded and had an important role in bringing together and co-ordinating work on butterfly monitoring in Europe.

Location of Butterfly Monitoring Schemes in Europe (light shading—active schemes, dark shading—planned schemes)
In this paper we describe the main methods used in the current schemes and give a few examples of applications of the data. We discuss the use of butterflies as biodiversity indicators and the perspectives of European butterfly monitoring.
Butterfly monitoring methodology
Field methods
All schemes apply the method developed for the British Butterfly Monitoring Scheme (Pollard and Yates 1993). The counts are conducted along fixed transects of about 1 km consisting of smaller sections, each with a homogeneous habitat type. The fieldworkers record all butterflies 2.5 m to their right, 2.5 m to their left, 5 m ahead of them and 5 m above them (Van Swaay et al. 2002). Butterfly counts are conducted between March–April and September–October. Visits are only conducted when weather conditions meet specified criteria. In the Dutch (and German) scheme this means temperature above 17°C, or 13–17°C in sunny weather, wind less than six on the scale of Beaufort and no rain (Van Swaay et al. 2002). Most of the transects are recorded by skilled volunteers, but their results are usually checked by butterfly experts.
The number of visits varies from every week in the UK and the Netherlands to three to five visits annually in France. In the Netherlands, transects dedicated to rare species can be visited only during the expected flight period of the species. In normal transects, weekly counts cover the entire flight period of species and thereby offer the opportunity for assessing temporal population trends per transect, but the precision of the trend estimates may be limited (Harker and Shreeve 2008). Weekly visits may however also be demanding for observers. If the objective is only to produce large scale (e.g. national) trends, the efforts may be reduced to much fewer visits (Heliölä and Kuussaari 2005; Roy et al. 2007). Such a reduced-effort scheme is planned in the UK for the wider countryside where mainly common butterflies occur and few volunteers can be recruited. This proposed reduced-effort scheme is based on only a few annual visits, targeted to the period when most information can be gathered, i.e. three visits in July–August plus in some cases an additional one in May (Roy et al. 2005, 2007). Yet a problem with the reduced effort schemes can be that the inevitable ‘why’ question can be hard to answer: it will often not be possible to compare different regions, habitats or management regimes to find the underlying drivers for population changes. Furthermore much more transects will be needed in a reduced effort scheme than in a traditional scheme. The main characteristics of the ‘Traditional’ and ‘Reduced effort’ schemes are summarized in Table 2.
Observers never detect all butterfly individuals present during their visit in the study area (Dennis et al. 2006; Kéry and Plattner 2007). Therefore, transect counts do not provide information on absolute butterfly numbers but rather yield species-specific relative abundance indices that are assumed to reflect year-to-year population changes over the entire study area. The assumption of constant detection probability has been underpinned by the demonstration of close correlations between transect counts and population estimates based on mark-recapture data (Pollard 1977; Thomas 1983). However, if for some reasons the detection probability for a given species varies over time then trends inferred from transect count results uncorrected for this probability may be biased (Kéry and Plattner 2007).
The likely sources of between-year variation in detection probability are e.g. weather, time of day, observer experience, and vegetation height changing due to succession or more generally any habitat changes (Pollard et al. 1986; Harker and Shreeve 2008; Pellet 2008). Variation due to weather and time of day can be reduced by standardisation of the conditions in which transect counts are conducted (Pollard 1977; Pollard et al. 1986). In addition, in the case of large-scale and long-term monitoring such variation may be assumed to be random only, thereby decreasing the precision of the results, without inducing any bias. Still, any systematic changes in observer experience, vegetation height or even the behaviour of species cannot be ruled out completely. We therefore suggest to test any long-term changes in detection probabilities using methods to analyse multiple visits as applied for butterflies by Kery and Plattner (2007) and Pellet (2008) or distance-sampling methods (Pollock et al. 2002). Distance-sampling has already been applied in butterfly population studies in Northern America (Brown and Boyce 1998), and there are currently attempts to incorporate it in the UK Butterfly Monitoring Scheme (K. Cruickshanks, personal communication).
A related problem is that of the variable longevity in adult butterflies and its effect on transect count reliability. Since adult butterflies typically enclose in daily cohorts, their numbers recorded on transects depend not only on seasonal population sizes, but also on longevities, and consequently transect count results do not necessarily follow year-to-year population changes precisely (Zonneveld 1991; Nowicki et al. 2005, 2008). Nevertheless, the effect of between-season variation in butterfly longevity is likely to become random with extensive data sets.
Transect selection
To be able to draw proper inferences on the temporal population trends at national or regional level, transects should best be selected in a random or stratified random manner (Sutherland 2006). Several recent schemes, e.g. in Switzerland and France, have been designed in this manner (Henry et al. 2005). Unfortunately, such a procedure would yield many data for common butterflies, but few data for rare butterflies, unless an unrealistic high number of transect is selected. If a scheme aims to monitor rare species, scheme coordinators preferably locate transects in areas where rare species occur, leading to an overrepresentation of special protected areas. In the older schemes, such as in the UK and the Netherlands, but also in the recently established scheme in Germany, transects were selected by free choice of observers, which in some cases has led to the overrepresentation of protected sites in natural areas and the undersampling of the wider countryside and urban areas (Pollard and Yates 1993); while in Germany this effect was not that pronounced (Kühn et al. 2008). Obviously, in such a case the trends detected may be only representative for the areas sampled, while their extrapolation to national trends may produce biased results. Such bias can however be minimized by post-stratification of transects. This implies an a posteriori division of transects by e.g. habitat type, protection status and region, where counts per transect are weighted according to their stratum (Van Swaay et al. 2002, see also Henry et al. 2008, this volume for the principles of weighting).
Calculating indices and population trends
The traditional way of testing temporal population trends in yearly count data is to apply ordinary linear regression. But linear regression assumes the data to be normally distributed, which does not hold for most count data especially if the data contain many zero values. Also log transformation does not work properly in such cases. Generalized Linear Models (GLM; McCullagh and Nelder 1989) offer an alternative to analyse count data. In GLM models, the normality assumption is replaced by the assumption of a distribution of the user’s choice. For count data this distribution is often the Poisson distribution. To apply these models transformation of raw data is no longer required. Poisson (or loglinear) regression is implemented in the widely used program TRIM (TRends and Indices for Monitoring data—Pannekoek and van Strien 2005). Regarding butterflies, this program is used in the UK and the Netherlands and new schemes plan to use it as well (Kühn et al. 2008). Based on a model with year effects and site effects, TRIM produces yearly indices as well as overall trend estimates and is particularly useful if the data contain missing counts due to the coming and going of the voluntary observers in a scheme. TRIM has also options to incorporate serial correlation between counts in consecutive years, testing of covariates and testing of changepoints. An important feature of TRIM is the possibility to incorporate weight factors per transect in order to adjust for oversampling and undersampling of particular habitat types, regions or other characteristics of transects. These weights may be based on e.g. the surface area of heathland in different regions for heath butterflies, or the population shares of species per region (Van Swaay et al. 2002). One might also consider to apply detection probabilities as weights in TRIM, if these probabilities appear to change over time.
A weakness of TRIM is that the model does not include week effects. The counts per week need to be combined first into a yearly sum and only this sum enters the TRIM model. Rothery and Roy (2001) explored the possibilities to apply Generalized Additive Models (GAM) to butterfly monitoring data. A GAM is an extension of GLM methods and allows the smoothing of yearly indices.
Applications
National and regional trends
The main objective of most butterfly monitoring schemes is the production of regional and/or national population trends. These trends are being produced on a routine basis every year in e.g. the UK and the Netherlands, and are meant to evaluate at a large scale the need for or the progress made in butterfly conservation.
Relationships with environmental factors
The transect counts can be used to study the relationships with environmental factors, such as climate change, nutrient load, heavy metals, drainage, land use, fragmentation and management practice. Pollard and Yates (1993) describe detailed studies based on monitoring data. Here we mention only a few examples:
-
Climate change: Several schemes were used to examine the changes in phenology (Roy and Sparks 2000; Stefanescu et al. 2003; Kühn et al. 2008; Van Strien et al. 2008, see Fig. 2). WallisDeVries and Van Swaay (2006) used transect data to study the effects of the combination of nitrogen deposition and climate change on the abundance of butterflies.
Fig. 2 
Mean Julian date of the first 10% of all observed individuals of 19 spring butterfly species in 1992–2004 (January 1 = day 1 etc.). For each species the date was assessed per year of the first 10% of all observed individuals in the entire flight period on all transects together. For details see Van Strien et al. (2008). Trends and confidence intervals were assessed by structural time-series analysis and the Kalman Filter using the program Trendspotter (Soldaat et al. 2007)
-
Nutrient load and heavy metals: Oostermeijer and Van Swaay (1998) examined relationships between butterfly absence/presence data obtained form monitoring transect and Ellenberg indicator values for nutrients, acidity and moisture (Fig. 3). Mulder et al. (2005) examined the effects of heavy metals on butterflies on a particular transect.
Fig. 3 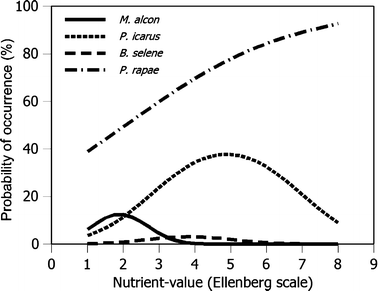
Relationships between the probability of occurrence obtained from monitoring transect data and Ellenberg indicator values for nutrients (from Oostermeijer and Van Swaay 1998)
-
Management practice. Brereton and Warren (2005) found the trend of Lysandra coridon on calcareous grasslands with butterfly friendly management to be more positive than on other grasslands.
-
Multiple environmental factors. Other perspectives for the application of monitoring data are by testing predictions or expectations from envelope approaches, which form the basis of many biodiversity impact and risk assessments (as e.g. in the ALARM project; Settele et al. 2005). This may in particular be relevant to large scale predictions/expectation of changes and trends derived from the combined effects of a multitude of pressures (compare Schweiger et al., in press) and to extrapolations of historically reconstructed trends (Settele et al. 1992).


Butterflies as indicators
Government representatives at the 2002 World Summit of Sustainable Development pledged ‘a significant reduction in the current rate of biodiversity loss by 2010’. The commitment of the EU to protecting biodiversity is even stronger by aiming at halting biodiversity loss by 2010 (Balmford et al. 2005; Gregory et al. 2005). Butterflies may be useful as biodiversity indicators for reporting on the development towards the EU 2010 target. Contrary to most other groups of insects, butterflies have considerable resonance with both the general public and decision-makers (Kühn et al. 2008). Butterflies are also relatively easy to recognize and data on butterflies has been collected for a long time and by many voluntary observers. The method is well described, extensively tested and scientifically sound (Pollard 1977; Pollard and Yates 1993). As a result butterflies are the only invertebrate taxon for which it is currently possible to estimate rates of decline in many parts of the world (de Heer et al. 2005; Thomas 2005). However, butterflies can only be regarded as good biodiversity indicators if it is possible to generalise their trends to a broader set of species groups (Gregory et al. 2005). Admittedly, there is currently a heated debate on how well butterflies meet this criterion. Hambler and Speight (1996, 2004) claimed that this group is likely to experience greater declines than other organisms due to their herbivorous life strategies and thermophily, but Thomas and Clarke (2004) convincingly rejected both arguments. Based on a comprehensive review of studies into their life-history traits, relative sensitivity to climate change, and adjusted extinction rates, Thomas (2005) concluded that butterflies may be considered representative indicators of trends observed in most other terrestrial insects, which together form a major fraction of biodiversity.
Trends per butterfly species can be combined into a unified measure of biodiversity. We followed Gregory et al. (2005) in averaging indices of species rather than abundances in order to give each species an equal weight in the resulting indicators. When positive and negative changes of indices are in balance, we would expect their mean to remain stable. If more species decline than increase, the mean should go down and vice versa. Thus, the index mean is considered a measure of biodiversity change. We used geometric means rather than arithmetic means, because we consider an index change from 100 to 200 equivalent, but opposite, to a decrease from 100 to 50. Buckland et al. (2005) discussed a number of possible composite indicators and found the geometric mean of indices a useful approach.
The results of national butterfly monitoring schemes may be combined to create an indicator at a supra-national level (see also Henry et al. 2008, this volume). Based on the procedure described for European birds (see Gregory et al. 2005), a preliminary grassland butterfly indicator has been developed (Van Swaay and Van Strien 2005). The procedure was as follows:
-
1.
National level. The indices for each species were produced for each individual country with a butterfly monitoring scheme, using TRIM (Pannekoek and Van Strien 2005). Figure 4 shows the national indices as an example for three countries for the grassland species Lasiommata megera.
Fig. 4 
National abundance indices (±standard error) for Lasiommata megera in three European countries. In the first year the index can be calculated it is set to 100 (1992 for The Netherlands, 1994 for Catalunya, 1976 for the United Kingdom)
-
2.
Supranational level. To generate supra-national trends, the difference in national population size of each species in each country was taken into account. This weighting allows for the fact that different countries hold different proportions of a species’ European population (Gregory et al. 2005). Here, we applied as weights the proportions of each country (or part of the country) in the European distribution of a species (based on Van Swaay and Warren 1999). The missing year totals are estimated by TRIM in a way equivalent to the treatment of missing counts for particular transects within countries (Gregory et al. 2005). Figure 5 gives the weighted and combined trend for Lasiommata megera. The same procedure may be used to establish European trends for the Habitats Directive species e.g. Euphydrias aurinia, Maculinea arion and M. nausithous (which are included in the grassland indicator).
Fig. 5 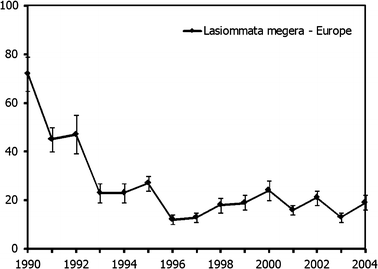
Collated index (±standard error) for Lasiommata megera in the European countries with Butterfly Monitoring Schemes
-
3.
Multispecies level. For each year the geometric mean of the supranational indices is calculated. The preliminary grassland indicator was based on seven widespread grassland species (Ochlodes venata, Anthocharis cardamines, Lycaena phlaeas, Polyommatus icarus, Lasiommata megera, Coenonympha pamphilus, Maniola jurtina) and ten grassland-specialists (Erynnis tages, Thymelicus acteon, Spialia sertorius, Cupido minimus, Maculinea arion, Maculinea nausithous, Polyommatus bellargus, Polyommatus semiargus, Polyommatus coridon, Euphydryas aurinia).


The countries covered were mainly from Western Europe (Table 1). The average grassland butterfly abundance appeared to decline by almost 50% (Fig. 6), which is most probably linked with the agricultural intensification in Western Europe (Van Swaay and Warren 1999; Gregory et al. 2005). The decline is much stronger than the decline of the farmland bird indicator, which has fallen by 19% in the same period (Gregory et al. 2008). This corresponds with the findings in the UK where butterflies have experienced greater losses than birds (Thomas et al. 2004).

European grassland butterfly indicator. Trends and confidence intervals were assessed by structural time-series analysis and the Kalman Filter using the program Trendspotter (Soldaat et al. 2007)
Perspectives
The number of countries with butterfly monitoring schemes is increasing. In addition, the quality of schemes is improving, because any lack of representativeness of transects is taken into account, either by choosing an adequate design or by adjusting any bias during the stage of analysis. As the number and quality of butterfly monitoring schemes grows, the coverage of Europe by supranational species trends and multispecies indicators improves. The European Environmental Agency has already recommended to develop European butterfly indicators (European Environment Agency 2007), and these developments may lead to indicators that are comparable to the farmland bird indicator, which has been adopted by the EU as biodiversity indicator (Gregory et al. 2005). Where possible and feasible, one might even think of combining butterflies and birds in indicators to report against EU’s 2010 target, in order to generalize changes well beyond the set of species.
The grassland butterfly indicator offers the possibility to detect large scale effects of either abandonment of agricultural land (especially occurring in Eastern and Southern Europe) or intensification of agricultural practices (a process already stopped in parts of Western Europe, but ongoing in many European regions).
Apart from a grassland butterfly indicator, we see good perspectives to create a climate change indicator, summarising changes in occurrence of species driven by climate change, as well as a woodland indicator . The same indicators are also in progress for European birds (Gregory et al. 2007). A woodland indicator may however not have such a simple message as the preliminary grassland indicator. That is because woodland butterflies are made up of two different species groups. The first group of woodland butterflies are characteristic for woodland edges and open spots, e.g. Euphydryas maturna and Coenonympha hero. The second group are canopy species, who profit from high forest, e.g. Apatura iris. Though both these groups are genuine woodland butterflies, their expected trends differ entirely. Species from the first group probably suffer in large parts of Europe, because traditional coppicing has been replaced by management for high forest. In Western Europe, where this process has been going on for a few decades, these species are virtually extinct, but in Eastern Europe strong populations still exist (Van Swaay and Warren 1999, 2003). The few species of the second group, which tolerate dense forests (e.g. Pararge aegeria; Shreeve 1984) or the handful of European canopy dwellers (e.g. Neozephyrus quercus, Apatura spp., or Limenitis populi) are rather the exception. Thus, a woodland indicator might have to consider a differentiation of these two groups. As a rule, the majority of European woodland butterflies utilises sunny habitats within woodlands, such as sparse stands, bogs, streamsides, clearings, rides, or edges (Settele et al. 2009).
Over thirty years butterfly monitoring has developed from one test site in Monks Wood in the United Kingdom to more than 2,000 transects scattered over Europe. Almost every year new countries join in to start up a monitoring network. Further extension of butterfly monitoring schemes to other countries in Europe should be encouraged and supported by the European Union and its Member States. The further development and use of butterflies as a European biodiversity indicator will further stimulate new butterfly monitoring schemes,
References
Balmford A, Bennun L, Ten Brink B, Cooper D, Côté IM, Crane P, Dobson AP, Dudley N, Dutton I, Green RE, Gregory RD, Harrison J, Kennedy ET, Kremen C, Leader Williams N, Lovejoy TE, Mace P, May RM, Mayaux P, Morling P, Phillips J, Redford K, Ricketts TH, Rodriguez JP, Sanjayan MA, Schei PJ, Van Jaarsveld AS, Walther BA (2005) The convention on biological diversity’s 2010 target. Science 307:212–213
Brereton T, Warren MS (2005) The use of transect monitoring 2: assessing the impacts of conservation policy and management on butterfly populations. In: Warren M, Pullin A (organizers) Lepidoptera as indicators of biodiversity conservation. 5th international symposium, Southampton University, 8th–10th April 2005
Brown JA, Boyce MS (1998) Line transect sampling of Karner blue butterflies (Lycaeides melissa samuelis). Environ Ecol Stat 5:81–91
Buckland ST, Magurran AE, Green RE, Fewster RM (2005) Monitoring change in biodiversity through composite indices. Philos Trans R Soc Lond B Biol Sci 360:243–254
De Heer M, Kapos V, Ten Brink BJE (2005) Biodiversity trends in Europe: development and testing of a species trend indicator for evaluating progress towards the 2010 target. Philos Trans R Soc Lond B Biol Sci 360:297–308
Dennis RLH, Sparks TH, Hardy BP (1999) Bias in butterfly distribution maps: the effect of sampling effort. J Insect Conserv 3:33–42
Dennis RLH, Shreeve TG, Isaac NJB, Roy DB, Hardy PB, Fox R, Asher J (2006) The effects of visual apparency on bias in butterfly recording and monitoring. Biol Conserv 128:486–492
European Environment Agency (2007) Halting the loss of biodiversity by 2010: proposal for a first set of indicators to monitor progress in Europe. Office for Official Publications of the European Communities. http://reports.eea.europa.eu. Cited 6 Dec 2007
Gaston KJ (1991) The magnitude of global insect species richness. Conserv Biol 5:283–296
Gregory RD, Van Strien AJ, Vorisek P, Gmelig Meyling AW, Noble DG, Foppen RPB, Gibbons DW (2005) Developing indicators for European birds. Philos Trans R Soc Lond B Biol Sci 360:269–288
Gregory RD, Vorisek P, Van Strien AJ, Gmelig Meyling AW, Jiguet F, Fornasari L, Reif J, Chylarecki P, Burfield IJ (2007) Population trends of widespread woodland birds in Europe. Ibis 49(s2):78–97
Gregory RD, Vorisek P, Noble DG, Van Strien AJ, Pazderová A, Eaton ME, Gmelig Meyling AW, Joys A, Foppen RPB, Burfield IJ (2008) The generation and use of bird population indicators in Europe. Bird Conserv Int 18:223–244
Groombridge B (1992) Global biodiversity: status of the Earth’s living resources. Chapman & Hall, London
Hambler C, Speight MR (1996) Extinction rates in British non-marine invertebrates since 1900. Conserv Biol 10:892–896
Hambler C, Speight MR (2004) Extinction rates and butterflies. Science 305:1563
Harker RJ, Shreeve TG (2008) How accurate are single site transect data for monitoring butterfly trends? Spatial and temporal issues identified in monitoring Lasiommata megera. J Insect Conserv 12:125–133
Heliölä J, Kuussaari M (2005) How many counts are needed? Effect of sampling effort on observed species numbers of butterflies and moths in transect counts. In: Kühn E, Feldmann R, Thomas JA, Settele J (eds) Studies on the ecology and conservation of butterflies in Europe. Vol. 1: general concepts and case studies. Pensoft, Sofia, pp 83–84
Henry P-Y, Lengyel S, Nowicki P, Julliard R, Clobert J, Čelik T, Gruber B, Schmeller DS, Babij V, Henle K (2008) Integrating ongoing biodiversity monitoring: potential benefits and methods. Biodivers Conserv (this volume). doi:10.1007/s10531-008-9417-1
Henry P-Y, Manil L, Cadi A, Julliard R (2005) Two national initiatives for butterfly monitoring in France. In: Kühn E, Thomas JA, Feldmann R, Settele J (eds) Studies on the ecology and conservation of butterflies in Europe. Vol. 1: general concepts and case studies. Pensoft, Sofia, 85 pp
Kéry M, Plattner M (2007) Species richness estimation and determinants of species detectability in butterfly monitoring programmes. Ecol Entomol 32:53–61
Kühn E, Feldmann R, Thomas JA, Settele J (2005) Studies on the ecology and conservation of butterflies in Europe. Vol. 1: general concepts and case studies. Pensoft, Sofia, 123 pp
Kühn E, Feldmann R, Harpke A, Hirneisen N, Musche M, Leopold P, Settele J (2008) Getting the public involved into butterfly conservation—lessons learned from a new monitoring scheme in Germany. Israel J Ecol Evol 54:89–103
Maes D, Van Swaay CAM (1997) A new methodology for compiling national red Lists applied to butterflies (Lepidoptera, Rhopalocera) in Flanders (N-Belgium) and The Netherlands. J Insect Conserv 1:113–124
May RM (1988) How many species are there on earth? Science 241:1441–1449
McCullagh P, Nelder JA (1989) Generalized linear models, 2nd edn. Chapman & Hall, London
Mulder CT, Aldenberg D, De Zwart D, Van Wijnen HJ, Breure AM (2005) Evaluating the impact of pollution on plant–Lepidoptera relationships. Environmetrics 16:357–373. doi:10.1002/env.706
Nowicki P, Richter A, Glinka U, Holzschuh A, Toelke U, Henle K, Woyciechowski M, Settele J (2005) Less input same output–simplified approach for population size assessment in Lepidoptera. Popul Ecol 47:203–212
Nowicki P, Settele J, Henry P-Y, Woyciechowski M (2008) Butterfly monitoring methods: the ideal and the real world. Israel J Ecol Evol 54:69–88
Oostermeijer G, Van Swaay CAM (1998) The relationship between butterflies and environmental indicator values: a tool for conservation in a changing landscape. Biol Conserv 86:271–280
Pannekoek J, Van Strien AJ (2005) TRIM 3 manual. Trends and indices for monitoring data. CBS, Statistics Netherlands, Voorburg, Netherlands. (freely available via www.ebcc.info)
Pellet J (2008) Seasonal variation in detectability of butterflies surveyed with Pollard walks. J Insect Conserv 12:155–162
Pollard E (1977) A method for assessing change in the abundance of butterflies. Biol Conserv 12:115–132
Pollard E, Yates TJ (1993) Monitoring butterflies for ecology and conservation: the British Butterfly Monitoring Scheme. Conservation biology series No. 1. Chapman & Hall, London
Pollard E, Hall ML, Bibby TJ (1986) Monitoring the abundance of butterflies 1976–1985. Research and Survey in Nature Conservation Series No. 2. Nature Conservancy Council, Peterborough
Pollock KH, Nichols JD, Simons TR, Farnsworth GL, Bailey LL, Sauer JR (2002) Large scale wildlife monitoring studies: statistical methods for design and analysis. Environmetrics 13:105–119
Rothery P, Roy DB (2001) Application of generalized additive models to butterfly transect count data. J Appl Stat 28:897–909
Roy DB, Sparks TH (2000) Phenology of British butterflies and climate change. Glob Change Biol 6:407–416
Roy DB, Rothery P, Brereton T (2005) The design of a systematic survey scheme to monitor butterflies in the United Kingdom. In: Kühn E, Feldmann R, Thomas JA, Settele J (eds) Studies on the ecology and conservation of butterflies in Europe. Vol. 1: general concepts and case studies. Pensoft, Sofia, pp 102–105
Roy DB, Rothery P, Brereton T (2007) Reduced-effort schemes for monitoring butterfly populations. J Appl Ecol 44:993–1000
Schmeller D, Gruber B, Bauch B, Henle K (2006) EuMon–Arten- und Lebensraum-Monitoring in Europa. Naturschutz und Landschaftsplanung 39:384–385
Schweiger O, Settele J, Kudrna O, Klotz S, Kühn I (in press) Climate change can cause spatial mismatch of trophically interacting species. Ecology
Settele J (1998) Metapopulationsanalyse auf Rasterdatenbasis - Modellgestützte Analyse von Metapopulationsparametern und naturschutzfachliche Umsetzung im Landschaftsmaßstab, erläutert am Beispiel von Tagfaltern. Teubner, Leipzig/Stuttgart. 130 pp
Settele J, Andrick U, Pistorius EM (1992) Zur Bedeutung von Trittsteinbiotopen und Biotopverbund in der Geschichte - das Beispiel des Hochmoorperlmutterfalters (Boloria aquilonaris Stichel 1908) und anderer Moorvegetation bewohnender Schmetterlinge in der Pfalz (SW-Deutschland). Nota lepidopterologica, Supplementum No. 4 (Proc. 7.SEL-Kongreß, Lunz/Österreich 1990), pp 18–31
Settele J, Hammen V, Hulme P, Karlson U, Klotz S, Kotarac M, Kunin W, Marion G, O’Connor M, Petanidou T, Peterson K, Potts S, Pritchard H, Pysek P, Rounsevell M, Spangenberg J, Steffan-Dewenter I, Sykes M, Vighi M, Zobel M, Kühn I (2005) ALARM–Assessing large-scale environmental risks for biodiversity with tested methods. GAIA-Ecol Perspect Sci Soc 14(1):69–72
Settele J, Dover J, Dolek M, Konvicka M (2009) Butterflies of European ecosystems: impact of land use and options for conservation management. In: Settele J, Shreeve T, Konvicka M, Van Dyck H (eds) Ecology of butterflies in Europe. Cambridge University Press, Cambridge
Shreeve TG (1984) Habitat selection, male location, and microclimatic constraints on activity of the speckled wood butterfly Pararge aegeria (L.) (Lepidoptera: Satyridae). Oikos 42:371–377
Soldaat L, Visser H, Van Roomen M, Van Strien AJ (2007) Smoothing and trend detection in waterbird monitoring data using structural time-series analysis and the Kalman filter. J Ornithol 148(suppl 2):351–357
Stefanescu C, Penuelas J, Filella I (2003) Effects of climate change on the phenology of butterflies in the northwest Mediterranean Basin. Glob Change Biol 9:1494–1506
Sutherland WJ (2006) Ecological census techniques, 2nd edn. Cambridge University Press, Cambridge
Telfer MG, Preston CD, Rothery P (2002) A general method for measuring relative change in range size from biological atlas data. Biol Conserv 107:99–109
Thomas JA (1983) A quick method for estimating butterfly numbers during surveys. Biol Conserv 27:195–211
Thomas JA (2005) Monitoring change in the abundance and distribution of insects using butterflies and other indicator groups. Philos Trans R Soc Lond B Biol Sci 360:339–357
Thomas CD, Abery JCG (1995) Estimating rates of butterfly decline form distribution maps: the effects of scale. Biol Conserv 73:59–65
Thomas JA, Clarke RT (2004) Extinction rates and butterflies–response. Science 305:1563–1564
Thomas JA, Telfer MG, Roy DB, Preston CD, Greenwood JJD, Asher J, Fox R, Clarke RT, Lawton JH (2004) Comparative losses of British butterflies, birds, and plants and the global extinction crisis. Science 303:1879–1881
Van Strien AJ, Plantenga WF, Soldaat LL, Van Swaay CAM, WallisDeVries MF (2008) Bias in phenology assessments based on first appearance data of butterflies. Oecologia. doi: 10.1007/s00442-008-0959-4
Van Swaay CAM (1990) An assessment of the changes in butterfly abundance in The Netherlands during the 20th Century. Biol Conserv 52(4):287–302
Van Swaay CAM (2007) Workshop Development of the methodology for a European butterfly indicator. Report VS2007.006, De Vlinderstichting, Wageningen
Van Swaay CAM, Van Strien AJ (2005) Using butterfly monitoring data to develop a European grassland butterfly indicator. In: Kühn E, Thomas JA, Feldmann R, Settele J (eds) Studies on the ecology and conservation of Butterflies in Europe. Vol. 1: general concepts and case studies. Pensoft, Sofia, pp 106–108
Van Swaay CAM, Warren MS (1999) Red data book of European butterflies (Rhopalocera). Nature and Environment, No. 99. Council of Europe, Strasbourg
Van Swaay CAM, Warren MS (eds) (2003) Prime butterfly areas in Europe: priority sites for conservation. National Reference Centre for Agriculture, Nature and Fisheries, Ministry of Agriculture, Nature Management and Fisheries, The Netherlands
Van Swaay CAM, Plate CL, Van Strien A (2002) Monitoring butterflies in the Netherlands: how to get unbiased indices. In: Proc Exper Appl Entomol NEV Amsterdam, vol 13. pp 21–27
Van Swaay CAM, Warren MS, Lois G (2006) Biotope use and trends of European butterflies. J Insect Conserv 10:189–209
WallisDeVries MF, Van Swaay CAM (2006) Global warming and excess nitrogen may induce butterfly decline by microclimatic cooling. Global Change Biology 12(9):1620–1626
Zonneveld C (1991) Estimating death rates from transect counts. Ecol Entomol 16:115–121
Acknowledgements
This paper was written with financial support from EuMon (http://eumon.ckff.si; contr. number 6463; Schmeller et al 2006); and EU FP6 Integrated Project “ALARM” (www.alarmproject.net; GOCE-CT-2003-506675; Settele et al. 2005), two research projects supported by the European Commission under the 6th Framework Programme. The following people gave help and support to develop the European grassland butterfly indicator: David Roy, Tom Brereton, Sergey Popov, Patrick Leopold, Dirk Maes, Constanti Stefanescu, Petra Ramseier, Mikko Kuussaari, Dominique Langlois and Tim Pavlicek. Adriaan Gmelig Meyling helped in producing the supranational indices and the final European Grassland Butterfly Indicator. We also want to thank Pierre-Yves Henry and two other anonymous reviewers for their inspiring comments. Last but not least, Butterfly Monitoring Schemes would never have been possible without the cooperation of hundreds of voluntary recorders all over Europe.
Author information
Authors and Affiliations
Corresponding author
Rights and permissions
About this article
Cite this article
van Swaay, C.A.M., Nowicki, P., Settele, J. et al. Butterfly monitoring in Europe: methods, applications and perspectives. Biodivers Conserv 17, 3455–3469 (2008). https://doi.org/10.1007/s10531-008-9491-4
Received:
Accepted:
Published:
Issue Date:
DOI: https://doi.org/10.1007/s10531-008-9491-4