
Abstract
Immense concern for sustainability and increasing stakeholders’ involvement has sparked tremendous interest towards designing optimal supply chain networks with significant economic, environmental, and social influence. Central to the idea, this study aims to design a closed loop supply chain (CLSC) network for an Indian laptop manufacturer. The network configuration, which involves a manufacturer, suppliers, third party logistics providers (forward and reverse), retailers, customers and a non-government organisation (NGO), is modelled as a mixed integer linear programming problem with fuzzy goals of minimising environmental impact and maximising net profit and social impact, subject to fuzzy demand and capacity constraints. Profit is generated from the sale of primary and secondary laptops, earned tax credits, and revenue sharing with reverse logistics providers. The environmental implications are investigated by measuring the carbon emitted due to activities of manufacturing, assembling, dismantling, fabrication, and transportation. The social dimension is quantified in terms of the number of jobs created, training hours, community service hours, and donations to NGO. The novelty of the model rests on its quantification of the three triple bottom line (TBL) indicators and on its use of AHP–TOPSIS for modelling the multi-criteria perspectives of the stakeholders. Numerical weights for the triple lines of sustainability are utilized. Further, a fuzzy multi-objective programming approach that integrates fuzzy set theory with goal programming techniques is utilised to yield properly efficient solutions to the multi-objective problem and to provide a trade-off set for conflicting objectives. The significance of the CLSC model is empirically established as a decision support tool for improving the TBL performance of a particular Indian laptop manufacturer. Practical and theoretical implications are derived from the result analysis, and a generalised quantitative closed-loop model can be effectively adapted by other electronic manufacturers to increase their competitiveness, profitability, and to improve their TBL.
1 Introduction
Technological advancement has revolutionized the world and has changed our lives for the better but at the cost of damage to the environment and consequently to the society. The rapid sale of electronics in India brings huge profits to the electronics industry, but depletes resources and creates mountains of electronic waste each year. India faces a grave challenge with the reduction of natural resources and the management of excessive e-waste (Wath et al. 2011). Electronic companies are undeniably under immense pressure from government regulations, local authorities, customers, and social organisations to implement value-recovery options and to minimise their carbon footprint (Cruz 2013). Companies, and their internal and external stakeholders, must address sustainability strategically and tactically (Kumar et al. 2012) and create a necessary synergy between people, profit, and planet (Kleindorfer et al. 2005). One fruitful approach is through a closed loop system for handling end-of life (EOL) products (Winkler 2011). A closed loop supply chain (CLSC) facilitates reductions in waste and consumption by implementing EOL strategies, which include reusing, repairing, refurbishing, remanufacturing, and recycling (Rathore et al. 2011). These EOL strategies extend the life cycle of returned products by capturing their residual value; in turn, the environment benefits because fewer resources are used and less waste is created (Millet 2011). The society gains as well, because new job opportunities are created to carry out the reverse activities and competent products are made available at affordable prices (Darbari et al. 2015). Incorporating recovery strategies into the existing supply chain fosters sustainability by meeting present needs and by not compromising opportunities for future development (Cassen 1987). Therefore, a closed loop approach can influence the triple bottom line (TBL) performance of the SC network in terms of economic, environmental, and social/human profits and capital (Elkington 1998).
However, many Indian companies are sceptical towards adopting a closed loop approach because of the practical difficulties involved (Dwivedy and Mittal 2010). An initial problem faced by electronic manufacturers in establishing a CLSC is the immense capital investment and expertise required to manage a formal, regulated network of collection, disassembly, recycling, refurbishment, and resale of EOL products (Wath et al. 2010). The reality is that while companies are motivated to take back returns and are expected to sustainably manage them, most electronic companies outsource product recovery activities to third party reverse logistics providers (3PRLs) (Daghigh et al. 2016). These 3PRLs manage recovery activities only from the economic perspective; their intent is to extract maximum value from returns with minimum cost implications. The repaired units draw significant revenue from the secondary markets, and the rest are given away to informal recyclers, known as ‘rag pickers’ and ‘kabadiwallas’ (Wilson et al. 2006), whose crude methods of recycling have a detrimental impact on the environment. Therefore, despite the presence of a huge market for secondary products, companies are rarely able to capitalise on the economic benefits from the resale of returns. In addition, the entire purpose of managing the returns from the environmental and social perspective becomes futile. Hence, a middle path needs to be established in which companies and 3PRLs concurrently develop a sustainable recovery channel that is mutually beneficial (Wei and Zhao 2013). A collaborative framework with a revenue sharing contract between manufacturers and 3PRLs can provide a path forward (De Giovanni 2014). Secondly, for a successful and sustainable CLSC, the real complexity lies in redesigning the existing SC network so there is a smooth conjunction of the returns flow with the forward channel (Chuang et al. 2014). One of the most promising ways to ensure reuse of recovered materials and components is to collaborate with domestic suppliers who are mutually inclined towards product and component recovery (Hollos et al. 2012). However, a barrier faced by many electronic manufacturers in India is the underdevelopment of the domestic component industry (Ernst 2014). Thirdly, the companies’ efforts towards sustainability are commendable only if they benefit all stakeholders (Hassini et al. 2012), and from the Indian manufacturer’s perspective, it is a difficult task to configure a CLSC network that satisfies all involved stakeholders (Govindan et al. 2016a). These challenges clearly identify the need for TBL-based CLSC planning in the Indian context. Improving on their competitive position and responding to stakeholders requires major strategic initiatives from Indian companies (Altmann 2015). Regrettably, companies tend to neglect the integration of environmental and social sustainability aspects in their networks since it may result in non-optimality (Pishvaee et al. 2014). Since companies are legally bound to disclose their carbon footprint, sustainability efforts are directed towards environmental improvement while social facets are neglected. Few quantitative studies exist on the development of CLSC design models, especially those that can guide manufacturers to assimilate economic, environmental, and social aspects simultaneously. This lack of quantitative studies clearly indicates a scholarly need to expand research in CLSC model evaluations based on the TBL concept.
The above-cited concerns direct us to our current research. It is imperative for electronic companies in India to contemplate the following questions: (a) How should sustainability be integrated into the strategic, tactical, and operational planning of the CLSC? (b) What are the benefits of implementing a sustainable CLSC in India? With these background questions in mind, the present research work aims to develop a decision framework for configuring a CLSC network design for electronic companies that targets TBL through sustainability. Since addressing TBL is a multi-stakeholder task, manufacturers must facilitate an integrated sustainable CLSC with significant contributions from their stakeholders (suppliers, customers, third party logistics providers, regulatory bodies, non-profit organizations, and working staff) to minimise the damaging effects of their actions on the environmental and on social well-being. It can generate more value for the companies in terms of profits and in benefitting their triple bottom line (TBL). Furthermore, to measure the sustainable efficiency of CLSC, it is essential to recognize the level of commitment of the stakeholders and to be aware of the associated potential benefits and risks on the overall SC decisions. This challenge leads to an inquiry of strategic, tactical and operational questions, which must be echoed in the company’s strategic framework of the CLSC network. Additionally, a high degree of ambiguity influences strategic decisions due to the complexity involved in integrating reverse planning decisions, thus affecting the effectiveness of the CLSC network. To address all these challenges, the present study seeks to present a quantitative CLSC model with TBL objectives, which will investigate and reflect upon the following research questions:
-
(1)
How can a CLSC network configuration for managing EOL electronics be environmentally and socially enriched with minimum economic burden?
-
(2)
How can strategic planning be aligned with tactical and operational decision making so that the triple lines of sustainability are enhanced?
-
(3)
How should the right balance among the TBL indicators be measured and achieved in an uncertain environment?
-
(4)
Are the TBL objectives of the CLSC model receptive to the needs of the stakeholders?
Under this research framework, the design and evaluation of CLSC models that can effectively create positive economic, environmental, and social differences, has hardly been explored. Configuring such a sustainable CLSC network for EOL products is a complex task encompassing various infrastructure changes. Predictably, CLSC configuration models addressing all three pillars of sustainability are scarcely found in the literature. A major concern lies in measuring the implementation success of such models. While immense optimisation potential exists, research related to the development of quantitative models for CLSC network design based on the TBL perspective is scant (Brandenburg et al. 2014). In addition, perspectives of the stakeholders are seldom reflected in the potential outcomes. Identifying this gap, the present study develops a multi-criteria based optimization model in line with TBL objectives for end of life/end of use (EOL/EOU) laptops, and this model supports the CLSC network planning decisions of an Indian laptop manufacturer. It is a two-stage model in which the first stage uses hybrid AHP–TOPSIS methodology to determine the importance of the three dimensions of TBL. The stakeholders’ opinions and actions are critical to impact the TBL performance, positively or negatively, so these views must be valued and considered. Hence, we determine the importance of the three goals in light of stakeholders’ needs and visions. In the next stage, the multi-objective model is configured as a fuzzy mixed-integer linear programming problem, which aims at minimising the environmental impact of the CLSC network while simultaneously maximizing its economic productivity and overall social benefit. It is accomplished by integrating the forward and reverse flows effectively and by seeking strategic cooperation of component suppliers, 3PRL, NGO, and government.
The TBL objectives of the CLSC network are investigated as follows:
-
Economic stability is derived from revenue generated from the sale of primary and secondary products, revenue sharing with 3PRL, cost savings in the form of reuse of components, earning of tax credits, and subsidy from the government.
-
The environmental implications of CLSC network are inspected by measuring the carbon emitted due to the operational and logistics activities managed by the company and appropriate vehicle selection.
-
The social dimension in the model includes quantifying social benefits in terms of the number of jobs created for workers and drivers, on-job training hours, community service hours, and donations to non-profit organisations in kind.
The CLSC network is configured as a mixed-integer, linear programming problem with fuzzy goals. Weighted fuzzy goal programming (WFGP) technique is suggested for yielding a range of properly efficient solutions. At its core, the decisions taken include optimal allocation of components to suppliers, optimal amount of returns to be upgraded, refurbished, resold, donated, dismantled or disposed, number of jobs to be created, selection of vehicles for transportation, and calculation of community service and training hours. The contribution of the model is explicitly evident in the quantitative analysis of the CLSC design and in the assessment of trade-offs between the three conflicting goals. Hence, the proposed model can enormously aid decision makers to reflect upon the TBL indicators in a focused and optimised way with regard to the stakeholders’ needs.
A brief description of the research work is as follows. Section 2 presents a broad literature review addressing sustainability issues in SC network models, and Sect. 3 proposes the CLSC network under study. Section 4 reveals the proposed methodology and describes the fuzzy mathematical model under certain assumptions. The WFGP solution approach for solving the fuzzy model is discussed in Sect. 5. In Sect. 6, the effectiveness of the fuzzy model is established by considering a real problem case of an Indian laptop assembler. The results obtained from the case study are discussed further. Section 7 presents the result analysis and interpretation, and based on those findings, Sect. 8 derives the theoretical and practical implications. Lastly, Sect. 9 presents the concluding remarks, deliberates on the limitations, and highlights the future scope of the present study.
2 Literature review
In this section, we present the literature analysis on how sustainability concerns have been modelled in SC and CLSC designs and the multi-criteria optimisation methodologies adopted for their evaluation. The gap related to quantifying TBL aspects in CLSC network design models has been highlighted. Furthermore, the section also demonstrates the significant contributions of the present work.
2.1 Sustainable CLSC design
Comprehensive early reviews, conducted by Rubio et al. (2008) and Ilgin and Gupta (2010) on reverse logistics (RL) and CLSCs, claim that strategic supply chain decisions are mostly economic-driven. Subsequently, legal pressure and stakeholders’ interests have triggered the motivation of the researchers and managers towards sustainability oriented SC decision making (Cruz 2013). Hence, recent studies advocate implementation of sustainability principles in all the SC operations, both forward (Chen and Andresen 2014) and reverse (Govindan et al. 2016b). Consequently, an academic area that has grown remarkably in recent years is research to achieve sustainability through the adoption of a CLSC model (Guide and Van Wassenhove 2009). This model is advantageous in terms of achievement of sustainable goals, as it offers much more potential for improvement in economic, social, as well as environmental competence (Sarkis et al. 2010). Research on model-based sustainable supply chain planning and designing is considered imminent and has shown expanding growth in the last few years, covering viewpoints for pragmatic studies and investigative models (Min and Kim 2012). Brandenburg and Rebs (2015) suggests modelling guidelines for sustainable SC and CLSC design which can be aptly summarised as: (i) The models should ideally quantify the sustainable impact of the design based on all three TBL dimensions; (ii) It is necessary to reflect and analyse upon the interrelationships between the indicators so that all can be optimised to their best potential. Managerial and corporate interest in academic research pertaining to quantification of TBL indicators of CLSCs has risen. However, reviews conducted by Tang and Zhou (2012), Seuring (2013), and Govindan et al. (2015) emphasise that the related research is still dominated by economic and environmental factors, while social criteria remain broadly neglected. Eskandarpour et al. (2015) analysed papers in the field of sustainable SC and CLSC design addressing at least two of the three TBL indicators. Their review indicates that the majority of authors have assessed the environmental impact in terms of the carbon footprint metric of the SC (Jaehn 2016). The carbon footprint implies measuring carbon emissions stemming from various stages of the SC such as transportation (Elhedhli and Merrick 2012), opening facilities (Govindan et al. 2015), production and transaction (Kumar et al. 2017), and recycling and disposal (Chaabane et al. 2012). Sundarakani et al. (2010) provides an effective long-range Lagrangian and Eulerian transport method for carbon footprint measurement of a SC. Social issues pertaining to supply chains have been covered largely in the context of conceptual studies and are mostly comprehended qualitatively. Selecting suitable and measurable social metrics is a challenging task and, as a result, very few studies have quantified the social aspects. The social indicators preferred in recent studies include employment numbers (Santibañez-Aguilar et al. 2014), community development (Pérez-Fortes et al. 2012), loss of working days (Pishvaee et al. 2012), working hours of drivers (Ramos et al. 2014), injury to workers (Boukherroub et al. 2015), and training of staff (Darbari et al. 2015). Although research suggests that sustainable CLSC network design must incorporate all three TBL aspects in the decision process so that economic, environmental, and social performances can be optimised simultaneously, literature surveys demonstrate that most mathematical models focus only on economic and environmental objectives and constraints (see Fahimnia et al. 2013; Chaabane et al. 2012; Amin and Zhang 2013; Accorsi et al. 2015; Talaei et al. 2016). A significant revelation by Gimenez et al. (2012) suggests that while SC assessment does not contribute towards improving the TBL, SC collaboration does assist in enhancing the TBL. Studies on SC collaboration for an amalgamation of the three indicators of sustainability in a CLSC network design are scant, revealing an evident deficit in the literature.
2.2 Fuzzy multi-criteria optimisation approach
A CLSC network design aiming to achieve sustainability targets clearly involves conflicting goals rather than complementary goals; hence, most researchers advocate its configuration as a multi-objective problem (see Pérez-Fortes et al. 2012; Soysal et al. 2014; Govindan et al. 2014; Jindal and Sangwan 2017; Shi et al. 2017). Multi-criteria optimisation techniques are identified as efficient solution methodologies for the evaluation of multi-objective programming problems because of the immense optimisation potential they offer (Govindan et al. 2015). The efficiency of the methods can be extremely productive, particularly in decision-making involving multi-dimensionality of the sustainability goals (Wang et al. 2009). MCDM methods are extremely useful in situations where collective decision analysis is needed, especially if the conflicts among the collective actors need to expressed as weights and utilized for modelling their conflicts (Dehghanian and Mansour 2009; Shokohyar and Mansour 2013). With this perspective, the novel modelling approach utilised in our paper is based on AHP–TOPSIS technique used for measuring the judgments of the stakeholders and suitably reflecting their preferences as weights for the TBL objectives. Although the effectiveness of multi-criteria optimisation techniques in achieving trade-offs between different sustainability parameters is credible, in many real world cases decision-making environments may involve uncertainty related to data (Selim and Ozkarahan 2008). Subjectivity of the decision makers in terms of target values of the objectives and flexibility in the constraints may lead to ambiguity (Mousazadeh et al. 2014). In real parameter settings, the CLSC network design problem may become non-optimal owing to additional decision variables (Pishvaee et al. 2014) and the design of the network may get affected by changing values of various parameters (Pishvaee and Razmi 2012). In such scenarios, a non-deterministic approach, such as fuzzy programming integrated with MCDM approach, proves to be highly efficient (Erol et al. 2011). Hence, fuzzy optimization approach has been adopted by many researchers in modelling multi-objective sustainable SC models (Özkır and Başlıgil 2013; Jindal and Sangwan 2017).
2.3 Research gap and contribution of the study
It is evident from the above discussion that a wealth of research has been conducted by academicians worldwide on incorporating sustainability aspects in SC and CLSC planning and on generating solutions for managing these effectively. The literature analysis, however, highlights that there is a distinct scarcity of integrated optimization models that incorporate the three dimensions of sustainability. Most sustainable CLSC models have considered optimising economic and environmental performance as their primary objectives and have neglected optimising social impacts. Maximisation of the social impact significantly interferes with the economic viability of the SC network. In most papers, social influence is typically added as an extra constraint or as a penalty cost. It is also emphasised that integration of fuzzy set theory in multi-criteria decision-making aids in evaluating CLSC, because CLSCs generally function under uncertain environments. Through our literature survey, we have identified recent studies on model-based CLSC designs that optimise all three TBL objectives. Table 1 categorises these studies based on sustainability metrics, type of network, multi-criteria optimisation approach, and outputs of the multi-objective models.
An analysis of Table 1 identifies the following gaps in research areas of multi-objective model-based sustainable CLSC design:
-
Industry-based specific studies that focus on integrating sustainability requirements, along with operational and tactical planning in CLSC designing, are rare. Out of the papers listed in Table 1, only Devika et al. (2014), Pishvaee et al. (2014), Mota et al. (2015), and Govindan et al. (2016a) have dealt with real case studies and unfolded the sustainable integration of forward and reverse activities for EOL products while simultaneously optimising network efficiency and the sustainable performance outcomes. Devika et al. (2014) aims at redesigning the SC network configuration of an Iranian glass producer to cater effectively to the increasing customer demand. Pishvaee et al. (2014) focusses on the designing aspect, based on the selection of best end-of-life options for used medical and syringe needles, so economic, environmental, and social performances are improved. The case study of a Portugal battery producer is motivated by customer response (Mota et al. 2015). Govindan et al. (2016a) focusses on a network design problem to determine how recovery of EOL electrical products can aid in improving sustainability in the manufacturing process in the Indian context. Our work is distinguishable from these four mentioned studies because it is motivated by an Indian manufacturer case study driven by stakeholders’ interest for redesigning the supply chain to manage EOL laptops.
-
Sustainable CLSC design models must be capable of integrating the vital triggers of sustainability with regard to stakeholders and of evaluating their impact on the supply chain (Seuring and Müller 2008). However, none of the reviewed papers offers a quantitative analysis of how the stakeholders impact the sustainable performance of the CLSC design. Our proposed CLSC model, designed to incorporate significant contributions of the stakeholders (including customers, workers, 3PRLs, suppliers, NGO, and government) addresses this gap.
-
There is a significant lack of optimisation models in CLSC decision planning that address uncertainty. In this research, we have used fuzzy set theory to cope with uncertainty in the decision-making environment. Fuzzy goal programming (FGP) is applied to provide flexibility to the DMs in terms of the aspiration and tolerance values of the fuzzy goals and constraints.
-
No study evaluates the TBL performance of the CLSC network in a fuzzy multi-criteria framework. One of the recent papers by Zhalechian et al. (2016) does consider objectives in the TBL setting under uncertainty, but it does not evaluate the weights of importance of the TBL objectives in a multi-criteria framework, as done in the present study. In the present work, AHP–TOPSIS is employed for representing the tangible and intangible needs of the stakeholders as weights for the TBL objectives, and FGP is further utilised for optimising the TBL performance of the CLSC network.
Pointedly, the above-mentioned gaps mark the necessity of this paper. Therefore, the fuzzy multi-objective, mixed-integer linear programming model developed in this paper considers the optimisation of a sustainable closed loop network configuration for an Indian laptop manufacturer in a multi-criteria decision space. The contribution and novelty of the paper can be summarised as follows:
-
The CLSC model designed allows for strategic involvement of stakeholders, integrates flow allocation and transportation decisions, and improves upon all three dimensions of sustainability.
-
A new social objective function is defined that examines job opportunities for workers and drivers, employee training, community service hours, and donations to NGO.
-
Uncertainty through fuzzy goals and constraints is modelled to enable decision-making in a flexible environment.
-
An integrated AHP–TOPSIS technique is utilised for quantitatively calculating the influence of stakeholders as AHP–TOPSIS weights for the three TBL objectives.
-
The solution approach effectively incorporates the AHP–TOPSIS weights in the optimisation model and uses the weighted FGP approach for solving the multi-objective model and providing a meaningful trade-off set to DMs for resolving conflict among the goals.
-
The proposed model validates a real life case study of an Indian laptop manufacturer.
3 Proposed CLSC network
The problem addressed by the present study is of an Indian laptop manufacturing company that seeks to integrate its forward and reverse flows for sustainably managing returns. The company wishes the desired network to achieve minimum environmental dilapidation and maximum economic and social gains. Hence, the designing of the network largely depends upon the strategic and tactical decisions taken after due deliberation among all stakeholders of the company.
The laptop assembly is composed of sub-assemblies, and each sub-assembly component performs a specific function. The main components considered are (1) CPU, (2) RAM, (3) HDD, (4) LCD, (5) Motherboard, (6) DVD drive, (7) Battery, (8) Power supply, (9) Main body, and (10) Keyboard. The manufacturer has collaborated with domestic suppliers to procure components (1–5). Because the manufacturer has large quantity orders, components are designed per company specifications, and a minimum threshold order must be made for an active collaboration. Together with the collaborative suppliers, the company intends to look for innovative technologies to ensure that ‘eco-friendly components’ are manufactured to improve their product quality and brand image. Another form of collaboration exists with the third party forward logistics provider (3PFLP). The manufacturer assembles the products and sells them through the 3PFLP, who is responsible for warehousing and distribution of products through a chain of distributors to the customers.

Proposed CLSC network
Figure 1 illustrates the forward and reverse parts of the CLSC network. The forward part consists of component suppliers (CS) which includes regular suppliers and collaborative suppliers, an assembly centre (AC), hybrid distribution/collection centres (DCC), and a primary market (PM). One DCC is selected to function as a warehouse distribution centre (WDC) to store inventories of all DCCs. The laptops are assembled at the AC and sent to the WDC as per the consolidated demand of the customers and from where the units are distributed to DCCs. The company bears the cost of transporting units from AC to WDC and the distribution of units among DCCs is financially taken care of by the 3PFLP. The service centre (not shown in Fig. 1) is owned by the 3PFLP but is jointly managed by the 3PFLP staff and the company. It caters to the queries of the customers redirected by the DCCs, which generally include replacement of faulty components of products under warranty.
In addition to the assembly of new units, the company plans to establish a sustainable reverse supply chain network to take full responsibility for laptops returned by customers at the end of utility. Employing sound recovery options, such as repairing, refurbishing, and remanufacturing, not only increases the lifespan of laptops but also retrieves value from discarded units (Kuehr 2003). The process of recycling can be considered as the last viable option after exercising the above strategies. Due to lack of experience and expertise, the company plans to coordinate the RL network with a third party reverse logistics provider (3PRLP). Hereafter, the company refers to “company and 3PRLP together.”
The reverse part of the CLSC network consists of a dismantling centre (DMC) and a component fabrication centre (CFC). The collection portion of the hybrid distribution/collection centre (DCC) occupies a fraction of space designated for the collection of returned laptops. In addition, there is a secondary market (SM), a scrap facility (SF), and Non-Government Organisation (NGO). The various recovery processes to be carried out, and the role of the NGO, are detailed below:
3.1 Recovery processes
3.1.1 Collection and inspection
Reverse flow begins with the arrival of used and discarded laptops at distribution centres (DCs). An initial inspection process occurs to assess basic product information: year of manufacture, working state of the equipment, extent and scope of recovery/reuse. Accordingly, a buyback cost is determined and paid to the customer. The returned laptops are then consolidated and transported to the WDC, where the company’s inspection team completes another level of inspection.
3.1.2 Categorisation of returns
At WDC, the inspected units are first sorted into two categories: ‘in working condition’ and “not in working condition.” The units in working condition are further categorized as “compatible with market” or “not compatible with market.” Compatible with market implies they have a demand in the PM (with upgradation) or demand in the SM (with light refurbishing and without upgradation). The equipment is upgraded only if the net resale value (NRV) after upgradation is positive (\(\hbox {NRV}\,=\,\hbox {revenue at PM}\hbox { cost of upgradation }\hbox {buyback cost}\)). The working units that are not compatible with market are donated to NGOs. Those units not in working condition are to be either refurbished and sold in SM if NRV(\(=\,\hbox {revenue at SM} \hbox { cost of refurbishment }\hbox {buyback cost}\)) is positive, or they are disassembled if it can be done without further deterioration of the components, or the units are sent to scrap yard for recovery of materials and safe disposal.
3.1.3 Value added recovery strategies
The process of upgradation, and disassembly of products is conducted at the DMC, and the refurbishing of components is done at the CFC. The refurbishing process returns the used product into a working and saleable state by replacement or repairing of faulty components (if any), cleaning, and testing. Upgrading involves restoring the product to the new product quality and technological specifications so that they can be sold in the PM. The process of disassembling is done manually to separate the major components, which are further refurbished at CFC (if required), cleaned, tested, and finally catalogued. The faulty components that are not reusable or refurbishable are sent to the scrap facility. Refurbishing of components transforms them to nearly new specifications. The refurbished components are subsequently used for repairing of laptops at DMC and service centre and rest are sold at the SM. At the SF, recyclers extract precious metals and materials from the components and the waste goes to the landfill.
3.1.4 Management of the RL processes
The company, in collaboration with 3PRLP, manages these recovery processes. An in-house fleet of trucks (owned by 3PRLP) does the associated transportation between the main DC and DMC. The laptops to be sold at SM are collected by their agents, and the laptops and components to be used at the SC are also collected. In addition to a fixed number of staff employed at DMC and CFC for carrying the usual daily activities, more staff is employed for carrying specific recovery process as per the number of units to be processed.
3.1.5 Role of NGO
The NGO also has a significant role in providing a suitable channel for the company to carry forward its sustainability initiatives. The company in pursuit of creating a positive social influence on the local community from which it operates has initiated its own corporate social responsibility project. The CSR project is an initiative started by the company together with an NGO working for underprivileged members of the society; their goal is to provide opportunities for local community development. Through the project, the company aims to provide employment to an underprivileged section of the society (such as the ‘kabadiwallas’ or rag pickers) and to offer training skills to the staff to enhance their technological capabilities and work towards community development.
The primary aim of the study is to bring forth a CLSC network for product recovery, designed to meet the research objective mentioned in Sect. 1. The assessment of the network based on the three aspects of TBL is done as described below:
Economic sustainability is reflected through the net revenue generated from the CLSC configuration. It can be improved by finding the optimal number of laptops to be assembled, new components to be procured for assembly, staff to be employed, and by reaping maximum benefits from the alliance with 3PRL for managing the laptops returned by the customers.
Environmental sustainability can be realized by minimising the negative environmental impacts of operational activities (manufacturing, assembling, dismantling and fabrication) and of logistics activities (distribution and collection). This goal can be achieved by competently utilising the expertise of component suppliers, 3PL and 3PRL.
Social sustainability may be attained through creating a positive social influence on society, accomplished by creating new jobs, training the employees (utilising training subsidies offered by the government), providing dedicated hours of community service, and donating laptops.
The research work therefore intends for a CLSC network configuration that can enable environmental and societal developments at minimum economic liabilities. To determine a satisfactory CLSC configuration, relevant decisions include the number of laptops to assemble and sell, the amount of components to source, how many skilled technicians to hire, the number of returns to be resold, dismantled, or donated, and how to select vehicles. Further, a trade-off between the three performance indicators of sustainability is desirable.
4 Proposed methodology
The theoretical novelty of the model developed in this study is the integration of multi-criteria decision-making methods with fuzzy programming tools for achieving the aforementioned research goals. The methodology is briefly mentioned below:
-
A hybrid AHP–TOPSIS technique (presented in Sect. 4.1) is used for determining the relative importance weights for the three dimensions of TBL based on sustainable criteria. The numerical weights are derived based on the preferences of the DMs among the TBL indicators.
-
The proposed CLSC network design configuration is formulated as a fuzzy mixed-integer linear programming optimisation model. The objectives of the fuzzy model presented in Sect. 4.2 are to: (1) maximise profit, (2) minimise carbon emissions, and (3) maximise the social benefits.
-
A FWGP solution approach (detailed in Sect. 5) is utilised for generating properly efficient solutions to the fuzzy problem. The DMs can choose the most satisfactory solution which best achieves the desirable trade-off between the three objectives.
4.1 AHP–TOPSIS
Organisations can utilize MCDM methods to bring consensus among the stakeholders so that they agree on options best for everyone and make rational decisions; their goals are affected by both quantitative and qualitative factors (Zavadskas and Turskis 2011). For making such complex real world decisions, the application of combined MCDM methods outweighs the use of single MCDM methods by addressing limitations and utilizing strengths of two or more methods (Velasquez and Hester 2013). In this study, we combine the efficiencies of AHP and TOPSIS for evaluation of weights for the sustainability goals. AHP and TOPSIS as a combined MCDM method has been widely used in many areas of supply chain management and logistics (Önüt and Soner 2008).
AHP (Analytic Hierarchical Process) is one of the most popular methods in multi-criteria group decision making. It facilitates ranking of alternatives by interpreting decision makers’ perspectives in terms of pair-wise comparisons of alternatives. It is scalable, keeps consistency among judgments, and decomposes the problems into hierarchical levels for ease of use. The special property of TOPSIS (Technique for order preference by similarity to an ideal solution) is that it allows the choice of an alternative at minimum distance from the ideal solution and maximum distance from the negative ideal solution. This property makes TOPSIS ideally suited in multi-dimensional computing space involving both maximisation criteria as well as minimisation criteria (Qin et al. 2008).
The first step of the integrated AHP–TOPSIS technique (illustrated by Fig. 2) entails aggregating a number of tangible and intangible criteria based on which the weights for the TBL objectives are to be measured. Stakeholders should proactively contribute towards the TBL enhancement of the SC network, because manufacturers alone cannot improve upon their performance dimensions of TBL. Therefore, a core group of DMs was chosen for representing the voice of the stakeholders. To maintain parity in the decision-making, the heterogeneous group includes (1) experienced SC managers of the departments of purchasing, manufacturing, marketing, operations, quality control, sales and performance (each with at least 10 years of experience); (2) head of the employee union; (3) two environmental experts having experience in e-waste management; (4) third party regional manager; (5) local municipal corporate official; (6) NGO worker who has been actively involved with informal recyclers in NCR; (7) two academicians working in the area of sustainable SC management. Various tangible and intangible criteria were identified from the literature (see Govindan et al. 2013; Erol et al. 2011; Nikolaou et al. 2013), and based on the opinions of the DMs. The following 11sustainable criteria were selected: Use of recycled material (C1), Effective transportation network (C2), Green practices (C3), Health and safety (C4), Minimum wastage (C5), Effectiveness of RL network (C6), Adherence to legal norms (C7), Training and education to employees (C8), Clean and upgraded technology (C9), Contribution to revenue (C10), and Establishment of new employment opportunities (C11).

Hierarchical structure for AHP–TOPSIS
In order to determine the relative importance of the eleven criteria, AHP is utilised for measuring each stakeholder’s linguistic pair-wise preferences of the criteria using a nine-point scale (Saaty 2008). Table 2 shows the criteria weighting vector v. Next, using AHP again, 11 pair-wise comparison matrices are constructed for determining the relative importance of economic, environmental, and social objectives for each criterion. This results in 11 normalised columns \(u_{i}=(u_{i1},u_{i2},u_{i3})^{t}.\) of the initial decision matrix (IDM) of TOPSIS. For instance, the pair-wise comparison of the three objectives with regard to the fifth criteria C5 (Minimum wastage) and the generated priority vector \(u_{5}\) is demonstrated by Table 3. The row vector \(v^{t}\) and column vectors \(u_{i} (i\,=\,1{-}11)\) are utilised for generating the IDM, as shown in Table 4.
The final step involves allocation of weights \(w_{j } (j=1,2,3)\) to the sustainability goals using TOPSIS. The underlying algorithm used is presented in Appendix A. The output of the AHP–TOPSIS methodology is the normalised weights of the goals as shown in Table 5, which are used as inputs in the fuzzy mathematical formulation configured in the next section.
4.2 Fuzzy mathematical formulation
The CLSC network configuration proposed in Sect. 3 is mathematically formulated under the following assumptions and the notations provided in Table 6.
Assumptions:
-
1.
The number, locations, and capacities of all facilities are known a priori.
-
2.
The demands of primary and secondary products and components are deterministic and shortages are not allowed.
-
3.
The refurbishing/upgrading cost of the component recovered from the disassembly process is less than buying a new component.
-
4.
Carbon emissions from manufacturing, assembly, disposal and transportation are known.
-
5.
Transportation cost for collection of returns is not considered as it is assumed that trucks used for forward flow WDC to DCs will carry the returns back.
-
6.
Vehicle capacities and routes for distribution and collection are predefined.
The objectives are fuzzy in nature to provide flexibility to the DMs. It is required to understand from the DMs which constraints can incorporate flexibility. The experts identified that there was some scope of adjustment in the demand and capacity constraints. The “\(\cong \)” sign with a tilde (\(\sim \)) in the equations represent fuzziness in the goals and constraints. The Fuzzy Multi-Objective Model (FMOM) is developed as a fuzzy mixed integer linear programming problem (P1) as shown below:
4.2.1 Economic objective

The economic objective function of (P1) maximises the total profit earned from the CLSC network. That profit derives from [{sale of laptops at primary market, from revenue generated under collaboration with 3PRL from the returns} and {through earning of tax credits for donation}] minus the cost of forward operations [{procurement cost of components, assembly cost and packaging cost}and RL operating costs under collaboration {dismantling cost, component fabrication cost} and {transportation cost}] minus the [{salary cost due to fixed number of jobs at AC, MC, DMC, CFC, DC} and{cost due to skilled jobs and training at MC, DMC, CFC}].
4.2.2 Environmental objective
The environmental objective minimises the environmental impact (in terms of carbon emissions) of the network due to {component manufacturing, product assembly, product dismantling, component fabrication} and {transportation of products}.
4.2.3 Social objective
The social objective aims to maximise the social impact of the CLSC network measured in terms of {number of fixed jobs at AC, DMC, DC and number of variable jobs at AC, DMC, CFC, DC (for inspection and testing of returns)} and {training hours for skilled staff at AC, DMC, CFC}and {hours dedicated for community service at AC, DMC} and number of drivers hired for transportation and number of products donated to NGOs.
Forward flow constraints
Constraint (3) calculates the units of laptops assembled at AC. Constraint (4) calculates the total number of components required for assembly. Constraint (5) determines the number of components to be procured from regular suppliers. Constraints (6)–(8) ensure the amount procured from collaborative suppliers does not exceed his capacity to deliver and a minimum amount must be ordered for an active collaboration. Constraints (9) and (10) find the number of units to be delivered at the main WDC (upgraded units are also delivered) and other DCs respectively.
Reverse flow constraints


Constraint (11) reflects that the number of laptops returned at each DC as a fraction of the demand. Constraints (12) and (13) determine the number of laptops in working/not working condition, respectively. Constraints (14)–(19) represent the amount of units that can be upgraded, sold to SM, donated to NGO, repaired, disassembled, or sent to the scrap yard, respectively. Constraints (20)–(23) determine the units of components that can be refurbished, used for repairing the products at DMC, sold at SM, and sent to scrap yard respectively.
Job constraints
The following equations aid in determining the number of variable jobs and training hours, based on the number of units to be processed at AC, DMC, and CFC:
Constraints (24)–(26) determine the kth break in which the number of units at AC falls.
Constraints (27)–(29) determine the kth break in which the number of units at DMC falls.


Constraints (30)–(32) determine the kth break in which the number of units at CFC falls.
Transportation constraints
Constraints (33) and (34) ensure the selection of a single truck with optimum capacity to carry the units from AC to WDC. The selection of trucks of suitable capacities for transporting units from WDC to DCs along pre-designated routes is done with the aid of constraint (35). Constraint (36) ensures minimum capacity utilisation of the truck, while constraint (37) reflects the selection of the emission rate of the trucks selected for each route.
Fuzzy demand and capacity constraints

Fuzziness in the above constraints allows for the consideration of uncertainty regarding the demand and capacity values.
Demand at each DC must be satisfied (within the permissible tolerance limit) as forced by constraints (38) and (39), while constraints (40) and (41) reflect the fuzzy capacity binding constraints for DCs. Constraint (42) ensures that the total units of products to be assembled is essentially less than the capacity of AC. Constraints (43) and (44) make sure that the number of laptops to be collected at DC and processed at DMC do not exceed their capacities (beyond the permissible tolerance limit), respectively. Constraint (45) ensures that the number of components which can be refurbished at CFC is less than its capacity.
Binary and non-negativity restrictions

Finally, constraints (46) and (47) impose the non-negativity and binary restrictions on the decision variables.
5 Fuzzy goal programming solution algorithm
In the present study, the TBL performance of the proposed CLSC network is to be evaluated as per the DMs’ requirements. DMs can approve or disapprove on many accounts while performing a trade-off between the TBL goals due to conflicts of interest. In addition, incorporating RL activities in the existing SC network can create uncertainty in the demand as well as the capacity of existing facilities. Hence, as a solution approach, fuzzy programming is ideally suited because it allows flexibility in the target values for the goals and in the constraints (which need not be binding) by treating them as fuzzy goals and fuzzy constraints respectively (Zimmermann 1978). Both fuzzy goals and fuzzy constraints are handled similarly as fuzzy criteria and converted into crisp form by defining appropriate membership functions (Bellman and Zadeh 1970). To provide flexibility, we introduce tolerance values in the fuzzy demand and capacity constraints. Flexibility in the goals is handled by identification of aspiration and tolerance values from the pay-off table generated by solving the deterministic single objective models. This pay-off table may have weakly efficient solutions but nonetheless it can aid the DMs to adjust the target values of the fuzzy goals explicitly. Here, we define fuzzy linear membership functions to normalise the fuzzy criteria and to introduce the variable \(\lambda \), which lies in [0, 1]. This represents the degree of satisfaction of each fuzzy criteria measured in terms of the attained value of the membership functions. The multi-objective problem is therefore reduced to maximisation of the degree of satisfaction for simultaneously achieving the global satisfaction of the model.
Other studies who have used this approach in optimising sustainable SC networks are Pinto-Varela et al. (2011) and Pishvaee and Razmi (2012). However, the advantage of the solution approach adopted in this study, over the fuzzy programming approaches utilised in previous studies, lies in the following three benefits:
-
(1)
This solution introduces deviational variables into the fuzzy model and utilises weighted FGP for minimising the under-achievement of targets for the TBL goals. The benefit of FGP is attainment of optimum solution in the feasible space with a desired satisfaction level (Rubin and Narasimhan 1984).
-
(2)
Weights for the fuzzy TBL objectives are determined through an exhaustive AHP–TOPSIS integrated MCDM methodology.
-
(3)
Whole ranges of properly efficient solutions are generated by choosing various combinations of satisfaction levels of the trade-off set. The advantage is that we present a suitable representation of the whole parent efficient frontier to the DMs and they can confidently select the final preferred solution from the comprehensive available trade-off set and Pareto optimal values. Therefore, it can be concluded that the WFGP approach utilised in the study is suitably efficient to deal with the complexities of the proposed multi-objective model.
The solution algorithm for converting the fuzzy multi-objective model defined in Sect. 4.2 to the equivalent crisp model is explained below (see Narasimhan 1980; Mohamed 1997; Tiwari et al. 1987).
Suppose there are m fuzzy criteria and the kth fuzzy criteria is \(f_k (X)\tilde{\ge }b_k \) or \(f_k (X)\tilde{\le }b_k \) where \(b_{k}\) is the vague aspiration value.
-
1.
For the fuzzy demand and capacity constraint, \(b_{k} -p_{k},\) the tolerance level is specified by the DM.
-
2.
The aspiration and tolerance values for the three fuzzy objectives are calculated using the optimistic (best) and pessimistic (worst) values obtained after solving the three single objective problems. Optimistic values generate the aspiration levels while the difference between the optimistic and pessimistic values defines the tolerance level.
-
3.
Using the aspiration and tolerance values, define the membership functions as follows:
Or
-
4.
Transform problem (P1) into the following single objective problem (P2):

where \(\hbox {S}\) is the set of feasible solution space determined by the rigid constraints and non-negativity restrictions and \(k=1,2,3\) correspond to the fuzzy goals.
\(\lambda =\mu _D (X)\in \left[ {0,1} \right] \) represents the degree of satisfaction of DM, and \(\mu _{D} {\hbox {X}}= \min \left\{ {\mu _{f_1 } \hbox {(X)}, \mu _{f_2 } \hbox {(X)},\ldots ,\mu _{f_K } \hbox {(X)}} \right\} \) (intersection of the fuzzy sets).
-
5.
Reformulate the problem (P2) as a FGP problem (P3) by introducing positive and negative deviational variables \(\eta _k \;\hbox {and}\;\rho _k \;(k=1,2,3)\)as shown below:

In the present study, the deviational variables are considered only in the fuzzy goals. The weights \(w_{i (i=1.2.3)}\) are the AHP–TOPSIS weights obtained in Sect. 4.1.
-
6.
Obtain the optimal solution of the single objective problem (P3) which is properly efficient solution of the fuzzy problem (P1).
6 Numerical illustration
The present work designs and optimizes a sustainable CLSC network for a laptop manufacturer based in Delhi, India. For the purpose, a closed loop network design is configured in Sect. 3 and illustrated by Fig. 3. Subsequently, the configuration is formulated as a fuzzy optimization model in Sect. 5. In this section, an example problem from the case study is derived for validation of the proposed fuzzy mathematical model. The parametric values of the mathematical model are derived using the following information provided by the company.
6.1 Forward part of the CLSC network
The forward network of the company has an assembly plant (AC) in Rohtak, where the laptops are assembled. The laptops are then sent to the main DC (WDC) situated at Dwarka (DC1) and further sent to other DCs. The distribution network of the company entails three zones consisting of 10 DCs. These zones include the following sites: Zone 1: Vikaspuri (DC2), Mayapuri (DC3), Pitampura (DC4); Zone 2: Vasundhara Enclave (DC5), Shahdara (DC6), Timarpur (DC7); and Zone 3: Mahipalpur (DC8), Mehrauli (DC9), East of Kailash (DC10). All sites are shown in Fig. 3. These DCs cater to the demand of the primary market (PM).
For the example problem, we have considered two variants of laptops. The manufacturer assembles the laptops procuring sub-assemblies from suppliers. For improving customer satisfaction and enhancing their corporate image, the manufacturer has collaborated with domestic suppliers to procure some of the components as per the company’s sustainability requirements. Table 7 gives details of the sub-assemblies procured under collaboration or not. The utilisation rate of components in each variant of laptop is 1.

Multi-echelon CLSC network
The number of components to be ordered depends upon the number of laptops to be assembled, which, correspondingly, depends upon the consolidated demands and capacities of the DCs and capacity of the AC. The demand must be satisfied while the capacity must not be exceeded. Table 8 presents the corresponding demand and capacities of DCs (with permissible tolerance values of 10 units and 20 units, respectively). The capacity of AC is 3000 (\(+\,200\)) units. However, the components ordered must not exceed the capacity of the supplier, which is given to be 3000 units. In addition, a minimum order of 800 units must be placed with a collaborative supplier.
The assembled laptops are transported from AC to WDC first and then from WDC to the three zones. The laptops are transported along predetermined routes in each zone as follows: Zone 1: DC1–DC2–DC3–DC4–DC1; Zone 2: DC1–DC5–DC6–DC7–DC1; Zone 3: DC1–DC8–DC9–DC10–DC1. There are three trucks available each for forward flow with variable capacities and emission rates. The capacities, costs, and emission rates of the available trucks are tabulated in Table 9.
In addition to transportation cost, the other costs associated with the forward network include assembly cost, packaging cost, component procurement cost, salary cost, and training cost. The details of cost of operations at AC and corresponding emission rates are provided in Table 10. Table 11 gives details of the procurement cost and emission rates for manufacturing components under collaboration. The emission rates are derived from Mishima and Mishima (2011).
The company hires two types of employees: fixed staff for managing the basic operations and daily chores at AC and skilled staff for carrying the technical operation of assembly. Salaries paid to the fixed and skilled staff vary; the skilled staff member is employed for his expertise in handling the specific operation. The company utilises a government subsidy for training the staff. The requirement for a skilled job is calculated on the assumption that 10 technicians are hired for assembling 500 laptops at AC. The fixed jobs at AC are created as per a fixed percentage of the capacity of the facility, which is taken as 2%. A skilled staff member at AC earns INR 5000, whereas a fixed staff member earns INR 2000. The cost of training a skilled staff at AC is INR 5000 and the number of hours of training is 20. In continuing its effort to be socially inclusive, the company has initiated a community development programme whereby the staff members are involved in dedicating a few hours of their service for community work. The number of community hours at DC and AC is calculated as 5% of the demand at DC and 3% of the capacity of AC. Profit in the forward flow comes from selling the new assembled laptops in the primary market, which are sold at INR 55,000 and INR 45,000. The percentage of subsidy earned from the government for training employees is 25%.
6.2 Reverse part of the CLSC network
The multi-echelon reverse network as demonstrated in Fig. 3 consists of: (1) DCs where the returns are collected from the primary customers, (2) a hybrid DMC-CFC-situated at Bawana for managing the processes of dismantling and component fabrication, (3) secondary market (SM) situated at Nehru Place, (4) scrap facility (SF) operated by official recyclers, and (5) NGO (anonymity is maintained).
The number of returns collected at DCs is assumed to be a fixed percentage \(\gamma _l \) of the demand at the lthDC. The values are 0.5, 0.45, 0.44, 0.4, 0.45, 0.42, 0.43, 0.5, 0.45, and 0.5. After initial inspection, buyback cost is determined based on a product’s categorisation. At the first step, the returns are classified into two categories: working and non-working. Second, the working units compatible with the current market trends are resold either at the PM with upgradation or at SM with refurbishing. The rest are donated. Donating laptops through NGOs earns profit in terms of tax credits from the government. The non-working laptops are further categorized into three categories, including those that: (a) can be repaired and put into a working state with little cost and resold at SM; (b) are obsolete with no resale value but can be dismantled for potentially reusable components; and (c) will deteriorate further with dismantling and are sent to scrap yard. The remaining returns are collected by a recycling agent (after paying a minimal amount) for disposal. All the reverse logistics operations are carried under the stipulated environment laws (CPCB 2014). The categorisation of returns is pictorially depicted in Fig. 4. The number of returns to be processed in each category is assumed to be a fixed percentage of the number of returns. The corresponding percentage value, buyback cost, processing cost, and profit earned are given in Table 12.

Categorisation of returns
It is assumed that upgradation, refurbishment, repair and dismantling are done manually and therefore the carbon emission due to these activities is considered negligible. The per unit carbon emission rates (in gm) for disposal are taken as 3 and 2.8 (Mishima and Mishima 2011).
The process of value recovery in form of components is pursued at DMC where the returns are dismantled. The retrieved components are refurbished (if required) at CFC and either reused for refurbishment/repair of laptops at DMC and service centre or are sold at SM. Faulty components are discarded. The amount of components that are retrieved to be refurbished is assumed to be a fixed percentage. The rest are sent to the scrap facility. 50% of the refurbished components are used for repairing of the products and rest are sold at SM. The capacities of CFC and DMC are 2000 (+ 50) and 1500 (+ 100) units respectively. Table 13 gives details of the data related to components regarding the percentages, associated costs, carbon emission rates, and revenue generated.
The DMC and CFC are managed by skilled staff and fixed staff. It is assumed that 5 skilled technicians are needed for retrieving 200 components, and the component fabrication of 200 units also requires 5 technicians. The salary paid to a skilled technician at DMC and CFC is INR 3000. The number of fixed jobs created is assumed to be a fixed percentage of the capacities of DMC and CFC. These are calculated as 7% of 1500 (+100) and 5% of 2000 (+50), respectively. The fixed salary amount is INR 2000. The hours of skilled training for the technician at DMC and CFC are 30 and 20 respectively. 5% of the capacity of DMC generates the number of hours dedicated for community service at DMC. The transportation of the returns across the echelons of the reverse network is outsourced to 3PRLP at a fixed amount. Therefore, the corresponding amounts and the carbon emission generated are not considered in the mathematical model.
7 Result analysis and interpretation
7.1 Result
The above data is utilised for solving the proposed fuzzy mathematical model. The tolerance limits for the fuzzy demand and capacity constraints have been provided in the data. The aspiration and tolerance values for the demand and capacity values result in two scenarios. The following result is generated utilising the solution approach outlined in Sect. 5:
7.1.1 Obtaining optimistic and pessimistic values for fuzzy objectives
For doing so, initially three crisp single objective problems for the two scenarios are solved using LINGO code. The other two objectives’ values are also determined for each problem. Table 14 shows the three optimal solutions generated. The best and worst values of the three objectives are highlighted.
The best values can be taken as the aspiration values and the difference between the best and worst gives the tolerance value. Subsequently, appropriate membership functions (as explained in Sect. 5) are defined for the fuzzy criteria. The solutions obtained above highlight the conflicting nature of the objectives as well, as explained below.
Comparing values of the objectives in Table 14, it is apparent that the payoffs needed for environmental savings do have a substantial bearing on the economic and social performance. However, achieving the social objective does not preclude financial gains but does negatively affect the environmental goal. The objective of maximising profit has a tendency towards choosing the smallest number of vehicles required. Because these vehicles cost less, they may have higher emission rates, so the flow of products is higher across the network. On the other hand, for minimising carbon emissions, the model chooses to process fewer products and components and to choose vehicles with higher emission, resulting in a negative impact on the profit and the social benefits. Optimising the social objective enforces an increase in the number of laptops and components to be processed so that maximum jobs are created; this decision, in effect, reduces impacts on the environmental performance, so these choices present a dilemma for the DMs. A compromise between the objectives must be attained with the aim to generate a profound impact along all three TBL performance dimensions. Henceforth, the suitability of the proposed FMOM (P1) lies in obtaining a preferred compromise solution under the competing nature of the fuzzy goals and fuzzy constraints.
7.1.2 Obtaining properly efficient solutions for FMOM
To solve the problem (P1), the fuzzy solution algorithm provided in Sect. 5 is applied. Accordingly, (P1) is first transformed into the equivalent FGP problem (P3). In order to reach meaningful insights into the decision making process, we attempted to generate a range of lower and upper limits [\(f_k^0 ,f_k^{*} \)] for the kth fuzzy objective, and (P3) is solved for each interval of the range set using LINGO 11.0. The results justify the application of fuzzy programming for finding a trade-off between the conflicting objectives as per the DM’s satisfaction. This can be used as quantitative indicators for highlighting the efforts of the company towards their TBL performance. Based on the company’s strategic vision, the DMs can choose the most satisfactory solution from among the properly efficient solutions presented in Table 15.
7.2 Result analysis
An analysis of the efficient solutions obtained substantiates the usefulness of the proposed mathematical model. For the purpose of discussion and deriving implications, we present below analysis of one of the solutions obtained. The resulting computational values of the decision variables in the compromised solution are also explored. With a feasibility degree of 0.72, the compromised solution 9 (see Table 15) shows that the CLSC network configuration is attained at a total (economic) profit of INR 24,602,420, environmental impact of \(29402.7 \hbox { g/km}\), and social value of 2013. Comparing the attained values of the objectives with the optimistic values, we observe that the model has compromised on the economic gain by a meagre margin of INR 3,186,150. The carbon emission is increased by a small amount of \(2706.22 \hbox { gm}\) from the optimal value while the social benefits decreased by a value of 176.424. In terms of percentage, the compromises made in the economic, environmental, and social optimal values are approximately 11%, 10%, and 8%. The primary market upper demand of 1200 is fully met, and 1109 units and 891 units of two variants of laptops are to be assembled at AC. Table 16 shows the units of laptops distributed from each DC to PM and the number of laptops returned. Details of the number of retuned units to be processed in each RL category are provided in Table 17.
The total number of components required for assembly is 1200, out of which 891 are purchased.
External suppliers and the components procured under collaboration are 1109. Out of the returns collected at DC, the components retrieved from the returns are sent for dismantling. Table 18 further provides the information regarding the number of components to be refurbished, repaired, sold, and sent to scrap facility.
The company itself manages the transportation of laptops. The model opts for trucks with capacity of 2000 units, emission rate of \(2.6 \hbox { gm/km}\), hiring cost of INR 100 per km for transportation from AC to WDC. Two trucks each of capacity 500 units, emission of \(1.3 \hbox { g/km}\) and hiring cost INR 150 per km are chosen for sending returns from WDC to DCs. The cost incurred due to forward transportation is INR 121,240 with \(409.5\hbox {g/km}\) of \(\hbox {CO}_{2}\) emissions. The findings suggest that DMs need to consciously focus on an effective transportation system for laptops because its contribution to cost and emissions spent is significant.
7.3 Result interpretation
There are significant interpretations derived from the findings. The findings establish the importance of strategic CLSC design in improving all three dimensions of sustainability.
Economic sustainability The results indicate that implementation of RL in collaboration with 3PRL improves the financial performance of the CLSC substantially; this finding stands contrary to the perception that RL is a cost-bearing endeavour. The solution discussed shows that the company did not have to invest in the setting up of the recovery facilities but earned through a revenue sharing contract, which led to a profit of INR 12,999,830, an amount almost 52% of the total profit earned. Closing of the loop in the form of reuse of refurbished components also leads to major economic savings.
Environmental sustainability The model focusses on determining the amount of products and returns to be processed at each echelon and selection of trucks for transportation so that the environmental impact of the activities is controlled. RL ushers in reusing and recycling initiatives to result in a positive environmental network impact. A total of 766 laptops and 1758 components are reused, thus minimising discards and conserving significant resources.
Social sustainability The model has ably improved the social performance of the network by (a) extending the scope for job opportunities by creating 60 extra jobs for managing the returns, (b) providing 1500 h of training to workers, (c) creating possible donations of 175 laptops to lesser privileged, and (d) allocating 175 hours of community service.
In summary, the above results demonstrate that the proposed optimisation model for CLSC network design is highly suitable for laptop manufacturing companies.
8 Managerial implications
The present study provides a theoretical guide for electronic companies in India for prioritizing their managerial efforts while addressing sustainability concerns in the design of their CLSC network. The specific case study provides management with a structured insight for the practical integration of reverse and forward activities for sustainable growth, and these actions can be applied to the Indian electronic sector in general.
8.1 Theoretical implications
Analysis of the results formulates the following theoretical implications:
-
The results reaffirm the claim made in the study that returns no longer need to be viewed as waste; sending them to the landfill should be the last option. Closing the loop and evolving suitable tactics for decision-making at strategic level from TBL perspectives can provide sustainable opportunities for economic, environmental, and social prosperity.
-
To maximize the TBL performance of the CLSC network, emphasis must be placed on collaborative approaches. Manufacturers can seek sustainable participation of the suppliers, 3PRL, working staff, government and social organisations. The results highlight the TBL enhancement achieved through contribution of the stakeholders towards optimum resource utilization, maximum value recovery, minimising carbon emissions, and social benefits.
-
The model demonstrates that although addressing environmental and social concerns can lead to extra costs, optimal efforts towards integrating forward and recovery flows, 3PRL revenue sharing collaboration, optimal job creation, training of staff, appropriate selection of vehicles, optimum capacity utilisation of facilities, and community development can facilitate a suitable balance between all TBL performance indicators.
-
Implementing a TBL-based CLSC imposes various additional restrictions which affect the optimisation potential of the network, and therefore it clearly calls for a flexible decision making environment as developed in the study.
8.2 Practical implications
The theoretical implications provide management with a suitable planning decision framework so that effective strategies can be developed and implemented, as discussed below:
-
From the TBL perspective, the outcome of the results reinforces the claim made in the study that without compromising too much on its financial gains, the CLSC model can immensely aid the company in making significant contributions to the environment and the society.
-
Third party reverse logistics providers can play a huge part in taking care of the legal and environmental liabilities of the electronic manufacturers with minimum investment. The research shows how management can build a sustainable partnership with 3PRLs for the economic stability of the CLSC network and for improving upon its corporate social image.
-
Although it is difficult to achieve social sustainability while striving for profits, the proposed CLSC network highlights that financial incentives from the government, contribution of employees, and support from social organisations can be extremely advantageous in generating a profound social impact.
-
To enhance the process of remanufacturing and reuse, manufacturers need to revisit their sourcing strategy and work with suppliers open to RL. Therefore, it is emphasised that assessing the local supply market and procuring local components can aid the company in sustainably reusing the components retrieved from the reverse channel and in minimising waste. In the process, the local manufacturing sector can also get a major boost from the electronic industry.
9 Conclusion
This research work explores a CLSC network design model that can be adopted by electronics manufacturers in meeting their sustainability targets with minimal environmental disruption and maximum societal gain. The configuration represented as a fuzzy mixed-integer linear programming formulation has the following significant features: (1) This method integrates decisions with a variety of issues in the CLSC under a fuzzy environment. These issues include collaboration with 3PRL and developing component sourcing strategy; choosing the most appropriate recovery options, imparting skilled training and adopting community development programs at the tactical level; staff employment, flow allocation of products and components, and transportation decisions at the operational level. (2) The AHP–TOPSIS methodology is applied to model efficiently the stakeholders’ requirements as weights for the following TBL objectives: maximisation of profit, maximisation of social impact, and minimisation of environmental impact of the CLSC network. (3) In order to accommodate the optimisational complexities that arise from the presence of three conflicting objectives, a fuzzy WGP approach is utilised in order to obtain a preferred compromised solution. The significant resulting contributions are: (i) The CLSC network planning model is applied effectively in the case study of an Indian laptop manufacturer seeking to derive TBL benefits of closed loop approach under collaboration; (ii) The results substantiate the importance of assessing the product recovery activities as sustainable opportunities for economic, environmental, and social prosperity; (iii) The model aids in reaching optimal decisions for acquiring a balance between the TBL performance indicators, despite being constrained by parametric restrictions; (iv) A trade-off set of fuzzy properly-efficient solutions is yielded for highlighting the interdependence of the TBL indicators. DMs can analyse these options to institutionalise the right strategies and to choose the best compromised solution; (v) The managerial implications highlight the sustainable incentives generated by the model for motivating the SC managers to implement the proposed CLSC network in the real world setting.
References
Accorsi, R., Manzini, R., Pini, C., & Penazzi, S. (2015). On the design of closed-loop networks for product life cycle management: Economic, environmental and geography considerations. Journal of Transport Geography, 48, 121–134.
Altmann, M. (2015). A supply chain design approach considering environmentally sensitive customers: The case of a German manufacturing SME. International Journal of Production Research, 53(21), 6534–6550.
Amin, S. H., & Zhang, G. (2013). A multi-objective facility location model for closed-loop supply chain network under uncertain demand and return. Applied Mathematical Modelling, 37(6), 4165–4176.
Battini, D., Persona, A., & Sgarbossa, F. (2014). A sustainable EOQ model: Theoretical formulation and applications. International Journal of Production Economics, 149, 145–153.
Bellman, R. E., & Zadeh, L. A. (1970). Decision-making in a fuzzy environment. Management Science, 17(4), B-141.
Boukherroub, T., Ruiz, A., Guinet, A., & Fondrevelle, J. (2015). An integrated approach for sustainable supply chain planning. Computers & Operations Research, 54, 180–194.
Brandenburg, M., & Rebs, T. (2015). Sustainable supply chain management: A modeling perspective. Annals of Operations Research, 229(1), 213–252.
Brandenburg, M., Govindan, K., Sarkis, J., & Seuring, S. (2014). Quantitative models for sustainable supply chain management: Developments and directions. European Journal of Operational Research, 233(2), 299–312.
Cassen, R. H. (1987). Our common future: Report of the World Commission on Environment and Development. International Affairs, 64(1), 126–126.
Chaabane, A., Ramudhin, A., & Paquet, M. (2012). Design of sustainable supply chains under the emission trading scheme. International Journal of Production Economics, 135(1), 37–49.
Chen, Z., & Andresen, S. (2014). A multiobjective optimization model of production-sourcing for sustainable supply chain with consideration of social, environmental, and economic factors. Mathematical Problems in Engineering, 2014, 616107. https://doi.org/10.1155/2014/616107.
Chuang, C. H., Wang, C. X., & Zhao, Y. (2014). Closed-loop supply chain models for a high-tech product under alternative reverse channel and collection cost structures. International Journal of Production Economics, 156, 108–123.
CPCB (2014). List of registered E-waste dismantler/recycler in the country. http://www.cpcb.nic.in/Ewaste_Registration_List.pdf. Accessed 24 Nov 2016.
Cruz, J. M. (2013). Modeling the relationship of globalized supply chains and corporate social responsibility. Journal of Cleaner Production, 56, 73–85.
Daghigh, R., Jabalameli, M., Amiri, A., & Pishvaee, M. (2016). A multi-objective location-inventory model for 3PL providers with sustainable considerations under uncertainty. International Journal of Industrial Engineering Computations, 7(4), 615–634.
Darbari, J. D., Agarwal, V., Chaudhary, K., & Jha, P. C. (2015). Multi-criteria decision approach for a sustainable reverse logistics network under fuzzy environment. In International Conference on Industrial Engineering and Operations Management (IEOM) 2015, (pp. 1–7). IEEE.
De Giovanni, P. (2014). Environmental collaboration in a closed-loop supply chain with a reverse revenue sharing contract. Annals of Operations Research, 220(1), 135–157.
Dehghanian, F., & Mansour, S. (2009). Designing sustainable recovery network of end-of-life products using genetic algorithm. Resources, Conservation and Recycling, 53(10), 559–570.
Devika, K., Jafarian, A., & Nourbakhsh, V. (2014). Designing a sustainable closed-loop supply chain network based on triple bottom line approach: A comparison of metaheuristics hybridization techniques. European Journal of Operational Research, 235(3), 594–615.
Diabat, A., Abdallah, T., Al-Refaie, A., Svetinovic, D., & Govindan, K. (2013). Strategic closed-loop facility location problem with carbon market trading. IEEE Transactions on engineering Management, 60(2), 398–408.
Dwivedy, M., & Mittal, R. K. (2010). Future trends in computer waste generation in India. Waste management, 30(11), 2265–2277.
Elhedhli, S., & Merrick, R. (2012). Green supply chain network design to reduce carbon emissions. Transportation Research Part D: Transport and Environment, 17(5), 370–379.
Elkington, J. (1998). Partnerships from cannibals with forks: The triple bottom line of 21st-century business. Environmental Quality Management, 8(1), 37–51.
Ernst, D. (2014). Upgrading India’s electronics manufacturing industry: Regulatory reform and industrial policy, a special stusy. Honolulu, Hawaii: East-West Centre.
Erol, I., Sencer, S., & Sari, R. (2011). A new fuzzy multi-criteria framework for measuring sustainability performance of a supply chain. Ecological Economics, 70(6), 1088–1100.
Eskandarpour, M., Dejax, P., Miemczyk, J., & Péton, O. (2015). Sustainable supply chain network design: An optimization-oriented review. Omega, 54, 11–32.
Fahimnia, B., Sarkis, J., Dehghanian, F., Banihashemi, N., & Rahman, S. (2013). The impact of carbon pricing on a closed-loop supply chain: An Australian case study. Journal of Cleaner Production, 59, 210–225.
Fattahi, M., & Govindan, K. (2017). Integrated forward/reverse logistics network design under uncertainty with pricing for collection of used products. Annals of Operations Research, 253(1), 193–225.
Gaur, J., Subramoniam, R., Govindan, K., & Huisingh, D. (2016). Closed-loop supply chain management: From conceptual to an action oriented framework on core acquisition. Journal of Cleaner Production, 30, 1e10.
Gimenez, C., Sierra, V., & Rodon, J. (2012). Sustainable operations: Their impact on the triple bottom line. International Journal of Production Economics, 140(1), 149–159.
Govindan, K., Jafarian, A., & Nourbakhsh, V. (2015). Bi-objective integrating sustainable order allocation and sustainable supply chain network strategic design with stochastic demand using a novel robust hybrid multi-objective metaheuristic. Computers & Operations Research, 62, 112–130.
Govindan, K., Jafarian, A., Khodaverdi, R., & Devika, K. (2014). Two-echelon multiple-vehicle location-routing problem with time windows for optimization of sustainable supply chain network of perishable food. International Journal of Production Economics, 152, 9–28.
Govindan, K., Jha, P. C., & Garg, K. (2016a). Product recovery optimization in closed-loop supply chain to improve sustainability in manufacturing. International Journal of Production Research, 54(5), 1463–1486.
Govindan, K., Khodaverdi, R., & Jafarian, A. (2013). A fuzzy multi criteria approach for measuring sustainability performance of a supplier based on triple bottom line approach. Journal of Cleaner Production, 47, 345–354.
Govindan, K., Fattahi, M., & Keyvanshokooh, E. (2017). Supply chain network design under uncertainty: A comprehensive review and future research directions. European Journal of Operational Research, 263(1), 108–141.
Govindan, K. (2017). Sustainable consumption and production in the food supply chain: A conceptual framework. International Journal of Production Economics. https://doi.org/10.1016/j.ijpe.2017.03.003.
Govindan, K., Paam, P., & Abtahi, A. R. (2016b). A fuzzy multi-objective optimization model for sustainable reverse logistics network design. Ecological Indicators, 67, 753–768.
Govindan, K., Soleimani, H., & Kannan, D. (2015). Reverse logistics and closed-loop supply chain: A comprehensive review to explore the future. European Journal of Operational Research, 240(3), 603–626.
Govindan, K., & Soleimani, H. (2017). A review of reverse logistics and closed-loop supply chains: A journal of cleaner production focus. Journal of Cleaner Production, 142, 371–384.
Guide, V. D. R, Jr., & Van Wassenhove, L. N. (2009). OR FORUM—The evolution of closed-loop supply chain research. Operations Research, 57(1), 10–18.
Hassini, E., Surti, C., & Searcy, C. (2012). A literature review and a case study of sustainable supply chains with a focus on metrics. International Journal of Production Economics, 140(1), 69–82.
Hollos, D., Blome, C., & Foerstl, K. (2012). Does sustainable supplier co-operation affect performance? Examining implications for the triple bottom line. International Journal of Production Research, 50(11), 2968–2986.
Ilgin, M. A., & Gupta, S. M. (2010). Environmentally conscious manufacturing and product recovery (ECMPRO): A review of the state of the art. Journal of Environmental Management, 91(3), 563–591.
Jaehn, F. (2016). Sustainable operations. European Journal of Operational Research, 253(2), 243–264.
Jindal, A., & Sangwan, K. S. (2017). Multi-objective fuzzy mathematical modelling of closed-loop supply chain considering economical and environmental factors. Annals of Operations Research, 257(1–2), 95–120.
Kannan, D., Govindan, K., & Shankar, M. (2016). India: Formalize recycling of electronic waste. Nature, 530(7590), 281–281.
Kleindorfer, P. R., Singhal, K., & Wassenhove, L. N. (2005). Sustainable operations management. Production and Operations Management, 14(4), 482–492.
Kuehr, R. (2003). Managing PCS through policy: Review and ways to extend lifespan. In R. Kuehr & E. Williams (Eds.), Computers and the environment: Understanding and managing their impacts (pp. 253–278). Netherlands: Springer.
Kumar, R. S., Choudhary, A., Babu, S. A. I., Kumar, S. K., Goswami, A., & Tiwari, M. K. (2017). Designing multi-period supply chain network considering risk and emission: A multi-objective approach. Annals of Operations Research, 250(2), 427–461.
Kumar, S., Teichman, S., & Timpernagel, T. (2012). A green supply chain is a requirement for profitability. International Journal of Production Research, 50(5), 1278–1296.
Liang, T. F. (2008). Fuzzy multi-objective production/distribution planning decisions with multi-product and multi-time period in a supply chain. Computers & Industrial Engineering, 55(3), 676–694.
Liang, T. F., & Cheng, H. W. (2009). Application of fuzzy sets to manufacturing/distribution planning decisions with multi-product and multi-time period in supply chains. Expert systems with applications, 36(2), 3367–3377.
Mangla, S. K., Govindan, K., & Luthra, S. (2017). Prioritizing the barriers to achieve sustainable consumption and production trends in supply chains using fuzzy analytical hierarchy process. Journal of Cleaner Production, 151, 509–525.
Mathivathanan, D., Govindan, K., & Haq, A. N. (2017). Exploring the impact of dynamic capabilities on sustainable supply chain firm’s performance using Grey-analytical hierarchy process. Journal of Cleaner Production, 147, 637–653.
Millet, D. (2011). Designing a sustainable reverse logistics channel: The 18 generic structures framework. Journal of Cleaner Production, 19(6), 588–597.
Min, H., & Kim, I. (2012). Green supply chain research: Past, present, and future. Logistics Research, 4(1–2), 39–47.
Mishima, K., & Mishima, N. (2011). A study on determination of upgradability of laptop PC components. In J. Hesselbach & C. Herrmann (Eds.), Functional thinking for value creation (pp. 297–302). Berlin: Springer.
Mohamed, R. H. (1997). The relationship between goal programming and fuzzy programming. Fuzzy Sets and Systems, 89(2), 215–222.
Mota, B., Gomes, M. I., Carvalho, A., & Barbosa-Povoa, A. P. (2015). Towards supply chain sustainability: economic, environmental and social design and planning. Journal of Cleaner Production, 105, 14–27.
Mousazadeh, M., Torabi, S. A., & Pishvaee, M. S. (2014). Green and reverse logistics management under fuzziness. In C. Kahraman & B. Öztayşi (Eds.), Supply chain management under fuzziness (pp. 607–637). Berlin: Springer.
Narasimhan, R. (1980). Goal programming in a fuzzy environment. Decision Sciences, 11(2), 325–336.
Nikolaou, I. E., Evangelinos, K. I., & Allan, S. (2013). A reverse logistics social responsibility evaluation framework based on the triple bottom line approach. Journal of Cleaner Production, 56, 173–184.
Önüt, S., & Soner, S. (2008). Transshipment site selection using the AHP and TOPSIS approaches under fuzzy environment. Waste Management, 28(9), 1552–1559.
Özkır, V., & Başlıgil, H. (2013). Multi-objective optimization of closed-loop supply chains in uncertain environment. Journal of Cleaner Production, 41, 114–125.
Paksoy, T., Bektaş, T., & Özceylan, E. (2011). Operational and environmental performance measures in a multi-product closed-loop supply chain. Transportation Research Part E: Logistics and Transportation Review, 47(4), 532–546.
Perçin, S. (2009). Evaluation of third-party logistics (3PL) providers by using a two-phase AHP and TOPSIS methodology. Benchmarking: An International Journal, 16(5), 588–604.
Pérez-Fortes, M., Laínez-Aguirre, J. M., Arranz-Piera, P., Velo, E., & Puigjaner, L. (2012). Design of regional and sustainable bio-based networks for electricity generation using a multi-objective MILP approach. Energy, 44(1), 79–95.
Pinto-Varela, T., Barbosa-Póvoa, A. P. F., & Novais, A. Q. (2011). Bi-objective optimization approach to the design and planning of supply chains: Economic versus environmental performances. Computers & Chemical Engineering, 35(8), 1454–1468.
Pishvaee, M. S., & Razmi, J. (2012). Environmental supply chain network design using multi-objective fuzzy mathematical programming. Applied Mathematical Modelling, 36(8), 3433–3446.
Pishvaee, M. S., Razmi, J., & Torabi, S. A. (2012). Robust possibilistic programming for socially responsible supply chain network design: A new approach. Fuzzy Sets and Systems, 206, 1–20.
Pishvaee, M. S., Razmi, J., & Torabi, S. A. (2014). An accelerated Benders decomposition algorithm for sustainable supply chain network design under uncertainty: A case study of medical needle and syringe supply chain. Transportation Research Part E: Logistics and Transportation Review, 67, 14–38.
Qin, X. S., Huang, G. H., Chakma, A., Nie, X. H., & Lin, Q. G. (2008). A MCDM-based expert system for climate-change impact assessment and adaptation planning—A case study for the Georgia Basin Canada. Expert Systems with Applications, 34(3), 2164–2179.
Rajeev, A., Pati, R. K., Padhi, S. S., & Govindan, K. (2017). Evolution of sustainability in supply chain management: A literature review. Journal of Cleaner Production, 162, 299–314.
Ramos, T. R. P., Gomes, M. I., & Barbosa-Póvoa, A. P. (2014). Planning a sustainable reverse logistics system: Balancing costs with environmental and social concerns. Omega, 48, 60–74.
Rathore, P., Kota, S., & Chakrabarti, A. (2011). Sustainability through remanufacturing in India: A case study on mobile handsets. Journal of Cleaner Production, 19(15), 1709–1722.
Rubin, P. A., & Narasimhan, R. (1984). Fuzzy goal programming with nested priorities. Fuzzy Sets and Systems, 14(2), 115–129.
Rubio, S., Chamorro, A., & Miranda, F. J. (2008). Characteristics of the research on reverse logistics (1995–2005). International Journal of Production Research, 46(4), 1099–1120.
Saaty, T. L. (2008). Decision making with the analytic hierarchy process. International Journal of Services Sciences, 1(1), 83–98.
Santibañez-Aguilar, J. E., González-Campos, J. B., Ponce-Ortega, J. M., Serna-González, M., & El-Halwagi, M. M. (2014). Optimal planning and site selection for distributed multiproduct biorefineries involving economic, environmental and social objectives. Journal of Cleaner Production, 65, 270–294.
Sarkis, J., Helms, M. M., & Hervani, A. A. (2010). Reverse logistics and social sustainability. Corporate Social Responsibility and Environmental Management, 17(6), 337–354.
Selim, H., & Ozkarahan, I. (2008). A supply chain distribution network design model: An interactive fuzzy goal programming-based solution approach. The International Journal of Advanced Manufacturing Technology, 36(3–4), 401–418.
Seuring, S. (2013). A review of modeling approaches for sustainable supply chain management. Decision Support Systems, 54(4), 1513–1520.
Seuring, S., & Müller, M. (2008). From a literature review to a conceptual framework for sustainable supply chain management. Journal of Cleaner Production, 16(15), 1699–1710.
Shi, J., Liu, Z., Tang, L., & Xiong, J. (2017). Multi-objective optimization for a closed-loop network design problem using an improved genetic algorithm. Applied Mathematical Modelling, 45, 14–30.
Shokohyar, S., & Mansour, S. (2013). Simulation-based optimisation of a sustainable recovery network for Waste from Electrical and Electronic Equipment (WEEE). International Journal of Computer Integrated Manufacturing, 26(6), 487–503.
Soysal, M., Bloemhof-Ruwaard, J. M., & van der Vorst, J. G. A. J. (2014). Modelling food logistics networks with emission considerations: The case of an international beef supply chain. International Journal of Production Economics, 152, 57–70.
Sundarakani, B., De Souza, R., Goh, M., Wagner, S. M., & Manikandan, S. (2010). Modeling carbon footprints across the supply chain. International Journal of Production Economics, 128(1), 43–50.
Talaei, M., Moghaddam, B. F., Pishvaee, M. S., Bozorgi-Amiri, A., & Gholamnejad, S. (2016). A robust fuzzy optimization model for carbon-efficient closed-loop supply chain network design problem: A numerical illustration in electronics industry. Journal of Cleaner Production, 113, 662–673.
Tang, C. S., & Zhou, S. (2012). Research advances in environmentally and socially sustainable operations. European Journal of Operational Research, 223(3), 585–594.
Tiwari, R. N., Dharmar, S., & Rao, J. R. (1987). Fuzzy goal programming—An additive model. Fuzzy Sets and Systems, 24(1), 27–34.
Velasquez, M., & Hester, P. T. (2013). An analysis of multi-criteria decision making methods. International Journal of Operations Research, 10(2), 56–66.
Wang, J. J., Jing, Y. Y., Zhang, C. F., & Zhao, J. H. (2009). Review on multi-criteria decision analysis aid in sustainable energy decision-making. Renewable and Sustainable Energy Reviews, 13(9), 2263–2278.
Wath, S. B., Dutt, P. S., & Chakrabarti, T. (2011). E-waste scenario in India, its management and implications. Environmental Monitoring and Assessment, 172(1), 249–262.
Wath, S. B., Vaidya, A. N., Dutt, P. S., & Chakrabarti, T. (2010). A roadmap for development of sustainable E-waste management system in India. Science of the Total Environment, 409(1), 19–32.
Wei, J., & Zhao, J. (2013). Reverse channel decisions for a fuzzy closed-loop supply chain. Applied Mathematical Modelling, 37(3), 1502–1513.
Wilson, D. C., Velis, C., & Cheeseman, C. (2006). Role of informal sector recycling in waste management in developing countries. Habitat International, 30(4), 797–808.
Winkler, H. (2011). Closed-loop production systems—A sustainable supply chain approach. CIRP Journal of Manufacturing Science and Technology, 4(3), 243–246.
Zavadskas, Edmundas Kazimieras, & Turskis, Zenonas. (2011). Multiple criteria decision making (MCDM) methods in economics: An overview. Technological and Economic Development of Economy, 17(2), 397–427.
Zhalechian, M., Tavakkoli-Moghaddam, R., Zahiri, B., & Mohammadi, M. (2016). Sustainable design of a closed-loop location–routing–inventory supply chain network under mixed uncertainty. Transportation Research Part E: Logistics and Transportation Review, 89, 182–214.
Zimmermann, H. J. (1978). Fuzzy programming and linear programming with several objective functions. Fuzzy Sets and Systems, 1(1), 45–55.
Author information
Authors and Affiliations
Corresponding author
Appendix A
Appendix A
1.1 AHP–TOPSIS methodology
The integrated AHP–TOPSIS technique is utilised for generating the weights of importance for the three TBL objectives (Perçin 2009). AHP is used for deriving weights \(v_{i }\) (normalized) for the 11 criteria (alternatives) with respect to the TBL goals. Further, AHP is used again for finding the normalized priority vectors \(u_{i }\) representing the importance of the three TBL objectives (alternatives) with respect to each of the 11 criteria (goals). The AHP method is explained in Steps 1–4 given below. Utilising these normalized priorities in the initial decision matrix of TOPSIS, the final weights of the TBL objectives (alternatives) are then calculated as per the criteria \(\hbox {C}_{1}\)-\(\hbox {C}_{11}\), following the steps 5–10.
The steps of AHP are as follows:
-
1.
Suppose there are ‘n’ alternatives whose importance weights need to be calculated with respect to a given goal ‘g.’ The alternatives are compared pair-wise on a scale of 1–9 representing subjective judgments: ‘1—equally important’, ‘3— moderately important’, ‘5—important’, ‘7—very important’, ‘9— extremely important’, with the intermediate subjectivities represented by 2, 4, 6, and 8. This leads to construction of nxn matrix A whose (i, j)th element (\(a_{{ ij}}\)) is the quantified value of the pair-wise comparison of the ith and jth criteria.
-
2.
Normalize the matrix A by dividing each (i, j)th element (\(a_{{ ij}}\)) by the jth column sum \(a_{j}\) to derive the matrix A* as shown below:
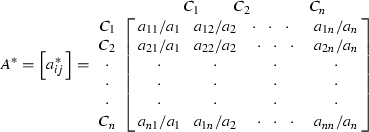
-
3.
Determine the consistency of the matrix A* by calculating the maximal eigen value, consistency index (CI), and the consistency ratio (CR) utilising the equations given below:
$$\begin{aligned} { Aw}= & {} \lambda w, { CI}=\frac{\lambda _{\max } -n}{n-1}, { CR}=\frac{CI}{RI} {\textit{where n is order of A}} \\ { and}\,\lambda _{\max }= & {} \max \left\{ {\lambda _i ,\;i=1,\ldots n} \right\} \end{aligned}$$

-
4.
Calculate the averages \(a_{i}*\) of rows of the matrix A*. The normalised priority vector is obtained by normalising the vector (\(a_{1}*, a_{2}*, {\ldots }.a_{n}*)\)
Using Steps 1–4, the normalised priority vector \(\{\hbox {v}_{1}, {\ldots }.\hbox {v}_{11}\}\) is determined. Based on each criterion, the normalised priority vector \(\{\hbox {u}_{1j}\), \(\hbox {u}_{2j}\), \(\hbox {u}_{3j},\}\) is determined. Table 19 provides the value of RI.
Further, to determine the importance rankings of the TBL objectives \((k=3)\) with respect to the criteria \(\hbox {C}_{1}\)–\(\hbox {C}_{11}\) using TOPSIS, the following steps are utilised:
-
5.
Construct the IDM for TOPSIS as shown in Table 20.
-
6.
Construct the nxn weighted normalised matrix \(\bar{{U}}=(\bar{{u}}_{ij} )=wU=(w_i u_{ij} )\)
-
7.
Calculate the ideal solution and the negative-ideal solution as follows:
$$\begin{aligned} \bar{{U}}^{+}= & {} \left\{ {(\mathop {\max \;\bar{{u}}_{kj} }\limits _k |\;j\in J^{{\prime }}),(\mathop {\min \;\bar{{u}}_{kj} }\limits _k |\;j\in J^{{\prime }{\prime }})|k=1,2,3} \right\} =\left\{ {\bar{{u}}_1^+ ,\bar{{u}}_2^+ ,\bar{{u}}_3^+ } \right\} ,\\ \bar{{U}}^{-}= & {} \left\{ {(\mathop {\min \;\bar{{u}}_{kj} }\limits _k |\;j\in J^{{\prime }}),(\mathop {\max \;\bar{{u}}_{kj} }\limits _k |\;j\in J^{{\prime }{\prime }})|k=1,2,3} \right\} =\left\{ {\bar{{u}}_1^- ,\bar{{u}}_2^- ,\bar{{u}}_3^- } \right\} \end{aligned}$$where \( J^{{\prime }} \,{ and}\, J^{{\prime }{\prime }}\) are associated with benefit and cost criteria respectively.
-
8.
Calculate the separation measure of each alternative as follows:
$$\begin{aligned} d_k^+= & {} \sqrt{\sum _{k=1}^3 {\left( {\bar{{u}}_{kj} -\bar{{u}}_k^+ } \right) ^{2}} },\;d_k^- =\sqrt{\sum _{k=1}^3 {\left( {\bar{{u}}_{kj} -\bar{{u}}_k^- } \right) ^{2}} }, k=1,2,3 \end{aligned}$$ -
9.
Calculate the relative closeness of each goal as:
Clearly, \(0\le CC_i^*\le \,1 i=1,2,,3\), and higher value implies closeness to the ideal solution.
-
10.
The weighting vector \(w=\{\hbox {w}_{1}, \hbox {w}_{2}, \hbox {w}_{3}\}\) of the goals is obtained by normalising the closeness vector CC*.
Rights and permissions
About this article

Cite this article
Darbari, J.D., Kannan, D., Agarwal, V. et al. Fuzzy criteria programming approach for optimising the TBL performance of closed loop supply chain network design problem. Ann Oper Res 273, 693–738 (2019). https://doi.org/10.1007/s10479-017-2701-2
Published:
Issue Date:
DOI: https://doi.org/10.1007/s10479-017-2701-2