
Abstract
Farmers markets can offer solutions to several of the biggest problems besetting the US food system: fair prices to farmers; healthy, fresh food for consumers; direct contacts between consumers and farmers; food for food deserts; support for local economies. Awareness of these benefits led us to study the farmers markets of Greater Cincinnati. Markets grew rapidly in the early 1980s, peaked in 2012, and declined 17% by 2018. Sixty-one percent of the markets that started since 1970 have closed. Two types of markets exist: farmer-focused markets, with farmer vendors, and consumer-focused markets, with farmers and specialist vendors. Detailed information about market management shows that managers, the majority of whom are volunteers or underpaid, have insufficient resources to be sustainable. Market decline is often blamed on an oversupply of markets, but other factors are involved: the inability of market personnel and customers to cross class and racial boundaries; the encroachment of online retailers; a scarcity of farmers; market manager failures. Individual markets need to form coalitions and gain sufficient resources from governments or private funders to employ specialists who can assist managers, expand the consumer base, and design promotion campaigns that effectively promote farmers markets in the changing retail food landscape.
Introduction
Perhaps the most striking change in the US food system during the last 30 years has been the exponential growth of farmers markets: the USDA identified 8727 farmers markets in the US in 2018, which is a 492% increase since 1994 (Fig. 1; USDA 2017; USDA 2018b). Since the late 1970s farmers, activists, and suburban women have come together to create the explosion of these direct-to-consumer (DTC) markets. Small and medium-scale farmers, marginalized by the “get big or get out” philosophy of the USDA and by the low wholesale prices they received for their fruit and vegetables, were organizing markets in the late 1970s and 80 s, like the Tailgate markets discussed below, to get fair prices from their produce. Activists, who had realized that the food system encapsulated the environmental and social problems facing the US and world (Belasco 1992; Henderson 2000; Hinrichs and Lyson 2007), were organizing farmers markets in the 1980s and 90 s as a first step toward creating an environmentally sustainable, socially just, and economically viable food system (Feenstra 1997; Henderson 2000, Gillespie et al., 2012). In the first decades of the current century suburban women, concerned with microbe-contaminated meat and produce and with the unhealthy manufactured foods that fill supermarket shelves and freezers, collaborated with farmers to create markets that would provide their families and neighbors with fresh, healthy food, as we discuss below.

Estimated number of US farmers markets 1880–2018
However, in 1971 a review of the history and types of markets at which farmers sold produce projected a dim future for farmers markets, labeling them “functional anachronisms” (Pyle 1971). Pyle noted that many types of markets include “farmer” in their name, but she defined farmers markets, as would the USDA and market promoters 25 years later (USDA 2018a): places where farmers sell their own produce directly to consumers at fixed places and fixed times. Pyle evaluated markets available to farmers in terms of the financial and power balances between sellers and buyers and concluded that the balance had tipped away from farmer-sellers, so farmers markets would fade away. Yet, she ended her article noting that the high quality produce as well as the social and personal benefits consumers receive from shopping at farmers markets might be sufficient to “herald yet another upswing in the fortune of the farmers market (Pyle 1971:197).”
Pyle’s cautionary conclusion was right, though to a much greater extent than she could have imagined. Though locals proudly quote Mark Twain’s comment that he wanted to be in Cincinnati when the world ends because everything reaches Cincinnati 20 years late, the region surrounding Cincinnati, Ohio has not only shared in the proliferation of these direct farmer-to-consumer markets but contrary to Twain’s dictum, the number of Cincinnati markets began to increase earlier and expanded more rapidly than in the US as a whole (Figs. 1 and 2). The growth of our region’s farmers markets and their importance in the emergence of an alternative food system, what Gillespie et al. (2007) called “keystones” to a new food system, piqued our curiosity, and in 2010 we set out to elucidate the historical and geographical patterns of our region’s markets. This paper reports some of the results of that research.

Numbers of greater Cincinnati farmers markets 1969–2018
This paper’s first section is a brief review of the problems besetting the US food system. In the second section, we describe the role of farmers markets in the quest for a sustainable local food system. In the third section, we describe the research methods we used to identify and describe the growth and characteristics of our regional markets. The fourth section presents some of the project’s results: the growth of farmers markets over the last 45 years; the types of markets defined by their era of origin, the goals of their founders, and their arrays of vendors; the management practices of market managers; an analysis of the causes of market failure. These data show that the number of markets peaked in 2012 and had declined 17% by 2018. The fifth section explores the reasons for this decline in Cincinnati, discusses the implications of our research, and speculates on the future of farmers markets and their role in a sustainable local food system in Cincinnati and elsewhere. We end with a short conclusion.
Contradictions and outcomes of US food systems
Although the US food system produces enormous volumes of quite cheap food, almost every part of it has environmental and social externalities, which make it unsustainable. We can only hint at the depth of the contradictions these problems reveal, but this brief review indicates that the issues are profound and pervasive and that change is inevitable.
The mainstream food system is an industrial system dominated by oligopolies of huge, often vertically integrated corporations (Halweil 2000; Sage 2013; Hauter 2012; Magdoff et al. 2000; Lane 2020). Farmers are caught on a “production treadmill,” the market system that forces farmers to increase production to ‘get ahead,’ thereby creating gluts, low prices, decreasing profit margins, bankruptcies, and ever fewer but larger farms (Perleman 1977; Strange 1988; Halweil 2000; Krebs 1992). By 1997 there were 4.38 million fewer farms than in 1930, which means that for those 66 years the number of farms declined by an average of 1270 farms each week (Doyle 2002). These forces are partially ameliorated by government subsidies, but because these programs are highly skewed toward few crops and the largest producers, they do little or nothing to free small and mid-sized farms from market forces (EWG 2020).
Corporations have penetrated the food system from “both ends” (Heffernan 2000). Driven by overproduction, farmers have replaced inputs that the farm had generated internally with industrial chemicals, hybrid/GMO seeds, specialized machinery, and satellite-guided technologies. At the output end, vertically integrated corporations purchase agricultural commodities, often grown with inputs they had sold, and use biochemical technologies to break the commodities into organic molecules which they manufacture into “prepared” foods, adding the shrewd combinations of sugar, salt, fat, and crunchy mouthfeel to make the “food” near-irresistible (Pollan 2008; Moss, 2013, 2021).
This food system creates the most severe health problems Americans face. This involves farm workers who suffer from low pay, long hours, pesticide exposure, and exclusion from labor law protections applied to other workers (Moses 1993; Nelson 2018); employees in food manufacturing and retail with low wages, irregular and unpredictable scheduling, and high injury rates (Schlosser 2001; Shierholz 2014); meat factory workers whose repetitive movements and fast dis-assembly lines combine high injury rates with low wages; consumers who are repeatedly sickened by meat and vegetables contaminated with antibiotic-resistant E. coli, Salmonella spp., and other contaminants (Schlosser 2001; Consumer Reports 2014, 2015). Perhaps, the most severe problem is that most of the US population is overweight, and in 2016, 40% were obese and 7.7% severely obese, up from 33.7% and 5.7% respectively in 2008 (Richtel and Jacobs 2018). Obesity correlates with the major causes of death: heart attacks, strokes, and diabetes. Although multiple factors like genetics and levels of physical activity influence whether an individual becomes obese, the rise of fast food, the increase in restaurant and soft drink portion sizes, the expansion of factory prepared meals and snack foods (Moss 2013; 2021) undoubtedly contribute to the problem of overweight Americans, especially when compared to the condition of the American population before these changes began. Hence, a great deal of the escalating costs of US health care spring from the food we eat and the food system that delivers it (Crawley and Meyerhoffer 2012).
Farmers Markets as a key part of a solution?
The food system described above was essentially in place by the late 1970s Footnote 1 (Friedman 1987; McMichael 2009), became one of the targets of the social critique that developed in the late 1960s and subsequent decades (Belasco 1993; Obach 2015), and induced people to create alternatives. As an alternative food movement developed, activists and scholars promoted farmers markets as a solution (Feenstra 1997; Henderson 2000; Lyson 2007) and even the “keystone” of a new food economy (Gillespie et al., 2007). Local food activists and scholars, seduced by the simple solution that farmers market seemed to offer, ignored the ambiguity of “local” (Martinez et. al., 2010;) and saw farmers markets and local food as “embedded” in local communities and part of a new “moral economy” (Hinrichs 2000; Kloppenberg et al. 1996; Leiper and Clarke-Sather 2017) with values directly opposing those of the globalized market economy (Troop 2014). To create farmers markets local food activists often collaborate with city administrators, neighborhood councils, shopping center managers, business associations, and corporate wellness coordinators, groups who see farmers markets as ways to enliven urban spaces, promote economic development, foster new businesses, and enhance employee health. We show the combinations of groups that formed the markets in our region (Table 2) and use these combinations to sort out the reasons for market failures (Table 8).
Critical scholars, however, note that local food advocates and many scholars oversimplify and romanticize “local” as a fixed category of “good” and cast non-local as “bad” (Hinrichs 2003; Dupuis and Goodman 2005; Winter 2003). Moreover, no generally accepted definition of “local” exists. In the 2008 Food, Conservation, and Energy Act, Congress defined local food as transported fewer than 400 miles from its origin or grown within the state of sale (Martinez et al. 2010); Walmart defines local as grown in the same state; Safeway defines it as within an eight-hour drive; Whole Foods defers to the local managers to define it (Tarkan 2015).
That “local” has such an ambiguous spatial definition reveals that it is socially constructed and political: different groups create different meanings of “local,” but those with power are able to impose their definition on society and decide who and what is included and who and what is excluded (Born and Purcell 2006; Winter 2003; Hinrichs 2003). For example, the spatial area supermarkets label as “local” significantly exceeds the area food activists use, which is usually fewer than 60 miles from a city center or the area within political boundaries, like counties. When supermarkets label their food “local,” they often tap into customer assumptions that local food is healthier and supports the local community, thereby allowing some customers to ignore farmers markets, which actually fulfill those assumptions.
From 1990 until 2015 the number of farmers markets grew extremely rapidly (Fig. 1), but in the latter half of the 2010s scholars and activists began to recognize and discuss the income declines among farmers selling directly to consumers, the increasing numbers of closing farmers markets, and the 50% of members Community Supported Agriculture (CSA) organizations who fail to renew membership (Low et al. 2015; Helmer 2019; Galt 2013; McKee 2018; Hamilton 2018). These changes are reflected in the slowing growth in the number of USDA-listed US farmers markets: in 2012 there were 1732 more markets than in 2010, but only 33 more in 2016 than 2015 and 18 more in 2017 than 2016 (Fig. 1). Although the USDA list is composed of self-reported markets and lacks systematic vetting to ensure accuracy (Schupp 2017), we assume that the inaccuracies are consistent across the US and from year to year, and so the USDA numbers adequately portray the patterns of expansion and stagnation, though not the precise number of US farmer markets in any given year.
Five reasons have been proposed to explain these declines. The first explanation is that the rapid increase in new farmers markets has produced a glut so that farmers markets are competing for farmers and customers in a zero-sum game (Zezima 2011; Helmer 2019; Wolnik 2019).
The second reason is related to the ambiguity of “local” and the ability of those with power to create the definition of local food. In the case of farmers markets, many food activists are unconscious of the source of their power, their middle-class status and white skin, and will deny that they or their markets have any bias. However, critical scholars have examined the ways these white-privilege assets remain unexamined and impede activist goals (Alkon and McCullen 2011; Slocum 2007, 2008; Guthman 2008a, 2008b; Lambert-Pennington and Hicks 2016; Kobayashi and Peake 2000). The ambiance at most farmers markets is one of affluence and superior knowledge: local food activists know the problems of the mainstream food system and believe that they need to educate others so they will take advantage of the services their farmers markets provide (Guthman 2008a, 2008b). Despite their strong desire to expand the racial and class diversity in their markets, their unconscious biases create spaces of whiteness and middle-class behavior that feel unwelcoming to the groups they seek to attract (Slocum 2007, 2008; Lambert-Pennington and Hicks 2016; Guthman 2008a, 2008b).
The third explanation cites the rapidly changing retail food landscape that is siphoning customers from farmers markets and CSAs into online ordering and home delivery of groceries and prepared meals. These retailers are increasingly marketing their products as “local and “sustainable” (Tarkan 2015; Stanger 2019; Lempert 2016, 2017), thereby offering potential farmers market customers a convenient and allegedly high-quality source of food. The impacts of the Covid-19 pandemic have accelerated these trends. The fourth explanation argues that there are too few farmers to supply the direct-to-consumer (DTC) demand. The final explanation, a study of farmer market failures between 2002 and 2006 in Oregon (Stephenson, Lev, and Brewer 2008), stressed the interconnected factors that lead to market failure, but centered on market manager experience, talents, and compensation: failing markets are primarily small, short-lived, and have unpaid managers. A major part of our research is to discover manager experiences and challenges. We explore this and all these explanations more thoroughly in the Discussion section below.
Methods
Conveniently, before we began this study, a group of food activists was publishing annual iterations of the Central Ohio River Valley Local Food Guides (CORV 2017), a compendium of alternative food sources, one of which was a list of farmers markets. This list guided us in selecting the markets for our study, but we found others not on the list and excluded some that were.
As noted above, defining “local,” is a problem that local food activists acknowledge, but resolve with arbitrary definitions: the CORV guides (2017) includes all markets within 50 miles of downtown Cincinnati. We were able to identify “local” markets more easily: we include markets located within the contiguous urban and suburban neighborhoods of Greater Cincinnati. Hence, markets separated by agricultural fields from the built-up areas were excluded.
Identifying “farmers markets” has been more challenging than defining “local.” The USDA defines farmers markets as places where “two or more farmer-producers sell their own agricultural products directly to the general public at a fixed location” (USDA 2018a). Of course, farmers have been selling or bartering their produce at markets since the first civilizations emerged, and as the US food system evolved, farmers also sold retail to fellow citizens, to local grocers, to resellers, and to local and regional brokers; these sales occurred in market houses, open-air markets, and at auctions (Wann et al. 1947; Pyle 1971; Brown 2001; Tangires 2019). Because of the multiple types of markets at which farmers have and do sell produce, the definition of farmers markets has varied and makes determining the numbers of markets in the past and today a challenge.
The current definition that emerged after WWII, restricts sales to produce that farmers have grown themselves and prohibits reselling purchased produce. All our markets require vendors to observe this rule, though violations are sometimes found. The USDA has been collecting data on market numbers only since 1994. Before 1994, very few studies assembled data and estimated the numbers of such markets in the US. Brown (2001) collected the scattered and incomplete information and used them to estimate the numbers of US markets in the years before 1994. Brown based her pre-1994 numbers primarily on the work of Wann et al. (1948) and Linstrom (1978), but Wann et al. (1948) only included the markets which still operated in 1946—they did not include the markets which had operated but closed before 1946, so the small numbers prior to 1946 are surely underestimates and include markets that resold purchased produce. Since there seems to be no easy way to improve Brown’s data, we combine them with the 1994 to 2018 USDA data to estimate the numbers of farmers markets in the US over the last 140 years (Fig. 1). As noted above, the USDA list of markets is flawed, but it is much closer to the actual numbers than the pre-1994 estimate and is close enough to reveal the actual patterns of expansion and stagnation since 1994 (Fig. 1).
The USDA definition seems to be clear, but we have encountered difficult choices whether to include some of the markets included in the CORV guides. First, several CORV markets which we included as markets in earlier years had lost farmers, leaving them only with one farmer or with “backyard gardeners” supplying vegetables, so we dropped these markets. Second, distinguishing a “farmer” from a “backyard gardener” from an “urban farm grower” is difficult. Bosco and Joassart-Marcelli (2018) distinguish between “gardening,” i.e., growing food as leisure, and “agriculture,” producing food for consumption or sale, but they admit the boundary is blurry. We are defining “farmer” as those with at least one-quarter acre devoted to production for local sale. Third, several CORV-listed markets sell their produce at the site of their gardens, so we excluded them as “farm stands.” In the end, we include 37 market sites as the operating markets of 2017 and 34 market sites in 2018 (see Fig. 2). Except for the numbers of markets in 2018, this study uses data from 2017 because comprehensive data from 2018 were not available at the time of writing.
An additional level of complexity arises because in 2017 two markets operated seven days per week, three are open two days per week, and three operated once per month. A major way we analyze markets is by the number and types of vendors. Markets that operate more than one day per week all sell on Saturdays, and we quickly realized that Saturday markets are enough larger than other weekday markets that we should consider them separate markets. In 2017 there were 32 sites with one market per week, and five with Saturday and one or more other days. For twice per week markets, we counted the Saturday and the other weekday as separate markets. For the seven days per week markets, we counted the Saturday and Wednesday markets as two separate markets. Hence, in our analyses, we recognize 42 markets operating at 37 market sites.
Field methods
To collect data on markets, we first visited markets, observed the vendors and products being sold, introduced ourselves to the market manager, and scheduled an appointment to interview the manager. We designed data collection sheets for the manager interviews and used them for our formal interviews, having managers sign an IRB-approved letter that they need not respond to any question they prefer to skip. These interviews usually lasted for an hour and covered a wide array of points: contact information for the manager; how and when their market formed; the relative roles of individuals, local activists, government agencies, and businesses in creating and maintaining the market; the history of manager involvement; the goals of the originators; the presence of a board of directors; fees for vendors; legal status of the market; duties of the manager; use of special activities like music and children’s games; their vision for the market five years hence. We transcribed the notes from the interview and informal discussion with the manager into a Word document, added questions that emerged from transcribing the interview, emailed the summary to the manager for corrections, and made the corrected interview the final version. We then extracted from the manager’s answers to our questions the units of information we could enter into spreadsheets for analysis. For example, we separated into four columns the relative importance of farmers, non-farmer activists, local governments, and local businesses in creating each market.
We also created forms on which to record the vendors, products they were selling, farm or business location, and information we gathered from informal discussions with vendors. These field data were then edited and entered into our basic spreadsheets. We visited and recorded data at all the markets several times per year, and at least once during the July–August peak season in the years from 2010 through 2017. These data were supplemented by information from the weekly emails on events and vendors at their markets that many managers send. These peak season data are the bases for the numbers and types of vendors and other information we use in our analyses.
These data were supplemented by results of a survey of farmers market managers done by the Local Food Action Team of Green Umbrella, the non-profit organization that coordinates sustainability activities of the region. This survey collected data on 48 markets in Green Umbrella’s 11 county target area (5 in Ohio, 3 in Kentucky, 3 in Indiana), and included all the markets of this study. The senior author of this paper was part of the committee that identified the types of information needed and refined the multiple iterations of the survey instrument that was created by committee member Julie Twiss. The senior author also contacted the managers of our markets to explain the project, sent the managers the survey instrument, and followed up to encourage their participation. Amazingly, the managers of all the 48 markets replied with some, or all, of the data. The instrument that Ms. Twiss created was extremely detailed: it had 40 questions, but all were designed with many sub-categories. For example, the question, “What are the duties of the market manager” had 13 boxes to check and one open-ended question. Another question “What amenities does your market offer,” had 23 boxes and one open-ended question. Altogether the survey data occupied 286 columns in the Excel spreadsheet.
These data were analyzed by Ms. Twiss. She calculated descriptive statistics for the data categories and created Pivot Tables to explore and reveal connections within the data. Ms. Twiss presented her summary at a Green Umbrella meeting in early 2016, but her work was never published.
We did not use the Twiss analysis because it included markets not in our sample, markets that did not match the USDA definition (e.g., four sites were places where trucks from the regional food pantry sold produce in “food deserts” on a weekly schedule), and markets that had closed after 2015. However, we did use information from the survey to supplement and enrich the data we had been collecting.
However, some of the information about our markets in the Twiss spreadsheet included data that did not match our interview or field-visit information, so we use our data in our calculations. For example, the number of peak season vendors listed in the survey by some managers greatly exceeded the numbers we had found, perhaps because the manager counted all vendors selling through the whole year, while we counted the number of vendors actually at the markets in the peak season, 15 July to 1 September. The Twiss survey information was extremely helpful in supplementing the information we had been collecting, especially the financial data, and in expanding the categories we used when collecting data and interviewing managers of markets that opened after 2015.
Historical methods
Our discussions with managers and vendors led the senior author to explore the history of farmers markets in the region (2018). Two of the current markets are “Tailgate Markets.” While interviewing the manager of a Tailgate market, she explained that her market and one other were the last of a system of markets that activists and farmers began in 1978. We were able to find multiple newspaper stories about these markets, and several articles named the founders and listed the locations of that year’s markets. We found and interviewed these pioneers, and they gave us documents explaining their operations.
Also, we call two of the 2017 markets “Legacy” markets, because they began in the mid-19th or early twentieth centuries. The city’s only still-functioning market house, the 165-year-old Findlay Market, is not included in our Legacy group because they had no farmers selling retail for many years before 2005 when they opened a covered “shed” for a contemporary farmers market. The third type of market, defined by era of origin, we call “Recent,” part of the widespread expansion of farmers markets across the US since 1990.
Analytical methods
From these data, we built multiple spreadsheets. The basic data that we used for this paper came from the spreadsheet that we constructed for our 2017 markets. This spreadsheet had 60 columns of information, many of them ratio scale, but also some ordinal and nominal level data, and some columns with notes explaining the data. We used descriptive statistics to summarize quantitative data and counts and percentages for nominal data, like the number of markets with meat, honey, fruits, etc.
During the first few months of our study, it became clear to us that there are two general types of markets: smaller markets with farmer vendors that we call farmer-focused markets and larger markets with farmers and many specialist food and non-food vendors that we call consumer-focused markets. We separated the markets into these groups and analyzed the data separately for each group and for all the markets.
To track the numbers of the markets of our region through the last 60 years we built a spreadsheet with all the markets we had information on, the years they operated, and whether they were Legacy, Tailgate, or Recent markets (Fig. 2). We also made specialized spreadsheets for subsets of the data to summarize data and generate graphs. We are writing in the 2019 season, so we are able to include the number of market sites for 2018 but are using 2017 data for our analyses. Notably, four markets ceased operating between 2017 and 2018 and one new market opened.
We mapped the locations, sizes, and types of the existing markets for the years 1983, 1991, 2001, 2005, 2010, 2015, and 2017 (Fig. 3 shows 2017 data). We used the arrays of vendor types, histories of markets, and intentions of founders to classify markets. We calculated summary statistics of the physical site characteristics, the amenities available to patrons and to vendors, the management practices at the markets, and other data to determine how the markets can be classified into groups and the characteristics of the types of market. We explored the reasons why 50 of the 82 markets created since 1970 and one of the 3 Legacy markets that existed before 1969 have closed.

Location of 2017 Farmers Markets of Greater Cincinnati
Results
To understand the patterns of the region’s markets, we classified them in three different ways: the Era when they were created, the Focus of the market, which is defined by the arrays of vendors and products found at the market, and the Goals of the founders of the markets.
Numbers, growth patterns and Era of origin of Cincinnati farmers markets
Although farmers market numbers in the US have steadily increased almost fivefold between 1994 and 2018 (Fig. 1, USDA 2017; 2018b) and 14.4-fold since 1978 (Fig. 1), the number of Greater Cincinnati markets began to expand earlier, remained approximately constant at 18 to 21 markets from 1983 through 2004, grew rapidly to a peak of 41 markets in 2012, with a 25% increase in 2005 and a 35% jump between 2009 and 2010 (Fig. 2). Since 2012, however, the number has declined, reaching 37 markets in 2017 and 34 in 2018 (Fig. 2). As noted above, we classified markets into: “Legacy” Era markets, those begun before 1930; “Tailgate” markets mentioned above; and “Recent” markets, non-Tailgates, that began to emerge after 1970 (Fig. 2).
In 2003, one of the three Legacy markets, Cincinnati’s Court Street Market, closed, leaving only 2 Legacy markets: the Farmers Produce Market and the Historic Hamilton Farmers Market. The Tailgate markets began in 1978, and by 1983, they had 13 markets operating throughout the area. The founders of the Tailgates organized the system so that by 1985 the farmer vendors took control and operated the markets. Some of the markets settled into sites for extended periods, some moved within the same neighborhood, and others opened and closed. Interestingly, in the 1980s, about one-quarter of the Tailgates were located in and patronized by minority communities.
In the 1990s, Tailgate markets began to close, primarily because farmers were retiring without anyone wanting and able to buy the farm. The number of farmers in the Tailgate system declined from 60 in 1983 to 33 in 1989 to 17 in 2000 to 8 in 2007 and to 6 in 2017 (Kluba 2018).
As the Tailgate numbers were declining in the 1990s, Recent markets were growing at a pace that approximately equaled the rate of closing Tailgates, so the total number of markets remained between 18 and 21 from 1985 through 2004 (Fig. 2). Recent markets are the local manifestation of the expansion of farmers markets for the US as a whole. Overall, between 1969 and 2018, 82 new markets opened, but 50 have closed, for a 61% closure rate (see Table 7 below). We mapped the locations, types, and size of the markets for eight years after 1983 and present the 2017 markets here (Fig. 3).
Types of markets based on Vendors: Farmer-focused vs consumer-focused markets
We mentioned above that we separated our markets into farmer-focused and consumer-focused types, which are defined by the arrays of vendors selling goods and by most other market characteristics. The first type, which we call farmer-focused markets, have fewer vendors per market, almost all of whom are farmers, while the second type, consumer-focused, have many types of specialized vendors other than farmersFootnote 2 (Table 1).
Farmer-focused markets primarily provide farmers with venues to sell their produce. They have fewer vendors than consumer-focused markets (mean of 6.8 vs. 19.4) and most vendors are farmers (82% vs. 36%) Table 1; Figs. 4 & 5). The non-produce food items found at farmer-focused markets are what we call “sideline” foods: the jams, jellies, relishes, and baked goods prepared by farmers and their partners. Consumer-focused markets have many types of prepared foods created by specialists who are not farmers: bread; baked goods; salsas; popcorn; heat-and-eat prepared foods (pasta, ethnic foods);

Numbers of markets by number of vendors 2017 data

Numbers of markets by number of farmers 2017 data
eat-at-the-market hot foods; organic pet foods, etc. (Table 1). They usually have music and other entertainment, activities and games for children, coffee, and body products like soaps and lotions. Half of the consumer-focused markets also have craft vendors (Table 1). The inclusion of craft vendors in consumer-focused markets divides this group: “purist” markets (12 of 24) reject craft vendors and maintain the food focus of the market, while markets which include crafts (12 of 24) cite the expanded opportunities for local entrepreneurs and the wider array of products available to local consumers.
Market founders and goals
The differences between farmer and consumer-focused markets are striking, and the goals of the founders of the markets reported in our interviews track quite closely with the market focus. Farmer-focused markets, as the name implies, were created by and for farmers to provide places to sell their produce. Four of the 13 farmer-focused market sites of 2017 were begun by farmers and Extension Service agents, five of 13 by farmers and farmer groups, two by Tailgate activists (most of whom were farmers), one by a local government, and one by a combination of local government and citizen activists (Table 2).
Two of the 24 consumer-focused market sites were begun and run by farmers, but the rest were created and maintained by the following non-farmer groups: citizen activist individuals and groups (11 of 24); local government-activist coalitions (6 of 24); local government agencies (4 of 24); and a corporation (1 of 24) (Table 2). The consumer-focused markets varied slightly in how the market served the larger goals of the founders. The markets begun by activist, local government, and activist-local government coalitions primarily seek to provide families and neighbors with fresh, healthy food, and secondarily to help farmers earn a better living (Table 2). Two of the activist-created markets see farmers markets as one part of a wider community development process, of which food is just a part. Corporations have started markets in shopping malls, and some corporations and several universities operated markets as part of wellness programs. These corporate and institutional markets have fared poorly: by 2017, only one of these corporate-sponsored markets, one in an upscale “Town Center” complex, continued, and it closed at the end of the season. In 2018 the only new market in our region was begun by a different Town Center shopping complex.
Market Management
Market management is key to the success of markets. Farmers market managers must successfully complete a wide array of tasks, which require many organizational, interpersonal, and promotional skills. Our data leads to several conclusions.
First, differences between farmer-focused and consumer-focused markets are striking (Tables 1 and 2; Figs. 3 and 4). Because farmer-focused markets are run by farmers to sell their produce, they have few non-farmer vendors, no extra attractions (Table 3), and managers do many fewer tasks and spend less time and effort managing than managers of consumer-focused markets do (Table 3). Once the farmer-focused market is set up, the manager usually has only to ensure vendors attend, cooperate, and cleanup. None of the farmer-focused markets have a website, and only a few have Facebook pages to maintain. They have no ancillary musician or petting zoo attractions to recruit and guide, and they collect little information on vendors and customers. In contrast, consumer-focused market managers do undertake these ancillary tasks and spend many hours arranging them (Table 3).
Second, only a few managers of either type consistently collect basic quantitative information about how their market is operating. Activities like shopper counts, shopper surveys, vendor surveys, vendor sales totals, market sales totals, and comparisons of these statistics from year to year are only consistently done by 3 to 5 of the 37 market sites, depending on the types of data collected (Table 3).
Most managers find collecting financial information from vendors difficult. Hence, only three managers collect daily sales data and make accurate estimates of annual market sales, and at end of 2017, the most thorough data collector retired. Another four managers estimated annual sales, but the remainder left the question blank on the Twiss survey (Twiss 2016; this study Table 3: see footnotes). The absence of financial data is due to the reluctance of many farmers to disclose financial sales and the discomfort managers feel asking for it. One of the four managers who consistently and systematically collected other types of data does not collect financial data (Tables 3 and 4).
Managers also have many other tasks: advertising for the market; setting and publishing market rules; recruiting and vetting vendors; determining the optimal complement of vendors for the market; handling revenues and expenses; negotiating use of the site with the owner; obtaining local regulatory approvals; maintaining websites and Facebook pages; sending out weekly emails; and setting up and running SNAP, EBT, and bonus coupons systems. In some cases, other volunteers help with these activities, but most managers handle these activities by themselves. Our observations and informal discussions with managers indicate that managers make 90 to 100% of the basic decisions that determine the success or failure of the market.
All of these activities consume both large blocks of time preparing for, attending, and planning markets, and many shorter tasks scattered through the week, like responding to phone, email, Facebook messages, and arranging for music, games, and special events. Overall, managing consumer-focused markets takes at least 15 and often more than 20 h per week.
Manager compensation
Manager compensation in all but a few cases is far below what workers with comparable responsibilities, skills, and time demands earn (Table 5). The differences between farmer-focused and consumer-focused managers continue: volunteers manage 12 of 13 farmer-focused market sites (the other is by an extension agent), but two persons manage 3 market sites each, two managers do two markets each, and three do one market, so the 13 market sites have only seven managers.
Thirteen of 24 consumer-focused managers are volunteers. We consider two of these as volunteers because one has his $200 stall fee waived, which earns him $0.77/hr. if he works 10 h. per week for 26 weeks, and the second receives a $1000 payment for the season, but this is less than $4/hr. at 10 h. per week for 26 weeks. Few if any consumer-focused market managers can complete their tasks in 10 h per week (Tables 3&4).
Of the 11 consumer-focused managers receiving some compensation, four are full-time employees who manage the market as part of their broader job responsibilities. One market, which provided no information for 2017, pays two co-managers fixed payments, so based on Twiss survey results and observed workloads, we estimate their wages to be $7500 and $1500 for the season. Another manager had a negotiated salary of $2000/month (Tables 5). Of the 11 managers receiving hourly wages, fixed payments, or a salary, six earned relatively high payments—one with approximately $17/hr., three with $20/hr., one with the salary that we estimate to be about $23/hr., and one of the two with fixed payments approximately $16.30/hr. However, only 4 of these receive over $10,000 for 6 months of work, which might be considered a reasonable wage for a part-time worker, and only the full-time workers have health care benefits provided. The full-time employee managers in 2017 all have market management defined as part of their duties, but several have merely had market management added to their existing duties, effectively making them volunteers.
Farmer-focused managers are aging, with eight of the 13 markets managed by persons over 60 years old, while 20 of 24 consumer-focused managers are under 60. The farmer-focused markets seem to have an impending manager shortage, which is accentuated by the largely elderly vendors and the four persons who manage 10 of the 13 markets. All the market managers are white, and females manage 31 of the 37 markets.
Market instability: Numbers, percentages, and lifespans of closed markets
The farmers markets of Greater Cincinnati are declining, with one Legacy market and 50 of the 82 markets opened since 1970 closed by 2018 (Fig. 2 and Table 6), but the closure rate varied through the last 45 years. We divide the data into three periods. In the first era, 1970 through 1989, the Tailgate markets dominated, but markets of this period also had the lowest rate of closure of the three periods: 10 of the 27 markets they opened, or 35%, closed. In four cases the closed market was essentially moved within the same neighborhood, so if we consider them a single market, there are 6 closings. (Table 6).
During the second period, 1990 through 2004, the numbers of Tailgate markets decreased, but enough of the new “Recent” farmers markets were started that the total number of markets remained almost unchanged, with 13 new markets opening and 12 established markets closing (Table 6). During the last 2005–18 period 42 new markets opened, but 25 markets, or 60%, closed.Footnote 3
The only quantitative study on farmers market failures we know analyzes the 32 of 62 farmers markets that closed in Oregon between 2002 and 2006 (Stephenson, Lev, and Brewer 2008). The authors recognized the many reasons that interact to lead to market failure, but most failures were in various ways related to management. They discovered that larger markets had fewer failures, while most closed markets were small. They suggested that the large markets had more “administrative revenue” from vendor stall fees, and this allowed the larger markets to pay their managers, which in turn led to more skilled and committed managers. They also calculated the lifespans of failed markets and found that most were short-lived. Short-lived markets have inexperienced managers who presumably are less effective.
To investigate the relationships between failed markets and the lifespans of failed markets in Greater Cincinnati, as suggested by the work of Stephenson et al. (2008), we calculated the numbers of years that the closed markets operated in each of three.
15-year periods (Table 7). What is striking is the short lifespans of the failed markets of the 2005 through 2018 period: 17 of 24 (71%) of the failed markets operated three or fewer years (Table 7). In contrast, for the 1975 through 1989 period, only seven of 22 (32%) markets closed in the first three years, and only 4 of 22 (18%) if we use Tailgate markets which relocated within the same neighborhood (Table 7). Again, in contrast to the 2000–2018 period, a large number of the 1975–1989 markets, which were all farmer-focused markets, survived for many years: two markets for six years, one for nine years, four between 11 and 20 years, and three for over 20 years (Table 7). The 2000–2018 data may be interpreted several ways: the region had created too many markets; farmers markets had become trendy, all these markets were consumer-focused markets, and the groups starting new markets did not realize the work and commitment they required; some combination of these.
Causes of Cincinnati farmer market closures
As we indicated in the second section, the demand for farmer-to-consumer local food, as provided by farmers markets, farm stands, and CSAs, is slowing or declining in many parts of the US (Galt 2008; McKee 2018; Hamilton 2018; Helmer 2019). Based on our observations and discussions with managers of closed markets, vendors, and others involved in our markets, we have quite good information about the causes of 29 of the 30 market closures since 2000, but too little reliable data on earlier markets to comment.
To have a successful market, a manager once told us, you need both customers and farmers, stating the common “chicken or the egg” paradox. We believe, however, that the primary need is having at least three real farmers as the core of the market. Equally important, managers and market organizers must be able to draw enough customers to create the demand for produce that keeps farmers and other vendors coming. To coordinate these tasks a market needs a manager who has the skills and commitment to do “whatever is needed” for success. For example, about one-third of managers reported that during the first years of their market, they were at times forced to buy many of the materials they needed with their own money. Having a board or support group that assists the manager in her many tasks and who will recruit a replacement manager is key to the longevity of the market.
Most markets that close have too few customers when they close, but in the majority of such cases, there are reasons why so few customers attend the market, so we must try to discover those reasons to learn why the market closed and how to keep more markets functioning. In many cases, market organizers and/or market managers make mistakes that cause inadequate demand. Examples from our markets include: market organizers and managers choosing a bad site without easy access, adequate parking, street visibility; businesses set up markets seeking, but failing, to attract new customers from farmers market patrons; managers are incompetent and/or uncommitted, so they fail to create an organized, orderly market; market organizers overestimate customer demands. Hence, the causal sequence is: farmers markets need a core of farmers; farmers need customers to buy their produce; markets need a viable site and a smart and hard-working manager to find and keep customers.
To sort out the reasons our 29 markets failed, we first divided the markets into groups based on the reasons for which the market was started and the individual or group that created it. We then looked at the primary reasons for closure. The goals of those who started markets include: farmers seeking to sell their produce; employers seeking to promote wellness of their employees; businesses attempting to increase their sales by bringing farmers market patrons to their doors; individuals or groups seeking to provide local, fresh, and healthy food for their families and communities (Table 8).
The largest number of our closed markets were the five begun by corporations seeking, but failing, to increase sales by farmers-market-customers at their primary businesses (Table 8). The strategy of creating and running a farmers market in the hope that the spillover purchases from farmers market patrons will justify the expense and hassles of the market is at best questionable, and in view of our results, a failure. Three businesses were shopping malls and two, individual businesses. The closing of all might be blamed on too few customers attending the market, but the ill-conceived strategy is the primary cause. Moreover, when we looked more closely, we found other causes. One business operated a farmers-markets six days per week outside its store, but there is a seven-day-per-week market run by the state extension service only 5 miles away – a significant planning failure. One of the shopping centers had an incompetent, desultory manager, and another charged no fees so farmers came irregularly and dozens of hobbyists, home bakers, and crafters plied their wares for 4 years until the center replaced the market with a weekly classic-car meet. Another business, a party-store, closed its market so it could expand into the parking lot the market had occupied. The last business-market was at an upscale Town Center shopping complex that had an experienced, well-paid manager. Nevertheless, the company closed the market after two years because the costs could not justify continuing. Interestingly, the only new market in 2018 was at another Town Center. All these can be attributed to poor planning and for the two shopping centers incompetent management.
The second largest group of failed markets were two corporations and two universities which began markets as part of wellness programs. These were attempts without precedent, so they had no experienced wellness program markets to learn from or emulate. The corporate markets were held every two weeks at noon on paydays. Initially, employees came in large numbers, but as weeks passed, fewer employees attended, and the markets were abandoned. We view these “Wellness” markets as experiments that did not work due to a lack of demand. However, one corporation had other problems: it is a union shop and after several months of markets, the plant managers demanded workers clock out to attend the market, so in protest, they stopped attending. We can classify these failures as markets with inadequate demand, but we might also say that the planners overestimated demand, a management issue (Table 8).
Another three of the closed markets created by activists failed because the originators selected sites that had a combination of poor parking, insufficient nearby population, and/or locations that were invisible from main streets. Three other local activist markets had incompetent managers, those who failed to do several essential managerial tasks like: establishing and uniformly enforcing clear rules, attending the market at scheduled times; resolving vendor complaints and inter-vendor disputes, returning messages; fulfilling promises. Three other markets were unable to find replacements for retiring managers. All nine of these markets closed because of planning and management failures (Table 8).
Two markets closed because municipalities cut subsidies on which the market relied. One of these markets used the funds to pay the manager, who quit when her pay stopped, so the market closed. The other market used the money to employ a required police officer. The year after the funding was suspended, a local businessman paid the officer, but he would not do so the following year, so the manager quit and the market closed. It is unclear the extent to which the police-payment market failure was affected by poor management, but the market had been healthy before the funds were cut.
Three markets lost farmers till there were fewer than two, so we dropped them. One of these was a market whose manager made decisions arbitrarily, which drove vendors away and led one farmer-vendor to start a new market in the adjacent suburb. A second market only met once per month, had farmers who attended inconsistently, and featured many craft vendors; at the end of the second season, the manager decided to no longer call it a farmers market. The third market of this group had farmers attending in the past, but the farmers ceased coming and were replaced by backyard gardeners. The first two of these can be considered management failures. Why the farmers stopped coming to the third market is not clear; we classify it as the result of too little consumer demand.
Another three activist markets which had competent and committed managers could not attract enough customers, for reasons we could not identify, so we list the failures as due to insufficient demand. Finally, during these years Tailgate farmers were retiring or reducing workloads, so three Tailgate markets were abandoned (Table 8).
Analyzing these results, we draw the following conclusions: eight of the 29 markets failed from a lack of consumption;Footnote 4 seventeen markets failed because of bad planning and/or poor management;Footnote 5 three tailgate markets were abandoned because farmers were not available; lastly one market which could not pay for police support closed. However, we might argue that some of the “lack of consumption” markets really closed due to management failures.
Discussion
This paper is unique in that it provides a 45-year summary of the growth and characteristics of a region’s farmers markets. There have been histories of regional farmers markets (e.g. Kornfeld 2014), but we know of no in-depth quantitative description of the characteristics of the markets of an entire region at both a single point in time and in an historical context. We began this research with the simplistic vision of markets as a panacea for the manifold ills of our food system, but have found that the markets appeal to a narrow segment of society, are fragile, and require a great deal of work to be sustained. Sixty-one percent of the markets that began since 1975 have closed. The number of the Greater Cincinnati’s farmers markets expanded earlier than the US as a whole due to the activists who established the Tailgate market system and to the farmers who sustained it. We were surprised to find that the markets peaked in 2012. Recent literature suggests that direct-to-consumer (DTC) sales are stagnating or declining in many regions (Low et al. 2015; Stephenson et al. 2008; Helmer 2018; McGee 2018; Hamilton 2018; Wolnik 2019). This trend appears to be a quite recent development: a USDA survey of 1400 farmer market managers in 2014 found that: 63% of managers had more customers, more repeat customers, and more sales in 2013 than 2012; 74% had one or more vendors accepting SNAP payments; and 73% thought nearby markets had no impact on their sales. However, 46% had volunteer managers (USDA 2015a). Nevertheless, the pattern of stagnation or decline in local sales is widely reported and likely to signal a change, perhaps one beginning shortly after 2013.
In section two, we mentioned five potential explanations for the decline in direct to consumer (DTC) sales: an oversupply of farmers markets; the unconscious creation of farmers markets as spaces of whiteness and upper-middle-class culture; a changing food retail environment that usurps farmers markets patrons; a scarcity of farmers needed to supply DTC sales due to the aging of current farmers and a lack of replacements; the burden of managing markets effectively.
The first explanation for declining consumer food sales is that farmers markets have grown too quickly and have exceeded consumer demand. An NPR story in March 2019 reported this claim (Helmer 2019) and triggered much discussion (Wolnik 2019). However, the just mentioned USDA survey (2015a) reported little or no intermarket competition. The extent to which markets compete and cannibalize each other is an empirical question, and to our knowledge, no detailed study exists. We did not investigate this topic directly, but our investigations of how and why markets failed found one case where the business that opened a farmers market near an existing market failed. We also sorted the failed markets by day of the week, location within the region, and years of operation and found only one that had competitive markets nearby, but it was the party-store business that closed its market so it could expand into the parking lot. Sorting the open markets that operated in 2017 by day of the week and proximity to other markets found one possible area of conflict, on Saturdays in the northern suburbs of Cincinnati. An investigation of the significance of this issue is long overdue and will require a sophisticated examination of inter-market competition between both same-day markets and markets operating on different days of the week.
Challenging the “too many markets” argument at the national scale is the tiny, 0.3%, the share of total food sales that come from direct-to-consumer (DTC) sales (Low et al. 2015; Table 2). This suggests that the “too many markets” problem is really one of “too few customers.” Moreover, only 1/3 of DTC sales are at farmers markets, so only 0.1% of US food sales occur at farmers markets. Surely, there is room for more farmers markets.
We argued above that good market management is essential to attracting the customers that keep farmers returning and to creating a smooth-running market that minimizes farmers’ frustrations. Part of the reason that DTC sales have stagnated is the second explanation we outlined in Sect. 2: the unconscious assumptions and behaviors of market organizers and customers which produce racially and class-based spaces that make people of color and working-class whites feel unwelcome (Slocum 2007; 2008; Guthman 2008a; 2008b; Alkon and McCullen, 2010; Pilgeram 2012). The dominance of upper middle-class white people at markets is often noted, and several quantitative studies have documented the typical customer as white, affluent, well educated, politically liberal, and female (Rice 2015; Zepeda 2009; Zepeda and Carrol 2018; Wolf, Spittler, and Ahern 2005; USDA 2015b). However, farmers markets are not white spaces simply because most people are white. Rather, the behaviors, assumptions, tastes, and mannerisms of managers, activists, and customers, all parts of middle-class white culture, suffuse markets, creating “spaces of whiteness” (Kobayashi and Peake 2000; Slocum 2007; Guthman 1008a, 1008b; Alkon and McCullen 2010; Pilgeram 2012).
The source of this ambiance is the lack of awareness of white privilege, the sets of economic, social, and psychological advantages that white people enjoy due to the history of government, institutional and personal benefits bestowed on them. For example, housing is the main source of accumulated wealth of US families. In the years after WWII, the Federal Housing Administration guaranteed mortgages for “new housing in racially homogenous communities,” so whites could move to new developments in suburbs with low-interest loans and developers could sell as many houses as they built. Meanwhile, minorities were confined to older housing purchased at high-interest rates (Jackson 1980; Pulido 2000). In addition, lenders denied all mortgages in “redlined” minority communities, and new white developments often had restrictive covenants, prohibiting whites from selling houses to minority buyers. This housing discrimination has kept the family wealth of minorities tiny relative to that of whites.Footnote 6
Because white culture dominates the US, white people grow up assuming that the ways they act and think are “normal” or “American.” On the other hand, minorities do not grow up in the dominant culture and so to be successful must learn and adapt to white culture and to the unconscious and conscious biases they experience as “others.” Most white people perceive racism as intentional, malevolent acts toward minorities and as overtly racist speech; thus, they are blind to the structural privileges historically and contemporaneously given to whites, but denied to minorities. For most white Americans discussions of structural racism or white privilege are ignored or dismissed as “political correctness” (Pulido 2000; McGhee 2021).
Alternative food movement activists recognize historical injustices that minorities have suffered but often hold unconscious racial and class biases. They say they are “color blind,” that they treat everyone the same, and their markets welcome minorities. They do seek minority customers, but do not perceive how the culture of their markets remind people of color of similar spaces where they are disrespected. The farmers markets of this study that are located in mixed racial communities do not draw minority customers proportional to their numbers in their communities. For many food movement activists, learning about the huge health and environmental damages that the mainstream food system imposes has led to a revolution in their thinking. Many have become advocates and even evangelicals of the benefits of local, healthy food. They often believe that if they can explain how the mainstream food system harms people, they can convert their listeners into supporters of farmers markets and local food. However, they often remain unaware of the power position they are assuming, and how the message they are seeking to convey places them in a superior position relative to the listener they are trying, but failing, to convince. (Guthman 2008a, b). Effective communication requires a dialogue between equals and the recognition that everyone has contributions to make.
Similar processes occur when activists seek to recruit white working-class consumers. The racial barrier is obviously not present, but unconscious class prejudices are often active, and perhaps stronger because they are not restrained by cross-racial caution. We are not aware of research devoted to the ways class affects social interactions at farmers markets and how unconscious biases can be recognized and overcome. We have observed but did not systematically analyze, the relatively frequent presence of working-class, white customers at our farmer-focused markets, but we seldom saw them at consumer-focused markets. Farmer-focused markets are run by farmers and focus on selling and buying produce with few embellishments. Working-class people can identify with farmers, who work with their hands, solve practical problems, hold conservative political views. In contrast, managers, volunteers, and customers at consumer-focused markets are usually college educated and politically liberal, so they create an ambiance of affluence and superior knowledge, which makes working-class people feel out of place and often negatively judged. The intensely partisan political divisions in the present-day US exacerbate the difficulty of communicating. Nevertheless, convincing white working-class citizens that attending farmers markets can enhance their lives should be a top priority of the alternative food movement. Preparing consumer-focused market personnel to cross class divisions effectively will require training parallel to anti-racist training.
Slocum (2007) and Lampert-Pennington and Hicks (2019) argue that because of their food conversion experience, many activists should be open to training that uncovers and leads to reversing their white privilege and class biases. Such a task of fundamentally reordering one’s awareness will require input from skilled trainers and the funds to pay them. This suggests the need for an overarching administrative structure and staff to arrange for anti-racist and anti-classist training, as well as to offer managers other types of support. Funding such a position, of course, is the key challenge.
A third explanation for the decline in DTC sales is the revolution that food retailing is undergoing, as online and phone app technologies have both allowed new technology-created channels to develop and forced traditional retailers to create competing options (Harig 2017). These new channels have hijacked the branding of local, sustainable, and sometimes organic, terms that the alternative food community had been built upon (Tarkan 2016). These retailers allow consumers to select baskets of “local” and “organic/sustainable” foods, to pick orders up at stores, or to have them delivered to their door (FMI-Nielsen 2017, 2018). In addition, some online retailers create and offer “meal kits,” recipes, and assemblages of ingredients created by their chefs and delivered to the customer’s home (Meyer 2017; Top10.com. 20192019; Blue Apron 2019). The local and organic claims of these online channels and the loss of upper-middle-class clients they attract are threats to farmers markets. The lockdowns from the Covid-19 pandemic have intensified the reliance on these channels. In addition, shopping behaviors are changing as households shrink, more men shop, and people cook less often (FMI-Nielsen 2017, 2018; Lempert 2016, 2017).
The Northeast Organic Farmers Association of Vermont recognized the declining DTC sales and commissioned an analysis of how farmers markets and CSAs can respond (Hamilton 2018). The study argues that DTC vendors can no longer rely on “local” branding to capture consumers, but must design sophisticated advertising campaigns that highlight farmer markets as sources of healthy, safe, and morally just food, delivered with transparent and personally enriching experiences. Luckily, recent studies are finding that consumers are seeking transparent and authentic shopping experiences, and about half of the consumers say they shop as much for their moral values as for monetary ones (Lempert 2016, 2017; Tarkan 2015; Hamilton 2018). These trends can expand farmers market sales, but will only do so if activists can create marketing campaigns that attract online and values-based consumers. Effective campaigns will require talented marketers and financial resources to employ them – skills and resources that individual farmers and activists alone cannot assemble. Hence, the local food movement must join together to generate the needed resources to fund effective marketing campaigns in order to compete with online retailers and re-capture the customers they have lost (Hamilton 2018). This will require some overarching organization to accumulate and disperse the needed resources, and a paid staff to create it.
A fourth challenge to DTC food sales is a shortage of farmers. The results of our research support this as a serious problem. As noted above, the number of farmers in the Tailgate market system declined steeply in the 1990s and 2000s, from 33 farmers in 1989 to 17 in 2000, and six in 2007.
Results of the USDA 2017 Census of Agriculture show the entire agricultural sector is aging. Family farms continue to dominate production, with 99% of all farms being owned and run by family members (MacDonald and Hoppe 2017), but sales are highly skewed toward large farms: the 2017 agricultural census reports that the 374 largest farms made 10% of all sales (USDA 2019: Table 41) while 59% of farms each sell less than $10,000 of products annually. The 2017 Agricultural Census changed their definitions of farmers from “operators” in the 2012 Census (USDA 2014) to “producers” and “principal producers,” those involved in decision-making on farms (USDA 2019: Appendix B). Shockingly, the age distribution of principal producers reveals that there are more farmers who are 65 years or older (36.2%) than those younger than 55 years (35.2%) (USDA 2019: calculated from Table 52). The 2017 Census identified “young” farmers, those under 35 years (USDA 2019: Appendix 2), as composing only 9.4% of producers and 7.6% of principal producers. More revealing are the percentages of those under 25 years: 1.5% of producers and 0.73% of principal producers.
The demographics of local-food-selling farmers are similar to those of the total US farmer population, but not as extreme: more farmers are 65 years or older (27.7%) than are younger than 55 (23.2%), but the percentages are lower than those of all farmers. (Calculated from USDA 2015b). The main difference is that farmers 55 to 64 are 32% of local-food-selling farmers and 28% of total farmers. Hence, all farmers, including local-food-selling farmers, are aging and replacements do not seem to be in the pipeline.
For many reasons the children of farmers often do not want to farm, and the extravagant cost of land and equipment prevents potential new farmers from starting. It is logical to expect that farmer shortages will limit farmers market survival, and the declining number of the Tailgate farmers mentioned above demonstrates the pattern. Three of the 29 failed markets discussed in the Results section were Tailgate markets without farmers to serve them. We dropped another 3 markets from our group of farmers markets because they had fewer than two farmers, but at least two of them were largely due to poor management. Clearly, the extent to which farmer shortages affect individual and regional farmers markets is a serious problem, requiring research not only on the extent to which it is happening but also on how to create replacement farmers.
The fifth cause of failure is poor management. Our analysis of the 29 markets which closed since 2000 identified 17 market failures as directly due to management problems and some of the others at least partly due to management errors. Good management includes setting up a market in viable sites, establishing clear and fair rules, finding an effective manager, and supporting that manager.
Our empirical work describing market managers’ activities and conditions showed that managers in consumer-focused markets are overwhelmed by the work that successful markets demand, and this is shown by the tasks that managers intend to do, but never complete, like doing farm visits, and collecting the quantitative information needed to assess market success. In 2017, 25 of our 37 market sites had volunteer managers, four sites had managers whose full-time job responsibilities included market management, and nine received some compensation at eight market sitesFootnote 7, but only six of the nine could be considered to have adequate payment for a part-time job, let alone payment commensurate with the many skills they need to succeed (Tables 3,4,5, and 6). And, of course, only the four managers whose full-time job includes farmers market management had employment-providing health care or other benefits. We conclude that the managers of the markets we have been studying need assistance to make their markets sustainable in the long term. We might argue that the farmer-focused markets have many fewer tasks and are adequately served by current managers, but two women each manage three markets and one manages two. Moreover, farmers and managers of these markets are aging and some markets are likely to close when current managers retire. All but one of the new markets that began since 2000 are consumer-focused and undertake the many activities we have been discussing. All of this convinces us that the region’s farmers markets must organize themselves into an overarching, collaborative administrative structure, which can hire a person to assist market managers, and thereby make farmers markets more resilient and more effective. All of the impediments discussed above, except the shortage of farmers, can be addressed by this kind of structure. The employee of this farmers markets organization could organize trainings to help solve many of the problems discussed above: create “packages” of materials for special events that could be shared between markets; visit farms to evaluate growing practices; help managers collect and analyze data on market operations; find consultants to do anti-racist and anti-classist trainings so markets can begin to recruit populations who currently do not visit markets.
Many cities and metropolitan regions, like Seattle, Minneapolis, New York, Philadelphia, and most recently Pittsburgh (Farmers Market Coalition 2019), have created versions of this institution. Establishing such a coalition in Greater Cincinnati will be hard because the region includes parts of three states and scores of smaller political units, but this innovation is needed to continue to expand local food consumption. Recognizing the need and deciding to create such an organization is the first step and can lead to farmers markets fulfilling more of the potential that activists have projected for them.
Creating a way to fund such a position will be the greatest challenge. Multiple stakeholders will have to contribute, beginning with the markets themselves, but including local governments, local businesses, civic organizations, and local foundations. To organize and coordinate this goal, some organizations will have to commit to it. We earlier mentioned Green Umbrella, the local NGO coordinating sustainability activities for the region. One of its foci is expanding local food production and consumption, and its Food Policy Council guides those activities. Because this organization already operates in Ohio, Kentucky, and Indiana, it overcomes the impediments that political divisions of the region create and is the ideal home for this position. The project will need seed money, most probably a grant from a foundation or the USDA, to identify the tasks the person would undertake, and to find, hire, supervise, and pay this person. Green Umbrella has successfully secured several large USDA grants, so they are a proven partner. We feel the project will need a two-year grant to demonstrate the value the project creates and to convince the local donors mentioned above to continue the project.
Conclusion
This study describes the role that farmers markets have played over the last 45 years in delivering fresh, local, and healthy food to the greater Cincinnati region. We have provided a great deal of detailed information about the history, growth, characteristics of the markets, and the work that the managers do to maintain them. We identified two main types of markets: farmer-focused and consumer-focused. These types are, as their names suggest, designed to help farmers sell produce at prices that can sustain them and to provide families and neighbors with good, fresh, and healthy food. The farmer-focused markets seem to be disappearing because most of their farmers are elderly and few younger growers are taking their places – only one of the 30 markets that began since 2000 is a farmer-focused market. Consumer-focused markets continue to be created, but in the last few years, more of them have been folding than new ones opening. Reports of stagnating or declining sales at farmers markets in many parts of the US are common enough to lead activists to re-examine their assumptions and practices.
We found little evidence that farmers markets are losing customers from competition with other markets, but did no systematic research on which to base a stronger conclusion. Demographics of US farmers as a whole and of those focusing on DTC sales are dangerously top-heavy, indicating that a farmer shortage is likely in the future. The three markets in our study that closed because of a farmer shortage indicate the process is already occurring. Since 2000 many consumer-focused markets have opened, but almost as many folded. We attribute most of this to poor management, which includes the planning and establishment of the market as well as how well the manager runs the market. We found 17 of the 29 closed markets failed because of errors in planning and/or operation or were markets that couldn’t find a replacement for a retiring manager. We identified the changing retail food landscape that is siphoning consumers from farmers markets, and we proposed a targeted promotional campaign to recapture them. To increase consumption at existing farmers markets we suggested that farmers market operators need to identify and counteract the unconscious racial and class biases they hold, and that they design ways to attract the non-attending groups. We found that most managers are volunteers or paid little. They are overworked and needing support.
We have argued that the region’s farmers markets need an overarching regional farmers-market-promoting institution that employs an expert that can provide the existing markets with the support they need. Some of the services this person can provide include: guiding groups planning new markets; offering direct trainings and personal consultations for market management, like for record keeping; hiring specialists to do anti-racist, anti-classist trainings, and to create marketing campaigns designed to reach values-based, authenticity-seeking consumers; creating and making available a suite of special event materials from which managers can draw; and doing tasks that managers seldom have time for, like farm visits.
Obviously, this will require considerable resources. In our region, Green Umbrella is the only organization that can implement such a plan. We suggest they will need a two-year proof-of-concept grant to justify a permanent position. Green Umbrella has already won large grants, so their successes enhance the probability of obtaining a grant for this project.
The suggestions we made above should improve market operations and increase customers at existing markets, but improving the existing markets will not produce the changes that are needed. To reach the goals that farmers market proponents projected in the past—farmers markets as keystones to an environmentally sustainable, socially just, and economically viable food system—minority and white multi-class communities will need to create and use farmers markets. The overarching farmers market support-organization and employee that we are proposing could seek out community groups and leaders who see the value of farmers markets and guide their efforts in creating neighborhood markets. Outsiders can help, but local people will have to be the ones who create and run their markets.
In sum, our research suggests quite strongly that without more support, farmers markets will not become the transforming movement that activists envisioned 20 years ago, but a niche institution catering to a dedicated but small segment of food consumers.
Notes
In the late 1980s and 90s the globalization of the food system intensified as high quality exotic fruits and vegetables from the Global South began appearing in upscale supermarkets and specialized food markets (Friedland 1994).
Gantla and Lev (2015) have created a market classification system strikingly similar to ours. They classify markets by “ownership,” defined as who makes decisions, and identify three types of farmers markets: vendor led, which are very close to our farmer focused markets; community led, which are similar to our consumer-focused markets; and institutional sub-entities, markets run by larger organizations, into which some of our farmer-focused and some consumer focused markets fit.
The number of closed markets in a period are from the total number of markets, not solely from new markets that were opened during that period. For example, three of the 28 markets that closed in the 2005–2018 period were not begun during that period. Table 7 gives the number which opened and closed in the 2005–2018 period.
Eight failures due to lack of consumers: 4 Wellness markets; 3 no customer, unclear why; 1 of 3 which we dropped because they had fewer than 2 farmers, but the market continued.
Seventeen closures because of bad planning and management failures: 5 businesses; 3 markets which could not find replacement managers; 3 bad sites; 3 incompetent managers; 2 of 3 which we dropped because they had fewer than two farmers; 1 whose manager’s pay was terminated when the city cut funds.
Of particular relevance to farmers markets is the white ancestors of most of today’s farmers being given land virtually for free, while in the same period freed slaves got nothing but the false promise of “40 acres and a mule.”
One of these markets has two managers, one of whom might be considered to have adequate pay.
References
Alkon, A., and C. McCullen. 2011. Whiteness and farmers markets: performances, perpetuations … contestations? Antipode 43 (4): 937–959. https://doi.org/10.1111/j.1467-8330.2010.00818.x.
Belasco, W. 1993. Appetite for change. How the counterculture took on the food industry. Ithaca and London: Cornell University Press.
Blue Apron. 2019. Choose your menu. Blue Apron. www.blueapron.com/. Accessed June 7, 2019.
Born, B., and M. Purcell. 2006. Avoiding the local trap: scale and food systems in planning research. Journal of Planning, Education, and Research 26: 195–207.
Bosco, F. and P. Joassart-Marcelli. 2018. Spaces of alternative food: urban agriculture, community gardens, and farmers markets. In Food and place. A critical exploration, eds. Joassart-Marcelli, Pascale and Fernando Bosco, 187–205. Lanham, MD: Roman and Littlefield
Brown, A. 2001. Counting Farmers Markets Geographical Review 91 (4): 55–74.
Consumer Reports. 2014. The high cost of cheap chicken. Consumer Reports 79(2):30–36, February 2014 https://www.consumerreports.org/cro/magazine/2014/02/the-high-cost-of-cheap-chicken/index.htm. Accessed December 12, 2019.
Consumer Reports. 2015. How safe is your beef? Consumer Reports 80(10):26–33, October 2015. https://www.consumerreports.org/cro/food/how-safe-is-your-ground-beef Accessed December 12, 2019.
CORV. 2017. Local food guide 2017–18. www.eatlocalcorv.org. Accessed May 27, 2018.
Crawley, J., and C. Meyerhoeffer. 2012. The medical-care costs of obesity: an instrumental variables approach. Journal of Health Economics 31: 219–230.
Doyle, R. 2002. Down on the farm. When the biggest crop is dollars. Scientific American 287 (2): 27.
DuPuis, M.E., and D. Goodman. 2005. Should we go “home” to eat?: toward a reflexive politics of localism. Journal of Rural Studies 21: 359–371.
Environmental Working Group (EWG) 2020. Farm Subsidy Primer. Environmental Working Group. EWG Farm Subsidy Database || What are Farm Subsidy Payments? Accessed most recently on 15 November 2020.
Farmers Market Coalition. 2019. Strengthening Pittsburgh’s farmers markets. https://farmersmarketcoalition.org/wp-content/uploads/gravity_forms/1-66fc51da018bd946fb1dfb74f4bea1e7/2019/03/Pittsburgh_FarmersMarkets_Jan2019FINAL.pdf. Accessed 22 July 2019.
Feenstra, G. 1997. Local food systems and sustainable communities. American Journal of Alternative Agriculture 12: 28–36.
FMI-Nielsen. 2017. The digitally engaged food shopper. Food Marketing Institute and Neilson. https://www.google.com/search?q=the+digitally+engaged+food+shopper&oq=the+digitially+&aqs=chrome.1.69i57j0l5.6435j0j8&sourceid=chrome&ie=UTF-8. Accessed 4 June 2019.
FMI-Nielsen. 2018. 70% of grocery shopers will be shopping online by 2024. Food Marketing Institute and Neilson. https://www.nielsen.com/us/en/press-room/2018/fmi-and-nielsen-online-grocery-shopping-is-quickly-approaching-saturation.html. Accessed 4 June 2019.
Friedland, W. 1994. The new globalization: the case of fresh produce. In From Columbus to ConAgra. The globalization of agriculture and food, ed. A. Bonanno, L. Busch, W. Friedland, L. Gouveia, and E. Mingione, 210–231. Lawrence: University of Kansas Press.
Friedmann, H. 1987. International regimes of food and agriculture since 1870. In Peasants and peasant societies, ed. T. Shanin. Oxford: Basil Blackwell.
Galt, R. 2013. The moral economy is a double-edged sword: explaining farmers’ earnings and self-exploitation in community supported agriculture. Economic Geography 89 (4): 341–365.
Gantla, S., and L. Lev. 2015. Farmers’ market or farmers market? Examining how market ownership influences conduct and performance. Journal of Agriculture, Food Systems and Community Development 6 (1): 49–64. https://doi.org/10.5304/jafscd.2015.061.005.
Gillespie, G., D. Hilchey, C.C. Heinrichs, and G. Feenstra. 2007. Farmers’ markets as keystones in rebuilding local and regional food systems. In Remaking the North American food system, ed. C.C. Hinrichs and T. Lyson, 19–32. Lincoln, NE: University of Nebraska Press.
Guthman, J. 2008a. “If they only knew”: color blindness and universalism in California alternative food institutions. The Professional Geographer 60 (3): 387–397.
Guthman, J. 2008b. Bringing good food to others: investigating the subjects of alternative food practice. Cultural Geography 15: 451–457.
Halweil, B. 2000. Where have all the farmers gone? Worldwatch 13 (5): 13–28.
Hamilton, J. 2018. Stagnant, saturated, or ready to surge? Strategic marketing investments for Vermont’s direct to consumer markets. Richmond, VT: Northeast Organic Farming Association of Vermont. https://nofavt.org/sites/default/files/files/resources/vt_direct_markets-stagnant_saturated_or_ready_to_surge.pdf . Accessed 20 May 2019.
Harig, A. 2017. Retail revolution: how technology and the new consumer are transforming the food retail landscape. The Food Institute. https://www.usda.gov/oce/forum/past_speeches/2017/2017_Speeches/Andrew_Harig.pdf. Accessed 9 June 2019.
Hauter, W. 2012. Foodopoly. The battle over the future of food and farming in America. New York: The New Press.
Heffernan, W. 2000. Concentration of ownership and control in Agriculture. In Hungry for profit: the agribusiness threat to farmers, food, and the environment, ed. F. Magdoff, J.B. Foster, and F. Buttel, 61–75. New York: Monthly Review Press.
Helmer, J. 2019. Why are so many farmers markets failing? Because the market is saturated. NPR https://www.npr.org/sections/thesalt/2019/03/17/700715793/why-are-so-many-farmers-markets-failing-because-the-market-is-saturated. Accessed 20 May 2019.
Henderson, E. 2000. Rebuilding local food systems from the ground up. In Hungry for profit: the agribusiness threat to farmers, food, and the environment, ed. F. Magdoff, J.B. Foster, and F. Buttel, 175–188. New York: Monthly Review Press.
Hinrichs, C.C. 2000. Embeddedness and local food systems: notes on two types of direct agricultural markets. Journal of Rural Studies 16: 195–203.
Hinrichs, C.C. 2003. The practice and politics of food system localization. Journal of Rural Studies 19: 33–45.
Hinrichs, C.C., and T. Lyson. 2007. Remaking the North American food system: strategies for sustainability. Lincoln, NE: University of Nebraska Press.
Jackson, K. 1980. Race, ethnicity, and real estate appraisal: The home owners loan association and the federal housing authority. Journal of Urban History 4: 419–452.
Kloppenberg, J., J. Hendrickson, and G. Stephenson. 1996. Coming into the foodshed. Agriculture and Human Values 13 (3): 13–42.
Kluba, E. 2018. Assorted unpublished documents on Tailgate Farmers Markets operations; 40 years of personal experiences as Tailgate Farmers Market farmer. Pers comm.
Kobayashi, A., and L. Peake. 2000. Racism out of place: thoughts on whiteness and an anti-racist geography for the new millennium. Annals of Association of American Geographers 90: 392–403.
Kornfeld, D. 2014. Bringing good food in: a history of New York city’s Greenmarket program. Journal of Urban History 40 (2): 345–356.
Krebs, A.V. 1992. The corporate reapers. The book of agribusiness. Washington DC: Essential Books.
Lambert-Pennington, K., and K. Hicks. 2016. Class conscious, color-blind: examining the dynamics of food access and the justice potential of farmers markets. Culture, Agriculture, Food and Environment. 38 (1): 57–66.
Lane, S. 2020. Owners of meatpacker JBS to pay $240M fine over foreign bribery charges. The Hill 12 October 2020, Owners of meatpacker JBS to pay $280M fine over foreign bribery charges | TheHill. Accessed 2 February 2021.
Leiper, C., and A. Clarke-Sather. 2017. Co-creating an alternative: the moral economy of participating in farmers’ markets. Local Environment 22 (7): 840–858.
Lempert, P. 2016. Ten food trends that will shape 2017. Forbes 14 December 2016. https://www.forbes.com/sites/phillempert/2016/12/14/the-supermarketgurus-2017-food-trend-forecast/#3eab2fb954b8. Accessed 7 June 2019.
Lempert, P. 2017 Ten food trends that will shape 2018. Forbes 13 December 2017. https://www.forbes.com/sites/phillempert/2017/12/13/10-food-trends-that-will-shape-2018/#1471b6ee4104. Accessed 7 June 2019.
Linstrom, H. R. 1978. Farmer to consumer marketing. Washington, D.C: ESCS-01, Economics, Statistics, and Cooperatives Service, USDA.
Low, S., A. Adalja, E. Boughlieu, N. Key, S. Martinez, A. Melton, A. Perez, K. Ralston, H. Stewart, S. Suttles, S. Vogel, and B.B.R. Jablonski. 2015. Trends in US local and regional food systems. A report to congress Washington, DC: USDA Economic Research Service Administrative Publication 068. https://www.ers.usda.gov/webdocs/publications/42805/51173_ap068.pdf?v=42083. Accessed 5 July 2017.
Lyson, T. 2007. Civic agriculture and the North American food system. In Remaking the North American food system, ed. C.C. Hinrichs and T. Lyson, 19–32. Lincoln, NB: University of Nebraska Press.
MacDonald, J. and R. Hoppe. 2017. Large family farms continue to dominate agricultural production Amber Waves 6 March 2017 https://www.ers.usda.gov/amber-waves/2017/march/large-family-farms-continue-to-dominate-us-agricultural-production/. Accessed 1 March 2019.
Magdoff, F., J.B. Foster, and F.H. Buttel. 2000. Hungry for profit: The agribusiness threat to farmers, food, and the environment. New York: Monthly Review Press.
Martinez, S. W., M. Hand, M. Da Pra, S. Pollack, K. Ralston, T. Smith, S. Vogel, S. Clark, L. Loh, S. Low, and C. Newman. 2010. Local food systems: concepts, impacts, and issues. Washington, D.C.: Economic Research Report 97 ERS, USDA https://www.ers.usda.gov/publications/pub-details/?pubid=46395. Accessed 1 March 2019.
McGhee, H. 2021. The sum of us. What racism costs everyone and how we can all prosper together. London: One World Publications.
McKee, E. 2018. “It’s an Amazon world”: small scale farmers on an entrepreneurial treadmill. Culture, Agriculture, Food and Environment. 40 (1): 65–69. https://doi.org/10.1111/cuag.12107.
McMichael, P. 2009. A food regime genealogy. Journal of Peasant Studies 36 (1): 139–169. https://doi.org/10.1080/03066150902820354.
Meyer, Z. 2017. Growing meal kit phenomenon is stirring up the food industry, stressing out supermarkets. USA Today 3 July 2017. https://www.usatoday.com/story/money/business/2017/07/03/home-meal-kit-phenomenon/102544292/. Accessed 7 June 2019.
Moses, M. 1993. Farmworkers and pesticides. In Confronting environmental racism: voices from the grassroots, ed. R. Bullard, 161–178. Boston: South End Press.
Moss, M. 2013. The extraordinary science of addictive junk food New York Times Sunday magazine 13 February 2013 http://www.nytimes.com/2013/02/24/magazine/the-extraordinary-science-of-junk-food.html?pagewanted=all&_r=1&. Accessed 15 March 2014.
Moss, M. 2021. Hooked: food, free will, and how the food giants exploit our addictions. New York: Random House.
Nelson, L. 2018. Farm labor, immigration, and race. In: J. M., Pascale and F. Bosco (eds) Food and place: A critical exploration. Rowman and Littlefield, Lanham Md
Obach, B. 2015. Organic struggle: the movement for sustainable agriculture in the United States. Cambridge: MIT Press.
Perleman, M. 1977. Farming for profit in a hungry world: capital and the crisis in agriculture. Montclair, NJ: Allenheld, Osmun, and Co.
Pilgeram, R. 2012. Social sustainability and the white, nuclear family: Constructions of gender, race, and class at a northwest farmers market. Race, Gender and Class 19 (1–2): 37–60.
Pollan, M. 2008. In defense of food: an eater’s manifesto. New York: Penguin Books.
Pulido, L. 2000. Rethinking environmental racism: white privilege and urban development in southern California. Annals of the Association of American Geographers 90 (1): 12–40.
Pyle, J. 1971. Farmers’ markets in the United States: functional anachronisms. Geographical Review 61 (2): 167–197.
Rice, J.S. 2015. Privilege and exclusion at the farmers market: findings from a survey of shoppers. Agriculture and Human Values 32: 21–29. https://doi.org/10.1007/s10460-014-9513-7.
Richtel, M. and A. Jacobs. 2018. American adults just keep getting fatter. New York Times. https://www.nytimes.com/2018/03/23/health/obesity-us-adults.html. Accessed 6 October 2018.
Sage, C. 2013. Food and Environment. New York: Routledge.
Schlosser, E. 2001. Fast food nation. The dark side of the American meal. Boston: Houghton Mifflin.
Schupp, J.L. 2017. Cultivating better food access: role of farmers markets in US local food movement. Rural Sociology 82 (2): 318–348.
Shierholz, H. 2014. Low wages and few benefits mean many restaurant workers can’t make ends meet. Washington: Economic Policy Institute. http://www.epi.org/publication/restaurant-workers/. Accessed 25 August 2014.
Slocum, R. 2007. Whiteness, space, and alternative food practice. Geoforum 38: 520–533.
Slocum, R. 2008. Thinking race through corporeal feminist theory: divisions and intimacies at the Minneapolis farmers market. Social and Cultural Geography 9: 849–869.
Stanger, T. 2019. The brave new world of grocery shopping. Consumer Reports 84 (8): 46–54.
Stephenson, G., L. Lev, and L. Brewer. 2008. “I’m getting desperate”: what we know about farmers markets that fail. Renewable Agriculture and Food Systems 23 (3): 188–199. https://doi.org/10.1071/S1742170507002153.
Strange, M. 1988. Family farming – A new economic vision. Lincoln, NE: University of Nebraska Press.
Tangires, H. 2019. Movable markets: food wholesaling in the twentieth-century city. Baltimore: Johns Hopkins University Press.
The Brave New World of Grocery Shopping.: Articles. (oclc.org). Accessed 18 August 2020.
Tarkan, L. 2015. Big business behind the local food movement. Fortune magazine 21 August 2015. www.fortune.com/2015/08/21/local-food-movement-business. Accessed 02/25/2018.
Topten.com. 2020. Choose the best meal kit for you. https://www.bestmealkitdelivery.com/. Accessed 25 January 2020.
Troop, D. 2014. Why local food matters: the rising importance of locally grown food in the US food system. Washington D.C: Agricultural marketing service, USDA. https://www.ams.usda.gov/sites/default/files/media/Why%20Local%20Food%20MattersThe%20Rising%20Importance%20of%20Locally%20Grown%20Food%20in%20the%20U.S.%20Food%20System.pdf. Accessed 5 July 2017.
Twiss, J. 2016. Farmers market managers’ survey. Cincinnati: Local food action team of Green Umbrella. Unpublished survey results.
USDA. 2014. 2012 Census of agriculture full report. http://www.agcensus.usda.gov/Publications/2012/Full_Report/. Accessed June 28, 2014.
USDA. 2015a. 2015 National farmers market manager survey summary. https://www.ams.usda.gov/sites/default/files/media/2014%20Farmers%20Market%20Managers%20Survey%20Summary%20Report%20final%20July%2024%202015.pdf. Accessed 15 June 2018.
USDA. 2015b. Local food marketing practices survey demographics. https://quickstats.nass.usda.gov/results/3346A0D5-D718-39A3-AF9B-37E5F4BA6DEC. Accessed 15May 2019.
USDA 2017. National count of farmers markets directory listings. Washington. D.C.: USDA-AMS. Local food research and development division. https://www.ams.usda.gov/sites/default/files/media/National%20Count%20of%20Operating%20Farmers%20Markets%201994-2016.jpg. Accessed 5 July 2017.
USDA. 2018a. Definition of farmers market. Washington D.C.: USDA. https://www.fns.usda.gov/ebt/definitions-farmers-markets-direct-marketing-farmers-and-other-related-terms. Accessed 12 May 2018.
USDA. 2018b. Farmers market and direct-to-consumer marketing. Washington, D.C.: USDA. https://www.ams.usda.gov/services/local-regional/farmers-markets-and-direct-consumer-marketing. Accessed 28 May 2019. (number farmers markets for 2018 just above “USDA Farmers Market”).
USDA. 2019. 2017 Census of Agriculture Washington D.C.: USDA. https://www.nass.usda.gov/Publications/AgCensus/2017/index.php. Accessed 28 May 2019.
Wann, J., E. Cake, W. Elliot, and R. Burdette. 1948. Farmers produce markets in the United States: Part 1 History and description. Washington D.C.: USDA.
Winter, M. 2003. Embeddedness, the new food economy, and defensive localism. Journal of Rural Studies 19 (1): 223–232.
Wolf, M.M., A. Spittler, and J. Ahern. 2005. A profile of farmers’ market consumers and the perceived advantages of produce sold at farmers’ markets. Journal of Food Distribution Research 36 (1): 192–201.
Wolnik, D. 2019. Are there too many farmers markets? Notes from the market field. Parts 1, 2, 3 Albany, CA: Farmers Market Coalition. https://farmersmarketcoalition.org/are-there-too-many-farmers-markets-notes-from-the-market-field-part-1/. Accessed 5 June 2019.
Zepeda, L. 2009. Which little piggy goes to market? Characteristics of US farmers’ market shoppers. International Journal of Consumer Studies 33 (3): 250–257.
Zepeda, L., and K. Carrol. 2018. Who shops at mature farmers markets? Choices 33 (3): 1–8.
Zezima, K. 2011. As farmers markets go mainstream, some fear a glut. New York Times 20 August 2011. http://www.nytimes.com/2011/08/21/us/21farmers.html?ref=katiezezima. Accessed 16 November 2011.
Acknowledgements
We are indebted to and inspired by the many farmers market managers who shared their knowledge of the origins and operations of their markets; the farmers who explained the successes and challenges they face; and the commitment and talent of Green Umbrella’s Local Food Action Team members. We also thank Ms. Amy Prues for the revealing and handsome maps she made of the markets we studied. In addition, we want to recognize the activists who began the Tailgate market system in the 1970s and revitalized the region’s farmers markets: Jodi and Terry Grundy; Eileen Freshette; David Rosenburg, and Kathleen Cusick. Ed and Donna Kluba provided documents and discussions on development of the Tailgate markets through the years. Toby Deaton helped collect and did the first analyses of our data. Marian Dickinson and Julie Twiss collaborated with the senior author in planning and implementing the Green Umbrella farmers market manager survey, and Julie Twiss built the spreadsheet, inputted the survey data, and created the summary of survey results. Finally, the paper is greatly improved by the comments and suggestions of the three anonymous reviewers provided by the journal.
Author information
Authors and Affiliations
Corresponding author
Additional information
Publisher's Note
Springer Nature remains neutral with regard to jurisdictional claims in published maps and institutional affiliations.
Rights and permissions
About this article

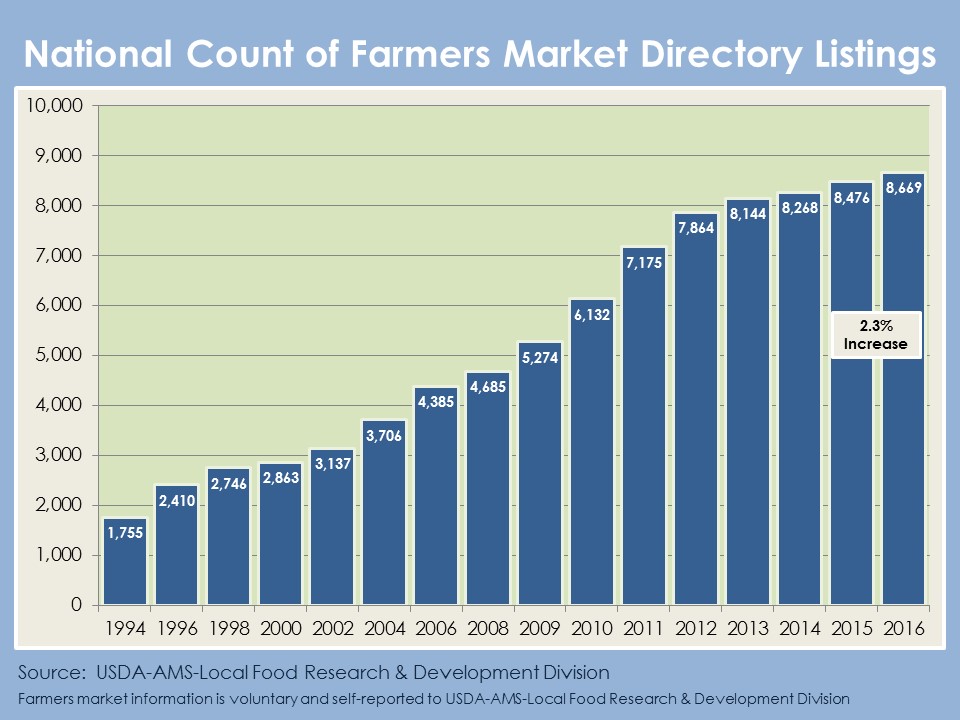
Cite this article
Metz, J.J., Scherer, S.M. The rise and decline of farmers markets in greater Cincinnati. Agric Hum Values 39, 95–117 (2022). https://doi.org/10.1007/s10460-021-10228-8
Accepted:
Published:
Issue Date:
DOI: https://doi.org/10.1007/s10460-021-10228-8