
Abstract
Buildings are the element of greatest concern with regard to debris flow hazard risk, and their destruction is mainly caused by the collapse of walls and reinforced concrete (RC) columns. This research classifies the failure modes of the columns in a typical beam–column-framed building based on field investigations and historical data. It also proposes the collapse mechanism for columns damaged by debris flow, with reference to their failure modes. Based on the collapse mechanism, three typical types of RC columns with different strengths, which are usually used in many mountainous areas of Western China, were selected for the damage analysis. The critical velocity of debris flow and the diameter of particles were obtained using theories of material and structural mechanics. The results showed that the critical bearing condition of columns can be indicated by the formation of plastic hinges along columns and by the shear damage in the column section. The development of plastic hinges was mainly determined by the debris flow velocity and diameter and the impact location of large boulders. The energy of viscous debris flow is much larger than that of the dilute flow, and there will be more severe damage for columns under viscous flow impact. The critical velocities for three plastic hinge collapses are about twice those of two plastic hinge collapses. If the diameter of the boulders is larger than 0.5 m, the impact force of the large boulders plays a major role in the column collapse. Otherwise, both the dynamic pressure of debris flow and the impact force of boulders are responsible for column failure. Finally, the critical condition of column failure was applied to Zhouqu’s debris flow hazard. The calculated critical velocity is consistent with the value given by field investigation, which implies that this study can be used for risk analysis and damage estimation in a debris-flow-prone area.
Introduction
In mountain environments, buildings in debris-flow-prone areas are often damaged by debris flow. The damage usually starts with structural collapse under the dynamic pressure of fluid, impact force of large boulders, as well as materials and logs, resulting in huge economic losses and casualties. There have been many serious disasters involving the destruction of mountain towns and settlements by debris flow, such as the globally well-known tragedies that occurred in Venezuela in December 1999 and in Zhouqu, China, in August 2010 (López et al. 2003; Hu et al. 2012). The study of the critical collapse condition of buildings impacted by debris flow will be the basis for proper structural design and land-use planning and will therefore reduce the vulnerability of communities subject to debris flow hazards.
Empirical analysis, experimental simulation and mechanical calculation are three common practices used to study damage to structures. Mileti et al. (1991) analysed the response of some buildings to the impact of the lahars in Nevado Del Ruiz, Colombia, in 1985. The Italian researchers, Toyos et al. (2003), proposed a system to evaluate the damage level of structures by analysing the damaged buildings in Vesuvius in 1998, and Zanchetta et al. (2004) identified the relationship between the debris flow impact pressure and the degree of structural damage in the same event. Progress has also been made in quantifying the vulnerability of buildings to debris flows in many Alpine countries (Spence et al. 2004; Fuchs et al. 2007; Totschnig et al. 2011; Luna et al. 2011; Papathoma-Köhle et al. 2012). In practice, most empirical relationships can be applied to a certain extent, but the accuracy of results is highly dependent on the number of building samples and the debris flow dynamic parameters retrieved from past events. Therefore, methods of experimental simulation and mechanical calculation were developed in order to reduce the dependence on historical data (Zanuttigh and Lamberti 2006). Zhang et al. (2007) conducted real-scale experiments to detect the bearing loads of walls and concrete columns, replacing debris flow impact with steel balls (the average impact force of a ball on a steel plate), which makes the dynamic condition different from real debris flow. The debris flow can be simulated in a miniaturized flume test, but the scale effect for debris flow and the similarity of building strength and rigidity are difficult to capture, so mechanical calculation was introduced in damage analysis and soon became a popular tool (Faella and Nigro 2003; Petrazzuoli and Zuccaro 2004; Kiyono et al. 2006). Both dynamic and static theories can be adopted in calculations. The dynamic method requires many input parameters which are difficult to measure in real events, such as the debris flow impact distribution and process, and the elastic–plastic characteristics of structures. Therefore, several researchers have simplified the damage process into a static form. For example, Faella and Nigro (2003) calculated the critical velocity of debris flow under the condition that the debris flow impact force equals the ultimate bearing capacity of the structure. However, the impact of large boulders and the hydrostatic pressure of debris flow were not considered in this study, which made the results too different if compared with those of other researchers (Toyos et al. 2008).
In this paper, we classified the failure models of reinforced concrete (RC) columns based on field investigation and historical materials and proposed the collapse mechanics for columns damaged by debris flow. According to the mechanical model, the critical velocity of debris flow and the diameter of large boulders were calculated by using static mechanics.
Damage classification of reinforced concrete structure
According to a large number of field investigation and debris flow inventories, we proposed three damage models of RC structures. The first is inundation or buried damage (Fig. 1(1-1, 1-2)). Debris flow destroys the ground floor external walls, and materials enter rooms. Internal contents and exposed openings of buildings are damaged without significant damage being done to the structural parts (columns and beams). The second is structural damage owing to the frontal impact of debris flow. Serious damage or the failure of single structural elements (generally columns and beams) can occur, without the whole structure’s collapse, but with the formation of plastic hinges for a few columns (Fig. 1(1-3, 1-4 and 1-5)) or serious damage and even the collapse of the whole structure may occur, with the formation of plastic hinges at the top and bottom of most columns (Fig. 1(1-6, 1-7)). The last model is erosion damage. The foundations are damaged by soil erosion and/or liquefaction, and structures incline or collapse beyond repair (Fig. 1(1-8)). Among the three modes, inundation or buried damage is the easiest to repair. Erosion damage is quite rare. Frontal impact damage is the most common failure mode for buildings in debris-flow-prone areas. Reconstruction following frontal impact damage is very costly, and the damaged structures may even be beyond repair. Therefore, the main objective of this paper is to study the impact damage model.


1-1 Debris flow inundation or buried buildings in Longchi, Du Jiangyan, China. 1-2 Debris flow buried buildings in Qingping town, China. 1-3 Reinforced concrete structure in Zhouqu debris flow: plastic collapse mechanism of columns (photograph: Ge Yonggang). 1-4 Reinforced concrete structure in Du-Wen motorway service station: collapse with the formation of plastic hinges along columns under debris flow impact. 1-5 Reinforced concrete structure in Qipan ravine debris flow, Wenchuan County, 2013: plastic collapse mechanism of columns. 1-6 Reinforced concrete structure in Qipan ravine debris flow, Wenchuan County, 2013: plastic collapse mechanism for most columns. 1-7 Reinforced concrete structure in Zhouqu debris flow: failure of ground floor columns and building translation. 1-8 Building collapse caused by erosion of foundations by debris flow
At present, the dynamic response of buildings to debris flow impact is not clear and it is also difficult to predict the dynamic process of building collapse, owing to the failure of columns and/or beam support. In order to simplify the damage process of RC buildings under the condition of column and/or beam collapse, we need to study the critical velocity of debris flow and the diameter of large boulders when a single column is damaged by debris flow.
Column collapse mechanism and impact parameters
Column collapse mechanism
Columns of RC structures are usually fixed on the beams, the ground floor and foundations. Their failure condition can be described by the formation of plastic hinges at the ends or in the midspan (Bayrak and Sheikh 2001; Faella and Nigro 2003). Under lower debris flow impact intensity, the column generates elastic deformation (Fig. 2). When the bending moment of debris flow applied on the column reaches the column’s yield moment (M c), the column begins to show plastic deformation, and a plastic zone appears at the fixed end of the column. When the external moment increases to the ultimate moment of the column (M u), the plastic zone continues to deform and develops into plastic hinges at both ends. If the column is a non-load-bearing element, the plastic hinges at the ends will continue to transfer the external bending moment until the formation of plastic hinges at both ends and in the midspan of the column. Therefore, the failure model of the RC column can be classified into two types: two plastic hinge collapse at the ends of the RC column and three plastic hinge collapse at the ends and in the midspan of the column.

Dynamic destruction processes of reinforced concrete column
The development of the plastic hinges of the column is determined by the intensity of debris flow impact force, the strength of the column and the contact condition between the debris flow and the column. Debris flow hydrostatic pressure, dynamic pressure and loading by large boulders are three components of the debris flow impact force (Hu et al. 2011a). The resulting force as a result of hydrostatic pressure is generally nil because the flow surrounds the columns along all the sides. Therefore, only the loads owing to dynamic pressure and boulders must be taken into account. The capacity of the column is determined by its cross-sectional area, concrete and steel bar strength, the strength and quantity of reinforcement, shear stirrups and the axial load in columns.
Debris flow impact models
A hydraulics model was adopted to calculate the dynamic pressure of debris flow (Eq. 1), where P is the dynamic pressure (N/m2), v is the flow velocity (m s−1) and θ is the smallest angle between the direction normal to the face of the barrier and the flow direction. The empirical factor value k depends on the flow type; for example, for laminar flow and fine-grained material, Watanabe and Ikeya (1981) estimated it to be 2.0, while Zhang (1993) recommended values between 3.0 and 5.0 based on field measurements of viscous debris flows at Jiangjia Ravine, China.
Models of boulder collision impact are collected and listed in Table 1. Most of the models were derived from elastic collision theory and were modified based on field observation and laboratory experimental data. As shown in these models, the collision impact is proportional to the particle size and its flow velocity. Some researchers have demonstrated that large boulders usually accumulate in front of the debris flow and move forward with the maximum surface velocity (Takahashi 1980; Iverson 1997). However, the velocities of large boulders in the body or tail of the debris flow decrease with increases in the boulder diameter (Prochaska et al. 2008). In this paper, it was assumed that the velocities of large boulders and debris flow are the same, and the structural damage to the building is mainly caused by the peak impact of debris flow and mixed boulders.
In addition, the impact position of boulders also affects the column’s internal forces. Therefore, it is very important to define the dynamic behaviour of grains in the debris flow. For diluted or turbulent muddy type debris flow, the boulders frequently move at the bottom of the flow. Otherwise, the grains are likely to be suspended in the highly concentrated debris flow (Fei and Shu 2004). Hu et al. (2011a) found that many particles appeared in the centre or at the surface of the viscous debris flow in Jiangjia Ravine by measuring the peak impact force of the debris flow in the field. Yang et al. (2011) suggested that the highest impact frequency of grains probably occurs at two fifth to three fifth of maximum depth of the debris flow. For lower concentrated flow, the maximum impact force appears at one third of the depth (Wei 1996; Huang et al. 2007). Proske et al. (2011) recommended that the frontal impact force at one fifth to one third of the flow depth should be the maximum loading of the debris flow. Accordingly, these findings were introduced in our research, and it was assumed that the particles are concentrated in one fifth to one third of the maximum flow depth for dilute debris flow and in one half to three fifth of maximum flow depth for viscous debris flow.
Debris flow impact condition
There have been many cases in which RC buildings have been damaged by debris flow frontal impact. These cases demonstrated that the thickness of the debris flow was higher than the height of the ground floor, and the collapse of most columns was a result of the direct impact of the debris flow. Therefore, it was assumed that the thickness of the debris flow is equal to the height of the column, and the angle between the face of the barrier and the flow direction is 90°.
At present, there is little likelihood of predicting the dynamic behaviour of large boulders in the debris flow, which makes it difficult to simulate the interaction processes of the debris flow and the column. In our study, a statics analysis was applied to calculate the critical condition when the column collapses. The subsequent impact of debris flow is not taken into account.
Collapse-resistant models of reinforced concrete column
Two plastic hinge formation mechanism in reinforced concrete columns
The ground floor columns are usually fixed at the bottom, with free horizontal displacement and restrained rotation at the top. The static scheme of the column impact by debris flow and large boulders is described in Fig. 3. The collapse mechanism is represented by the formation of two plastic hinges at the end of the columns, where the bending moments reach the ultimate value M u (Fig. 3).

Two plastic hinge mechanism for ground floor-reinforced concrete column
The application of the static or kinematic theorem of the limit analysis allows us to determine the relationship between large boulders’ impact force (F), the debris flow force per unit height (P d) and the ultimate bending moment of the column (M u) (see Appendix).
where a is the distance between the bottom and the horizontal location of grains (m) and L is the height of the columns (m).
The debris flow force per unit height can be calculated by Eq. (1), considering the characteristic-impacted dimension of the column D (Eq. 3), D means the contact length between the cross-section of the column and the debris flow (m), which is the width of the column in this paper. The impact force of large boulders mixed in the debris flow can be calculated by Mizuyama’s model (1979) in which g is the acceleration due to gravity (m/s2).
The critical velocity of debris flow and particle size of the grains when the bending moments reach M u were calculated according to the failure mechanism of the column subjected to uniformly distributed load and particle load (Eq. 5).
It is known that the flexural capacity of columns is significantly affected by the axial load in them. According to the field investigation, we found that most common RC buildings in mountain areas of Western China, especially the buildings in debris-flow-prone areas, usually have three to five storeys. Therefore, the average axis load in the columns of three-storey RC buildings was estimated. In order to simulate the actual ultimate state of RC columns, M u was obtained by applying the limit states theory, utilizing the characteristic values of the materials’ strength (concrete and rebar steel).
Three plastic hinge formation mechanism in reinforced concrete columns
The columns are fixed at the ends, with prevented horizontal displacements and restrained rotation at the top. The static scheme of the columns impact by debris flow and large boulders is described in Fig. 4. The collapse mechanism is represented by the formation of three plastic hinges at the end and in the midspan of the columns, where the bending moments reach the ultimate value M u. Therefore, the ultimate bending moment was used to calculate the critical velocity and diameter of particles.

Three plastic hinge mechanism for reinforced concrete column
The application of the static or kinematic theorem of the limit analysis allows us to determine the relationship between large boulders’ impact force (F), the debris flow force per unit height (P d) and the ultimate bending moment of the column (M u) (Eq. 6) (see Appendix).
where m is the distance between the ends of the column, and the cross-section in the column reaches the ultimate bending moment (a ≤ m ≥ 1/2 L).
The critical velocity of debris flow and particle size of the grains when the bending moments reach M u were calculated according to the failure mechanism of the column subjected to uniformly distributed load and particle load (Eq. 7).
Shear failure mechanism in reinforced concrete columns
The shear collapse of RC columns is related to the cases in which the damage is concentrated in a section of one column impacted directly by the debris flow or large boulders. The failure is mainly due to the concrete strut or steel tie being damaged in the column. The shear collapse mechanism of RC columns is described in Fig. 5, and the relationship between the large boulder impact force (F), the debris flow force per unit height (P d) and the ultimate shear resistance of column (T u) can be expressed with Eq. 8 (see Appendix).

Shear collapse mechanism for reinforced concrete column. a The damage occurs at the ends of the column. b The damage occurs in the section directly impacted by boulders
where T u is the ultimate shear resistance of the column subjected to debris flow, R′ represents the critical value of the particles’ diameter, which determines the damage location in the column (m). If the grain size of the boulders exceeds the critical value (R′), the section of the column directly hit by boulders will be damaged (Fig. 5b). Otherwise, the end of the column will be damaged (Fig. 5a).
The ultimate resistance shear T u of the column is related to the crushing failure of the compressed strut and to the tension failure of the steel stirrups respectively (Eq. 9).
where f tk is the concrete tensile characteristic strength (N/mm2), B (mm) is the width of the column, h 0 represents the depth of compression zone (mm), f yv is the stirrup’s tensile characteristic strength (N/mm2) and is equal to 360 N/mm2; if the characteristic strength is higher than 360 N/mm2 (MOHURD 2010a), A sv is the cross-sectional area of stirrups crossing the crack (mm2) and s is the stirrup’s spacing (mm).
The critical velocity of the debris flow and the particle size of the grains when the ultimate shear resistance T u is reached were calculated according to the failure mechanism of the column subjected to uniformly distributed load and particle load (Eq. 10).
Calculation of critical debris flow velocity and diameter of particles
The models are applied to estimate the critical characteristic of debris flow/boulder (the lower bound velocity that can cause the damage). The results can be useful for evaluating the damaged level of the building in field investigations of debris flows and help to assess the risk to buildings in a debris-flow-prone area.
RC column dimensions and reinforcements
Before the calculation of damage condition, the ultimate bearing capacity of the column should be clarified. According to China’s Code for the Design of Buildings (MOHURD 2010b) and Code for the Design of Concrete Structures (MOHURD 2010a), three typical types of RC columns, commonly used in many mountain areas of Western China, were selected for the analysis (Fig. 6). The concrete grade C30, with characteristic compressive strength f ck of 20.1 N/mm2 and characteristic tensile strength f tk of 2.01 N/mm2, was taken into account. HRB400 reinforcing bars, with characteristic strength f stk 540 N/mm2, were used for longitudinal bars (Φ14 mm) and stirrups (φ8@200(2)). The ultimate bending moment (M u) and shear strength (T u) are reported in Table 2.

Cross-section of the reinforced concrete column. a Low-reinforced, b medium-reinforced, c strongly reinforced
Critical debris flow velocity and particle size for column collapse with two plastic hinge formation
The critical velocity and particle size were calculated for viscous (2,000 kg/m3) and dilute (1,500 kg/m3) debris flow using Eq. (5). The coefficient k in Eq. (3) is 3 for viscous debris flow (Zhang 1993) and 1.5 for dilute or turbulent muddy type flow (Hungr et al. 1984; VanDine 1996), where the characteristic-impacted dimension of the column D is 0.3 m. The results are as follows.
-
(1)
It can be observed that the failure curves of viscous debris flow are below those of diluted debris flow (Fig. 7), which means that columns are more vulnerable under viscous debris flow impact. Therefore, the upper limits of resistance for each type of RC column are the curves of diluted debris flow, and the lower limits are the viscous debris flow curve. Columns are damaged completely when the critical velocity or diameter of particles is above the upper limit, while the column will remain intact while under the lower limits.
Fig. 7 
Critical condition of the columns’ collapse with the formation of two plastic hinges
-
(2)
The critical velocities are 4.2–6.8 m/s for low-reinforced RC columns when the debris flow does not contain large boulders. For medium and strongly reinforced RC columns, the critical velocities are 6.3–10.4 and 7.6–12.4 m/s. When the diameter of particles increases to 2.7 m, the critical velocity decreases to 0.2–0.9 m/s.
-
(3)
The columns are more vulnerable when large boulders are concentrated at 0.5 h (maximum depth) of the viscous debris flow compared to 0.6 h. For a strongly reinforced column, if the diameter of large grains is assumed to be 0.9 m, the critical velocity of the debris flow is 2.5 m/s for particles concentrated at 0.5h, and the velocity is 2.9 m/s if particles are concentrated at 0.6 h. For diluted/turbulent muddy type debris flow, the columns are more vulnerable when large boulders are concentrated at 0.33 h than at 0.2 h, and the velocities are 3.5 and 5.0 m/s, respectively, when the diameter of large boulders is 0.9 m.

Critical debris flow velocity and particle size for column collapse with three plastic hinge formation
The critical velocity and particle size were calculated for viscous (2,000 kg/m3) and dilute (1,500 kg/m3) debris flow by Eq. (7), and the results are as follows:
-
(1)
Columns are more vulnerable when particles are concentrated on 0.5 h for viscous debris flow and 0.33 h for diluted debris flow. The failure curves for viscous debris flow are below those for dilute flow (Fig. 8), which reveals that the kinetic energy of viscous debris flow is larger than that of dilute flow.
Fig. 8 
Critical condition of the columns collapse with the formation of three plastic hinges
-
(2)
The critical velocities are 8.3–13.6 m/s for low-reinforced RC columns when the debris flow does not contain large boulders. For medium and strongly reinforced RC columns, the critical velocities are 12.7–20.7 and 15–24.9 m/s. When the diameter of particles increases to 2.7 m, the critical velocity decreases to 0.3–1.2 m/s.
-
(3)
By comparing the failure curves for viscous and dilute debris flow, the damage curve for two plastic hinge collapse is far below the curve for three plastic hinge collapse (Figs. 7 and 8). When the column was only subjected to the impact pressure of debris flow, the critical velocity of three plastic hinge collapse is roughly twice that of a two plastic hinge collapse. When the size of particles increased to 2.7 m, the critical velocity of the three plastic hinge collapse decreased to 1.3 times that of a two plastic hinge collapse.

Critical debris flow velocity and particle size for column failure by shearing
The critical velocity and particle size were calculated for viscous (2,000 kg/m3) and dilute (1,500 kg/m3) debris flow by Eq. (10), and the results are as follows:
-
(1)
The critical velocities are 7.3–12 m/s for low-reinforced RC columns when the debris flow does not contain large boulders. For medium and strongly reinforced RC columns, the critical velocities are 8.7–14.2 and 9.6–15.7 m/s. When the diameter of particles increases to 2.7 m, the critical velocity decreases to 0.2–0.4 m/s.
-
(2)
By comparing the failure curves for viscous and dilute debris flow (Fig. 9), it can be seen that when the particle size is larger than 0.5 m, the damage caused by the two types of debris flow are almost the same. Otherwise, the damage curve for viscous debris flow is below that for diluted flow, which reveals that the kinetic energy of viscous debris flow is larger than that of dilute flow. Figure 9 also demonstrates that the critical size of particles is 0.5 m. This critical size can determine whether the impact force of the particles or the impact pressure of the debris flow is responsible for the column damage. Therefore, 0.5 m should be the critical diameter to distinguish the effects of large boulders and debris flow impact pressure, which means that the column failure may be caused by the impact force of large boulders when the grain size is larger than 0.5 m. On the other hand, if the particle size is smaller than 0.5 m, the column failure may be caused by both the dynamic pressure of debris flow and the impact of particles.
Fig. 9 
Critical condition of the column collapse by shearing

Application of the models to debris flow hazard in Zhouqu
A five-storey RC frame building in Zhouqu, subject to debris flow hazard, was taken as an example to study the critical velocity of debris flow (Fig. 1(1-7)). The building was struck directly by debris flow on the ground floor and most of the columns failed, which led to the collapse of the building. It was observed that the failed columns fitted the shearing failure model without three plastic hinges being formed on the column. Therefore, the critical velocity of debris flow should be between these two models.
The debris flow on 7 August 2010 in Zhouqu, Western China, was a viscous debris flow, with an estimated density of 2,000 kg/m3. Most boulders were 1–5 m in diameter scattered within an area less than 550 m from the outlet of the gully. After the debris flow moved down to the residential area of the town, the size of particles mixed in the debris flow became 10–40 cm (Li et al. 2011), so the diameter of the particles impacting on the columns was assumed to be 40 cm. The geometry of the column determined from the survey is consistent with the lower reinforced column introduced in ‘RC column dimensions and reinforcements’, with a bending and shear capacity of 70 kN m and 145 kN, respectively. Equations (7) and (10) were used to calculate the critical velocity of the debris flow. When large boulders were mixed in the debris flow impact on 0.5 h and 0.6 h, the critical velocities are 4.5 and 5.1 m/s for the shearing failure model and 4.8 and 5.2 m/s for three plastic hinge collapse. Therefore, it can be calculated that the velocity of debris flow is 4.5–5.2 m/s in front of the building, as shown in Fig. 1(1-7).
The velocity of the debris flow at the outlet of the gully was about 6–13 m/s (Hu et al. 2010; Tang et al. 2011; Liu et al. 2011; Hu et al. 2011b). Liu et al. (2011) calculated the velocity when the debris flow reached the residential area of the town (where the elevation is 1,340 m and the distance from the outlet is 2 km) by using the Manning formula (Fig. 10), and the calculated result was 4.25 m/s. In comparison with our study, the result of the study of Liu et al. (2011) was lower. The reason is that the building considered in our research is upstream of the calculated section in the paper of Liu et al. (Fig. 10). When debris flow moves down through the building area, the kinetic energy is exhausted by the resistance and restriction of buildings, and therefore, the value resulting from our study is higher than the value obtained by Liu et al.

The location where the velocity of debris flow was calculated in Zhouqu County (photo from the National Administration of Surveying, Mapping and Geoinformation of China, 10 August 2010)
Conclusion and discussions
The destruction of RC frame structures is mainly caused by the collapse of beams and columns, and the collapse model can be described using the two/three plastic hinge mechanism. The objective of this paper is to estimate the critical velocity of debris flow when columns are damaged by debris flow and particles using theories of material and structural mechanics.
The results suggest that the type of debris flow, the size of particles in the flow and the impact location significantly influence the critical condition.
-
(1)
For the same diameter of grains in the two types of flows, the energy of viscous debris flow is much larger than that of the dilute flow, and there will be more severe damage for columns under viscous flow impact. Compared to diluted flow in which the boulders frequently move at the bottom of the flow, the boulders in a viscous debris flow move in the middle or at the top of the flow because this type of flow has a higher density, higher fine sediment concentration and stronger floating force (Fei and Shu 2004; Hu et al. 2011a). Differences in flow type may contribute to the differences in the critical failure conditions.
-
(2)
The columns were more vulnerable when large boulders were concentrated in one half of the maximum depth for viscous debris flow than when they were concentrated in 0.6 h (the former curve is under the latter one, as shown in Figs. 7, 8 and 9). For a dilute/turbulent muddy type debris flow, the columns were more vulnerable when large boulders were concentrated in h/3 than when they were concentrated in h/5.
-
(3)
We believe that 0.5 m is the critical diameter for distinguishing the dominant effect of large boulders and debris flow impact pressure. The column may be damaged by the impact force of large boulders when the grain size is larger than 0.5 m, and if the particle size is smaller than 0.5 m, the columns are damaged by both the dynamic pressure of debris flow and the impact of particles.
In this research, some simplifications and assumptions were made for columns and debris flow based on survey data. The column was taken as a vertical member fixed at both ends, and the failure condition of the column was described with the formation of plastic hinges at the ends or in the midspan of the column. This may be applicable to most collapsed buildings in our investigation, especially in cases where the debris flow impact energy is much smaller than the joint resistance energy of the structure. It is not practical to monitor the building damage during the debris flow event, and it is also difficult to simulate the dynamic behaviour of buildings under the debris flow impact process. More research should be focused on analysing the vertical distribution and temporal process of the debris flow impact force, and then the deformation behaviour of buildings under the impact process can be calculated by considering the stiffness and characteristics strength of the structure.
The present work has its limits owing to the assumptions and simplifications made in the calculation. Nevertheless, it has allowed us to find some credible values for the critical condition of RC columns damaged by the Zhouqu debris flow. In order to improve the resistance of buildings to debris flow, active and passive methods are suggested as follows. On the one hand, large stones mixed in the debris flow should be intercepted as far as possible since large boulders are the main cause of column damage if they are larger than 0.5 m. It is better to block the debris flow slurry as soon as possible for viscous and dilute debris flows with few particles in order to reduce the kinetic energy of the debris flow. On the other hand, the ends of columns should be reinforced because most of the damage (plastic hinges) starts from the ends. Increasing the number and strength of the steel bars in the RC column will improve its capacity against bending and shearing. In addition, the ground floors of the buildings should be emptied so that the debris flow can pass through smoothly, reducing the material deposition and energy accumulation in front of the building.
References
Bayrak O, Sheikh SA (2001) Plastic hinge analysis. J Struct Eng 127(9):1092–1100
Faella C, Nigro E (2003) Dynamic Impact of the Debris Flows on the Constructions during the Hydrogeological Disaster in Campania-1998: Failure Mechanical Models and Evaluation of the Impact Velocity. In: Picarelli L(eds)Fast slope movements prediction and prevention for risk mitigation. Proc.FSM 2003 Conference, Sorrento, Italy
Fei XJ, Shu AP (2004) Movement mechanism and disaster control for debris flow. Tsinghua University, Beijing (in Chinese)
Fuchs S, Heiss K, Hübl J (2007) Towards an empirical vulnerability function for use in debris flow risk assessment. Nat Hazards Earth Syst Sci 7:495–506
He SM (2010) Calculation of compact pressure of rock-fall on shield structures. Eng Mech 27(9):175–180 (in Chinese)
Hu KH, Ge YG, Cui P, Guo XJ, Yang W (2010) Preliminary analysis of extra-large-scale debris flow disaster in Zhouqu county of Gansu province. J Mt Sci 28(5):628–634 (in Chinese)
Hu KH, Wei FQ, Li Y (2011a) Real-time measurement and preliminary analysis of debris-flow impact force at Jiangjia Ravine, China. Earth Surf Process Landforms 36(9):1268–1278
Hu XD, Wang GL, Zhao C (2011b) Analyses of characteristic values for Sanyanyu debris flow in Zhouqu county on August 8, 2010. Northwest Geol 44(3):44–52 (in Chinese)
Hu KH, Cui P, Zhang JQ (2012) Characteristics of damage to buildings by debris flows on 7 August 2010 in Zhouqu, Western China. Nat Hazards Earth Syst Sci 12:2209–2217
Huang HP, Yang KC, Lai SW (2007) Impact force of debris flow on filter dam. In: Geophysical Research Abstracts. European Geosciences Union-General Assembly, Vienna, Austria, pp 03218
Hungr O, Morgan GC, Kellerhals R (1984) Quantitative analysis of debris torrent hazards for design of remedial measures. Can Geotech J 21(4):663–677
Iverson RM (1997) The physics of debris flows. Rev Geophys 35(3):245–296
Kiyono JJ, Spence RJS, Nakshiwa T (2006) Dynamic behavior of masonry structures under pyroclastic flows. J Nat Disaster Sci 26(2):73–83
Li ZH, Zhu LF, Hu XD, Yu GQ, Jia GY, Li RD (2011) Basin zoning characteristics of Sanyanyu extremely big debris flow gully [J]. Northwest Geol 44(3):38–43 (in Chinese)
Liu CZ, Miao TB, Chen HQ (2011) Basin feature and origin of the ‘8.8’ mountain torrent-debris flow disaster happened in Zhouqu County, Gansu, China, Aug. 8, 2010. Geol Bull China 30(1):141–150 (in Chinese)
López JL, Perez D, Garcia R (2003) Hydrologic and geomorphologic evaluation of the 1999 debris flow event in Venzuela. In: Rickenmann D, Chen CL (eds) 3rd International Conference on Debris-flow Hazards Mitigation: Mechanics, Prediction, and Assessment. Millpress, Rotterdam, pp 13–15
Luna BQ, Blahut J, van Westen CJ, Sterlacchini S, van Asch TWJ, Akbas SO (2011) The application of numerical debris flow modelling for the generation of physical vulnerability curves. Nat Hazards Earth Syst Sci 11:2047–2060
Mileti DS, Bolton PA, Fernandez G (1991) The Eruption of Nevado del Ruiz Volcano, Colombia, South America, November 13,1985. National Academy, Washington D. C
Mizuyama T (1979) Computational method and some considerations on impulsive force of debris flow acting on sabo dams. J Jpn Soc Erosion Control Eng 11(2):40–43 (in Japanese)
MOHURD (2010a) Code for design concrete structures (GB 50010–2010). Beijing: Chinese Architectural Industry (Ch). 34–80(in Chinese)
MOHURD (2010b) Code for design of buildings (GB 50011-2001(2008version)). Beijing: Chinese Architectural Industry,(Ch). 42–62(in Chinese)
Papathoma-Köhle M, Keiler M, Totschnig R, Glade T (2012) Improvement of vulnerability curves using data from extreme events: debris flow event in South Tyrol. Nat Hazards 64(3):2083–2105
Petrazzuoli SM, Zuccaro G (2004) Structural resistance of reinforced concrete buildings under pyroclastic flows: a study of the Vesuvian area. J Volcanol Geoth Res 133(1–4):353–367
Prochaska AB, Santi PM, Higgins JD (2008) Relationships between size and velocity for particles within debris flows. Can Geotech J 45(12):1778–1783
Proske D, Suda J, Hübl J (2011) Debris flow impact estimation for breakers. Georisk Assess Manag Risk Eng Syst Geohazards 5(2):143–155
Spence RJS, Baxter PJ, Zuccaro G (2004) Building vulnerability and human casualty estimation for a pyroclastic flow: a model and its application to Vesuvius. J Volcanol Geoth Res 133(1–4):321–343
Takahashi T (1980) Debris flow on prismatic open channel. J Hydraul Div 106(3):381–396
Tang C, Rengers N, van Asch WJ, Yang YH, Wang GF (2011) Triggering conditions and depositional characteristics of a disastrous debris flow event in Zhouqu city, Gansu Province, north western China. Nat Hazards Earth Syst Sci 11:2903–2912
Totschnig R, Sedlacek W, Fuchs S (2011) A quantitative vulnerability function for fluvial sediment transport. Nat Hazards 58(2):681–703
Toyos G, Oppenheimer C, Pareschi M, Sulpizio R, Zanchetta G, Zuccaro G (2003) Building damage by debris flows in the Sarno area, Southern Italy. In: Rickenmann D, Cheng LC (eds) Debris-flow hazards mitigation: mechanics, prediction and assessment. Millpress, Rotterdam, pp 1209–1220
Toyos G, Gunasekera R, Zanchetta G, Oppenheimer C, Sulpizio R, Favalli M, Pareschi MT (2008) GIS-assisted modelling for debris flow hazard assessment based on the events of May 1998 in the area of Sarno, Southern Italy: II. Velocity and dynamic pressure. Earth Surf Proc Land 33(11):1693–1708
VanDine DF (1996) Debris flow control structures for forest engineering. British Columbia. Res. Br., B.C. Min.For., Victoria, B.C., Work. Pap
Watanabe M, Ikeya H (1981) Investigation and analysis of volcanic mud flows on Mount Sakurajima Japan. Erosion sediment transport measurement. International Association on Hydrology, Florence. Sci Publ 133:245–256
Wei H (1996) Experimental study on impact force of debris flow heads. China Railw Sci 17(3):50–62 (in Chinese)
Yamaguchi I (1985) Erosion Control Engineering,, ISBN: 4-8049-5064-8
Yang HJ, Wei FQ, Hu KH (2011) Experimental study on vertical sorting of particles in debris flow with impact signals [J]. J Catastrophology 26(4):29–34 (in Chinese)
Zanchetta G, Sulpizio R, Pareschi MT, Leoni FM, Santacroce R (2004) Characteristics of May 5–6, 1998 volcaniclastic debris flows in the Sarno area (Campania, southern Italy) relationships to structural damage and hazard zonation. J Volcanol Geoth Res 133:377–393
Zanuttigh B, Lamberti A (2006) Experimental analysis of the impact of dry avalanches on structures and implication for debris flows. J Hydraul Res 44(4):522–534
Zhang SC (1993) A comprehensive approach to the observation and prevention of debris flows in China. Nat Hazards 7(1):1–23
Zhang Y, Wei FQ, Wang Q (2007) Experimental research of reinforced concrete buildings struck by debris flow in mountain areas of western China. Wuhan Univ J Nat Sci 12(4):645–650
Acknowledgments
This work has been supported by a grant from the Key Programs of the Chinese Academy of Sciences (Grant No. KZZD-EW-05-01) and the National Natural Science Foundation of China (41030742).
Author information
Authors and Affiliations
Corresponding author
Appendices
Appendix
Three models to calculate the critical condition of debris flow/grains are presented in this Appendix.
-
(1)
The first is the two plastic hinge model. The ground floor columns were assumed to be bars fixed at the bottom, with free horizontal displacement and restrained rotation at the top. The free body diagram is shown in Fig. 11.
Fig. 11 
Free body diagram of column with formation of plastic hinges at the ends

When the external moment increases to the ultimate moment of the column (M u), the ends of the column firstly develop a plastic zone, and the column soon collapses. According to the equilibrium condition of the left end of the column, Eq. 11 can be derived.
Therefore, the relationship of large boulders’ impact force (F), the debris flow force per unit height (P d) and the ultimate bending moment of column (M u) can be expressed with Eq. 12.
-
(2)
The second is the three plastic hinge model. The free body diagram is shown in Fig. 12.
Fig. 12 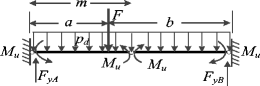
Free body diagram of column with formation of plastic hinges at the ends and midspan

There will be plastic zones appearing firstly at the ends, but with an increase in external moment, another plastic zone develops in the midspan of the column. The distance between the final plastic hinge and the left end is assumed to be m. According to the equilibrium condition, the support reaction F yA of the left end can be derived.
By taking the left side of the column as an equilibrium condition, Eq. 14 can be derived.
The F yA in Eq. 14 can be substituted by Eq. 13. The relationship of large boulders’ impact force (F), the debris flow force per unit height (P d) and the ultimate bending moment of column (M u) can be expressed with Eq. 15.
-
(3)
The third is the shearing model. The free body diagram is shown in Fig. 13.
Fig. 13 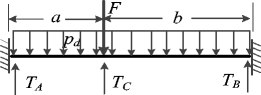
Free body diagram of column by shearing

There are three possible breaking sections for shearing failure. If column impact is from a small boulder, the ends would be damaged first, and the shear strength of the ends T A and T B can be calculated by Eqs. 16 and 17. When a is greater than b, the ultimate shear resistance T u is equal to T A , otherwise, T u is equal to T B . If column impact is from a large boulder, which makes the shear strength of T C greater than that at ends, section C would be damaged first, and the T C is equal to T u.
If b is greater than a, the critical velocity of debris flow and particle size of the grains can be determined by Eq. 18.
Notation index
The following symbols are used in the paper:
- P :
-
Dynamic pressure of debris flow (N/m2)
- P d :
-
Dynamic pressure of debris flow per unit height (N/m)
- ρ :
-
Density of debris flow (kg/m3)
- v :
-
Debris flow velocity (m s−1)
- θ :
-
Smallest angle between the direction normal to the face of the barrier and the flow direction
- k :
-
Empirical factor in hydraulics model which depends on the flow type
- F :
-
Impact force of large boulder (N)
- R :
-
Diameter of large boulder (m)
- R':
-
The critical value of particle’ diameter which determines damage location in the column (m)
- M :
-
Boulder mass (kg)
- c and n :
-
Coefficients which describe the character of barrier material
- K :
-
Stiffness factor of structure
- E:
-
Young’s modulus (N/m2)
- J :
-
Inertia moment of transverse square to neutral axis (m4)
- G′:
-
Weight of the boulder which is submerged in the debris flow (N)
- M u :
-
Ultimate bending moment of column (N m)
- g :
-
The acceleration owing to gravity (9.8 m/s2)
- D :
-
The contact length between the cross-section of column and debris flow (m), which is the width of the column in this paper
- a and b :
-
The distances between the ends and the horizontal location of grains (m)
- L :
-
Length of the column (m)
- T u :
-
Ultimate resistance shear of the column (N)
- f tk :
-
The concrete tensile characteristic strength (N/mm2)
- B:
-
Width of the column section (mm)
- h 0 :
-
Depth of compression zone (mm)
- f yv :
-
Stirrups’ tensile characteristic strength (N/mm2)
- A sv :
-
Cross-sectional area of stirrups crossing the crack (mm2)
- s :
-
Stirrup spacing (mm)
- F yA and F yB :
-
Support reaction of the ends of column
- T A , T B and T C :
-
The maximum shear strength of three possible breaking sections along column
Rights and permissions
About this article

Cite this article
Zeng, C., Cui, P., Su, Z. et al. Failure modes of reinforced concrete columns of buildings under debris flow impact. Landslides 12, 561–571 (2015). https://doi.org/10.1007/s10346-014-0490-0
Received:
Accepted:
Published:
Issue Date:
DOI: https://doi.org/10.1007/s10346-014-0490-0