
Abstract
Slope stability analysis is an enduring research topic in the engineering and academic sectors. Probability-based analysis is the most popular method for evaluating a wide range of natural slope instability risks, but the lack of landslide data limits its application. A new method of regional slope stability analysis is presented that combines spatial analysis and two-dimensional slope analysis. First, a region is divided into slope units based on terrain and hydrology analysis, and the main potential slip sections of slope units are determined. Second, the potential slip surface of each section is determined and stability factors calculated with a two-dimensional slope analysis model. Finally, regional slope stability analysis is determined from the results of slope unit segmentation and slope stability analysis. A loess gully zone in Jintai District, Baoji City, China, constitutes the study area. A topographic map is transformed into a digital elevation model and evaluation zones determined by slope unit segmentation. A 3D geological model is devised from survey, drilling and investigation data. Geological profiles are generated automatically and slope stability analysis performed immediately with the small tool developed herein. Lastly, a map of regional slope assessment is produced. The method proposed combines the two-dimensional limit equilibrium method and spatial analysis, which are the methods usually used in engineering practice. It can provide not only a distribution map of safety factors, but also the scale and location of most dangerous slip surfaces. This study provides a new way to assess the natural slope risk of large areas.
Introduction
Landslide is among the most damaging natural disasters in China, and landslide susceptibility mapping naturally plays an important role in disaster prevention. Probability-based analysis is the most popular method for evaluating a wide range of natural slope instability risks effectively and quantitatively. Such methods focus on factors related to slope stability, such as topography, geomorphology, geological structures, lithological, vegetation and human activities, etc. (Cheng et al. 2001; Conoscenti et al. 2008; Guzzetti 2000; Li and Zhou 2012; Perotto-Baldiviezo et al. 2003; Rowbotham and Dudycha 1998; Saldivar-Sali and Einstein 2007; Xu et al. 2012). According to a specific method, such as classification, assignment, normalization, etc., we apply overlaying analysis to each factor, and a regional risk zoning map is produced from the comprehensive evaluation results. The method has been widely used and achieved a large number of research results (Guzzetti 2000; Perotto-Baldiviezo et al. 2003; Xu et al. 2012). The applications of the method are limited, however, because a large amount of landslide survey data is needed to determine each factor of slope stability. It should also be performed in several areas particularly subject to landslide disaster, but the analysis model established from investigation data applies only to those areas that have the same topographic and geological conditions. In addition, important information, such as the possible position of slip, landslide scale, etc., cannot be obtained by this method because of the lack of an appropriate mechanical theory.
Slope stability evaluation methods based on the principle of mechanics, in particular the two-dimensional limit equilibrium method, have been widely used for a long time. Since the 1990s, with the development of computer technology, deterministic methods have been applied to regional slope risk evaluation. The terrain stability models SINMAP and SHALSTAB, which combine steady-state hydrology assumptions with the infinite slope stability model to quantify shallow slope stability, are very suitable for analysis of regional shallow landslides (Listo and Carvalho Vieira 2012; Meisina and Scarabelli 2007; Tarolli et al. 2011). However, they are 1D models and only suitable for rain-induced shallow landslides. Zolfaghari and Heath (2008) present a GIS application for assessing landslide disaster on a large scale whereby the slope is analyzed by means of a non-circular failure envelope with estimated soil properties, groundwater levels, earthquake and surcharged loadings. In this article, rectangular zones with a 200-m-long side are divided and the section lines determined manually. Grenon and Hadjigeorgiou (2010) developed a slope stability analysis tool that employs geographical information system techniques to provide visualization and establish stability susceptibility zones along the pit and both kinematic and limit equilibrium stability analyses for bench and inter-ramp design. Xie et al. (2004, 2006) devised new correspondent GIS grid-based 3D deterministic models to calculate the safety factor of the slope. Monte-Carlo simulation and a GIS-based 3D limit equilibrium model have been used to locate the critical slip surface and calculate the corresponding safety factor in each slope divided by slope units (Jia et al. 2012). These studies have provided very good ideas for regional evaluation. Although a 3D model can reflect the actual situation of a slide, three-dimensional stability analysis methods are difficult in terms not only of theory and geometric modeling, but also of the search for critical slip surfaces and calculation of stability. Two-dimensional stability analyses are generally preferred in engineering over one- and three-dimensional stability analyses, and the main method of slope stability analysis remains the two-dimensional limit equilibrium method.
In order to evaluate the natural slope instability risk of a wide area effectively and quantitatively, this article presents a method that combines spatial analysis and two-dimensional mechanical slope analysis for regional slope stability analysis. It can obtain not only a distribution map of safety coefficients, but also the scale and location of most dangerous slip surfaces. This study provides a new way to assess the natural slope risk of large areas.
Regional slope stability analysis methods
Three-dimensional geological model
A three-dimensional geological model is required for assessing landslide disaster on a large scale. Generally, such a model can be divided into a surface model, entity model and mixed model (Pan et al. 2007). A surface model is made up of a series of surfaces, such as the ground surface, formation interfaces and outlines of buildings or underground structures, etc., and divided into two types: a triangular irregular network (TIN) and regular square grid (grid). A TIN model is a vector-based representation of the land surface, made up of irregularly distributed nodes and lines with three-dimensional coordinates that are arranged in a network of non-overlapping triangles. In contrast, a grid model represents land as an array of equally sized square cells arranged in rows and columns. A multi-layer grid method (Fig. 1a) is employed to set up the three-dimensional geological model in this article because of its simple data structure and ease of use. A multilayer grid geological model can also be converted into a three-dimension object model (Fig. 1b).

Geological model
The interfaces used in the model mainly include the ground, layer interfaces, water level and so on. A topographic map can be used to generate a grid of the ground. Ground elevation is easy to obtain, and it is very precise compared with other interfaces. Generally, the data on the strata interfaces and water level are limited. We can extract stratigraphic points from interfaces in drillings and the points from the boundaries of different stratums, which can be used as control points in interpolation. A Kriging interpolation algorithm can be used to optimize the initial surface and is a very good method for curved surface fitting in geology. According to the relationship between layers, we perform Boolean operations to generate a multi-layer grid geological model (Fig. 1a).
Slope unit segmentation
In large-scale landslide stability analysis, a key problem is how to extract mapping units as study objects. The slope formation is a combination of a long-term geological process, hydrological effects and other external factors. In the process of geological disaster, such as landslide and collapse, topography is always considered to be the main control factor. The slope unit, namely the proportion of land surface that contains the maximum internal homogeneity differing from adjacent units, has relatively similar topographic and geological characteristics (Jia et al. 2012; Xie et al. 2006). It is the basic geomorphic unit where a geological disaster occurs.
A slope unit can be considered as the left or right part of a catchment. Therefore, it can be identified by a ridge line and a valley line (Fig. 2). The hydrological tool of the GIS enables the catchment polygon and the stream line of a study area to be obtained easily from the digital elevation model. Topologically, the outline of a catchment polygon can be considered as the ridge line. Considering that water always flows downhill along the path of the steepest descent, the stream line, which is based on flow accumulation, can be looked on as part of the valley line in a mountainous area. However, with a flow accumulation grid, streams are defined by the use of a threshold drainage value, which means that only areas whose flow accumulation values are greater than the threshold value can be considered as streams. Consequently, there is no way to generate all parts of a valley line through streams. An alternative method must be used. Assuming that the terrain is reversed, the valley line will become a ridge line. If the catchment of this reversed terrain is generated, the edge of the catchment is, in fact, the valley of the original terrain. On this assumption, the valley line can be obtained. Dividing the catchment of the original DEM by the valley line, the distribution of slope units can eventually be generated. Figure 3 shows the division of slope units.

Division of the slope unit

Flow chart of slope unit division
Extraction of section
In order to analyze the stability of a slope unit, we need to make up the profile first. The procedure of section extraction has two parts, determination of the position of the section line and profile extraction.
-
1.
Determination of the section line It is important to determinate the position of the section line. Generally, the section should be selected representatively, and its direction should be consistent with the potential main sliding direction. With the spatial analysis tools of the GIS, the terrain factors of each zone in a slope unit, such as slope angle, slope direction, etc., can be calculated. Statistics show that slope directions of zones are approximate to normal distribution in a slope unit, so we can take the average slope direction as the main sliding direction. The line is determined as the section line in this article, which crosses the slope unit mass center point, and is consistent with the average slope direction.
-
2.
Generation of the profile GIS software largely provides the function of section cutting. Generally, it can only generate a surface profile, however. Much research has been done on geological profile generation, and some progress has been made toward a geological section data model and technology for profile generation, inter alia. Geological profile generation remains a problem, as there is no universal method that is applicable. A simple method has been chosen in this article, however, based on the multilayer grid geological model.
First of all, a section line is divided into segments in accordance with nodes and grid size. Then the intersection points of the section line and each layer of the model are determined. To obtain the elevation of each intersection point, we perform interpolation on each one. The elevations of the start point and end point are interpolated by four grid nodes surrounding them and the elevations of the nodes obtained with the linear interpolation method. Finally, polylines are drawn according to the intersection points, and then the profile is generated (Fig. 4).

Generation of the profile
Stability analysis
There are many models of slope stability analysis based on two-dimensional limit equilibrium such as the Fellenius method, Bishop method, Janbu method, Sarma method, Spencer method, etc. The most commonly used method is Bishop’s simplified method, which is good for shallow sliding surfaces and tends to be more conservative than the general Bishop method. Therefore, it is used in this article to conduct a series of stability analyses.
The primary goal of slope stability analysis is to determine the potential slip surface whose safety factor is overall minimum. Generally speaking, the shape of the slip surface can be divided into two categories. One is the regular slip surface, shaped as a line, arc, logarithmic spiral line, parabola, etc. The other is the irregular slip surface, shaped as a polyline or spline that is controlled by a series of points. Although a variety of optimization techniques combined with a search method have been carried out, the circular slip surface remains the dominant search method, and it is available in much of the software for slope stability analysis. The slope search method is used in this article to look for the potential slip surface and define the search in terms of areas of the slope surface rather than a grid of slip centers. If a potential slip surface is generated below the rock interface, then the geotechnical interface is set as the potential slip surface (Fig. 5).

Search for slip surface
Program
GIS provides a common platform for spatial database management and spatial data processing, analysis, output, etc., but the common GIS softwares provide only some basic tools and are unable to deal with certain special requirements. For the operations of profile generation, slip surface search and stability coefficient calculation, we need to develop a program. A regional stability evaluation program is therefore developed in VS.net, and its flow chart can be seen in Fig. 6. The program can read files in GIS formats, extract profiles automatically, access stability and convert the results to GIS data.

Flow chart of regional slope stability assessment program
Example of regional slope stability assessment
Study area
The location of Baoji City in Shanxi Province is shown in Fig. 7. It is not only an important transportation hub in China, but also one of the areas worst hit by landslides. By 2010, over 230 people had died from various landslides in Baoji City.

Location of the study area
Landslide inventory mapping is the most fundamental step in landslide susceptibility and hazard modeling. Between 2009 and 2010, a detailed investigation of geological disasters in Baoji City was carried out, and a landslide inventory map of Baoji City was created. The author participated in this project and had detailed files on landslides in this area. The landslide inventory map of this area has been prepared at a scale of 1:10,000 based on field investigations and analysis of available data that included disaster investigation reports and scientific publications.
There are 173 landslide locations in the survey area of Baoji City (Fig. 8). Spatially, these landslides are mainly located on the north slope of the Wei River, both sides of the Changshou Gully and the east bank of the Jingling River. Morphologically, the landslides have obvious armchair-like terrains and loess cliffs. The slope of most landslides is 40°–70° and up to 80° in some cases. The height of the main scarps of landslides is 30–80 m. The slip mass is about 400–800 m long and 200–800 m wide. Notably, the landslides cover at least 96 % of the length of the Wei River’s north slope. The landslides were divided into types considering the composition of the slide mass and slide surface. Loess-mudstone landslides were located mainly on the Wei River’s north slope, which is the edge of the loess plateau. Most of these landslides are deep, made up of loess in the upper layers and silty clay or soft rocks in the lower layers, with shear slip occurring along the interface of the layers. Loess landslides were located mainly on two sides of small gullies, and most of them were shallow landslides. The slide zones formed mainly in the Malan and Lishi loess layers. Most small modern landslides occurred in the inner layer of loess, and the others were resurrections of ancient landslides.

Landslide inventory map of Baoji City
Based on these works, a zone in the Jintai District of Baoji City was selected as the study area (Fig. 7). The method proposed above was verified in this area. The general topography of the study area consists of highlands with altitudes ranging from 585 to 973 m and slope degrees varying between 0° and 65°. The climate is warm, temperate, Continental monsoon with a mean annual precipitation of 600 mm. The climate is mostly affected by altitude, with the amount of precipitation increasing with increasing altitude.
Based on the exploration results, the upper layer of the Neogene Pliocene series is orange clay containing sand, with intercalation of gravel lenses, grey-green clay clumps and light grey calcareous concretions. The lower layer consists of an alternation of orange conglomerate, sandstone and brown sandy mudstone. The strata of Quaternary Lower Pleistocene series are mostly composed of brown loess layers and ancient soil layers, with compact structure and 10–20 m thickness. The strata of the Middle Lower Pleistocene series are brown and brown-greyish loess with an interlayer of ancient brown-red soil of 30–60 m thickness. The strata of the Upper Pleistocene Series are loess of aeolian deposits, which cover the Q 2p strata above and have a 10–15 m thickness. Holocene strata are divided into three genetic types: alluvial, diluvial and landslide deposits. Alluvial deposits are distributed in the high and low river floodplain and terrace and are made up of silty clay, sand and gravel pebbles. Diluvial deposits are distributed in the estuary of the gully. Landslide deposits are mainly distributed in the gully and the front edge of the loess plateau.
Geological model and evaluation unit
The regional slope stability evaluation is based on the establishment of a 3D geological model. The result of the geological model depends on the amount of raw data and the quality of the basic data. The author collected many basic materials during the Baoji geologic hazard survey and evaluation work. The stratum information was obtained by field survey and drilling work. As shown in Fig. 9, the strata of the study area consist of Quaternary Upper Pleistocene series Malan loess (Q 3eolp ), middle Pleistocene series Lishi loess (Q 2eolp ), lower Pleistocene series Wucheng loess (Q 1eolp ), a sandy gravel layer (Q 1alp ), Neogene Pliocene series silty clay, and alternation of sandstone and mudstone.

Geological engineering map. 1 Landslide deposits (QP 4), 2 Malan loess (QP 3eol), 3 Lishi loess (QP 2eol), 4 Wucheng loess (QP 1eol), 5 Sand and gravel layer (QP 1al), 6 Silty clay (N2), 7 Alternation of sandstone and mudstone (N2)
A 3D geological model of the study area was established, and the evaluation unit was divided into sections employing the following methods and using an engineering geology map and drilling data. The process is as follows:
-
1.
Geological model The interfaces used in geological modeling mainly include the ground, layer interfaces, water level and so on. The operation process includes the following steps:
-
(a)
Ground formation Import the topographic map into the GIS, extract the contour lines and elevations, and generate a grid model of the landslide area.
-
(b)
Strata interface generation Extract the stratigraphic points from interfaces in drillings and the points from the boundaries of different strata, adapted as control points. Use a Kriging interpolation algorithm to optimize the initial surface. Depending on the logical relation between layers, perform Boolean operations to obtain the strata interface.
-
(c)
3D geological model generation According to the same range and grid size, the vector layers are transformed into grid layers. Boolean operation is executed among layers, and the geological model is finally cut out. In this article, the planar range is 5.4 km × 4.3 km, and the grid size is 10 m. A 3D geological model of multipatch geometry can also be generated with 3D Analyst in GIS. The 3D geological model is shown in Fig. 10a.
Fig. 10 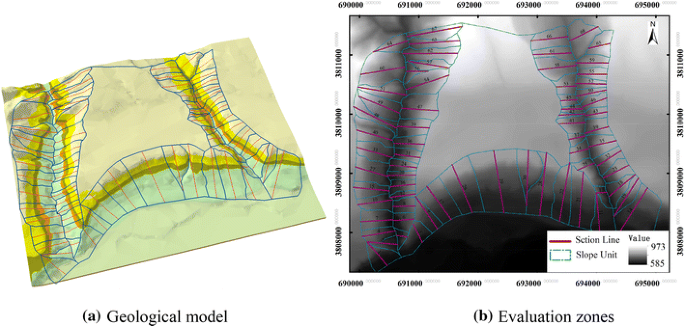
Geological model and evaluation zones
-
(a)
-
2.
Evaluation unit generation The area is divided as shown in “Slope unit segmentation,” and the result is shown in Fig. 10b.

Parameters for analysis
The stability analysis depends not only on the calculation method, but also on the parameters used for analysis. Therefore, how to select reasonable mechanical parameters becomes one of the key issues for stability analysis. According to the stratum structure analysis of the slope, the slope in the area is mainly composed of Quaternary loess and Tertiary silty clay. We analyzed the material composition, physical properties and strength characteristics of the soil layer and the clay layer, which have an impact on slope stability, relying on a large number of samples acquired in 262 drills and exploratory wells in Baoji. The main mineral components of loess are detrital minerals and clay minerals, and the silty clay layers are mainly composed of clay minerals. The loess layer has developed many vertical joints and large pores, and its permeability is high. The high clay content of clay layers leads to a high liquid limit, high plastic limit and poor permeability. Generally speaking, the stability parameters used the data from field and laboratory tests and consulted slope geological conditions and physical characteristics. Based on hundreds of direct shear test results of loess and silty clay under natural and saturated states and referenced landslide research data of the study area, we obtained the parameters of different soil layers (Table 1).
Regional stability analysis
The regional stability analysis procedure is as follows. First, the geological model is established and the evaluation unit divided using GIS. Second, all kinds of interfaces, the evaluation units and other data are exported. Then, the stability of each unit is calculated using the regional stability evaluation software developed in this article. Finally, the regional evaluation results are generated by the connected calculation results and evaluation units.
The software described above uses some search methods for the potential slip surface and a stability algorithm for stability analysis. In this study, the search method of setting an entrance and exit range of the slip surface is applied for potential slip surface searching. The entrance range and exit range are confirmed with the entire slope line. The radius of the search arc is determined as a range of half to five times the length of the potential slip line. The simplified Bishop method is adapted for the calculated stability factor. Because the calculation of the stability coefficient in the Bishop method requires iteration, dichotomy iteration is adopted in the program.
The potential slip surface of each section is determined with the program introduced in this article, and the stability coefficients are classified into four types according to Table 2. The result is shown in Fig. 11. The program can also output any profiles created by cross-section and search results to CAD or GIS systems. Figure 11 also gives the search results of some sections of zones.

Regional slope risk assessment results
From Fig. 11, the districts have some characteristics associated with the topography. Both sides of Changshou Gully and Shashi Gully are mainly high danger and danger zones. The east bank of these two gullies has more high danger areas than the west. The reason is the concentrated rainfall and water sensitivity of loess in the study area. In this region, the river’s lateral erosion is very strong, especially on the east bank of the river, which results in the frequent occurrence of landslides. Because of the narrowness of the loess gully, landslide deposits occupy part of the river, which exacerbates erosion. Therefore, multiple landslides occur on both sides of the gullies. The estuary of Shashi Gully consists mainly of safe zones, where exposed silty clay and sand and gravel layers as well as the Malan loess and Lishi loess have eroded away with lower intensity. Although there are landslides in this area, they are ancient landslides and have been stable. The north slope of the Wei River consists mainly of danger zones, whose degree of danger is less than on both sides of Changshou Gully and Shashi Gully. Since the Middle Pleistocene, the Wei River has migrated to the north. A strong lateral erosion effect has led to high and steep slopes to the north of the Wei River, and a number of large-scale landslides have been produced. These landslides tended to stabilize after intense sliding. The main scarp after sliding with a high slope creates the conditions for a new landslide.
The evaluation results and a series of cross-sections are shown in Fig. 11. From Fig. 11, the most dangerous slip surfaces are mainly located in the Malan loess and Lishi loess layers. The reason is that the loess has low intensity, and the region has a large slope.
As seen in Fig. 12, unstable areas are located in the rear of the landslide, where high and steep slopes are generated by the main scarp of landslides. The locations of unstable regions and the potential slide layers are more consistent with the locations of small modern landslides. This method is shown to have some advantages in landslide hazard analysis of loess gullies.

Potential slip line and landslides
Conclusions
For the evaluation of a wide range of natural slope instability risks, a new method for regional slope stability analysis is presented in this paper, which combines spatial analysis and 2D mechanical slope analysis. First, the study region is divided into slope units according to the terrain, using hydrology analysis in GIS, and then the main potential slip sections of slope units are identified according to their average slope aspect and angle. Second, the potential slip surface of each section is determined, and stability coefficients are calculated on the basis of a 2D mechanical analysis model. Finally, regional slope stability analysis is based on the results of slope unit segmentation and slope stability analysis.
A regional stability evaluation program is developed, which can read files in GIS formats, extract sections automatically, access stability and convert the results to GIS data. The results of the regional stability evaluation can be exported into GIS automatically, and an assessment map can be formed. As it is limited to the precision of a regional 3D geological model and the variability of the same layer’s parameters, this method cannot be very accurate. But even so, this new research provides a new way to conduct regional slope stability analysis and mapping of landslide susceptibility.
A loess gully zone in Jintai District, Baoji City, is the study area in which the method proposed in this article is verified. The geological model is determined, profiles are generated, and a regional slope risk zoning map is produced. The method proposed in this article is based on the 2D limit equilibrium method, which is most commonly used in engineering practice. It can obtain not only the distribution map of the safety coefficient, but also the scale and location of the most dangerous slip surfaces.
The method and program were used in seismic disaster assessment in Baoji City, and a good result was obtained.
References
Cheng Q, Russell H, Sharpe D, Kenny F, Qin P (2001) GIS-based statistical and fractal/multifractal analysis of surface stream patterns in the Oak Ridges Moraine. Comput Geosci 27(5):513–526
Conoscenti C, Di Maggio C, Rotigliano E (2008) GIS analysis to assess landslide susceptibility in a fluvial basin of NW Sicily (Italy). Geomorphology 94(3–4):325–339
Grenon M, Hadjigeorgiou J (2010) Integrated structural stability analysis for preliminary open pit design. Int J Rock Mech Min Sci 47(3):450–460
Guzzetti F (2000) Landslide fatalities and the evaluation of landslide risk in Italy. Eng Geol 58(2):89–107
Jia N, Mitani Y, Xie M, Djamaluddin I (2012) Shallow landslide hazard assessment using a three-dimensional deterministic model in a mountainous area. Comput Geotech 45:1–10
Li XP, Zhou SP (2012) Application and Research of GIS-based Wushan County Slope Stability Evaluation Information System. Procedia Engineering 29:2296–2302
Listo FDLR, Carvalho Vieira B (2012) Mapping of risk and susceptibility of shallow landslide in the city of São Paulo. Brazil. Geomorphology 169–170:30–44
Meisina C, Scarabelli S (2007) A comparative analysis of terrain stability models for predicting shallow landslides in colluvial soils. Geomorphology 87(3):207–223
Pan M, Fang Y, Qu HG (2007) Discussion on Several Foundational Issues in Three- Dimensional Geological Modeling. Geography and Geo-Information Science 23(3):1–5
Perotto-Baldiviezo HL, Thurow TL, Smith CT, Fisher RF, Wu XB (2003) GIS-based spatial analysis and modeling for landslide hazard assessment in steeplands, southern Honduras. Agric Ecosyst Environ 103(1):165–176
Rowbotham DN, Dudycha D (1998) GIS modelling of slope stability in Phewa Tal watershed. Nepal. Geomorphology 26(1–3):151–170
Saldivar-Sali A, Einstein HH (2007) A Landslide Risk Rating System for Baguio. Philippines. Engineering Geology 91(2–4):85–99
Tarolli P, Borga M, Chang K, Chiang S (2011) Modeling shallow landsliding susceptibility by incorporating heavy rainfall statistical properties. Geomorphology 133(3–4):199–211
Xie M, Esaki T, Cai M (2004) A GIS-based method for locating the critical 3D slip surface in a slope. Comput Geotech 31(4):267–277
Xie M, Esaki T, Qiu C, Wang C (2006) Geographical information system-based computational implementation and application of spatial three-dimensional slope stability analysis. Comput Geotech 33(4–5):260–274
Xu C, Dai F, Xu X, Lee YH (2012) GIS-based support vector machine modeling of earthquake-triggered landslide susceptibility in the Jianjiang River watershed, China. Geomorphology 145–146:70–80
Zolfaghari A, Heath AC (2008) A GIS application for assessing landslide hazard over a large area. Comput Geotech 35(2):278–285
Acknowledgments
The authors are grateful for the financial support from the China Natural Science Foundation under the grant nos. 41202187 and 41372269.
Author information
Authors and Affiliations
Corresponding author
Rights and permissions
About this article

Cite this article
Gu, T., Wang, J., Fu, X. et al. GIS and limit equilibrium in the assessment of regional slope stability and mapping of landslide susceptibility. Bull Eng Geol Environ 74, 1105–1115 (2015). https://doi.org/10.1007/s10064-014-0689-2
Received:
Accepted:
Published:
Issue Date:
DOI: https://doi.org/10.1007/s10064-014-0689-2