
Abstract
Fluidization of dry granular material is the transition from a solid state to a liquid state when sufficient energy is applied during vibration. This behavior is important because it is closely related to deformations of geotechnical structures during an earthquake. The scientific challenge lies in the understanding on how strain localization is related to the fluidization zone during the entire shearing process. Despite the importance of the mechanical behavior of granular material during fluidization, it cannot be easily characterized using traditional direct shear test. In this paper, 2D DEM model is firstly conduct, shear vibrational fluidization is defined for dry granular material, and the discrete element method has been used to simulate the direct shear test on granular material under vibrational loading during shearing. The peak, residual and vibro-residual shear strength envelopes have been obtained from the numerical simulations. Three distinct zones have been identified in the upper shear box based on the observed changes in volumetric strain before vibration. During vibration, fluidization occurs in the three zones with the characteristics that the shear stress, porosity, volumetric strain, and the coordination number drop to relatively lower values. During vibration, material becomes denser than the critical state, and strain localization has been relieved. Densification of the material at the shear zone leads to a strengthening of the material which increases the shearing resistance after vibration. Furthermore, a comparison of the 2D and 3D simulations is performed. Results reveal that the motion of particles in the out-of-plane direction in the 3D simulations lead to smoother shear stress and more consistent with the experimental result.
1 Introduction
In recent years, the earthquake-induced stability problem of geotechnical structures founded on or in granular soil is one of the main concern in engineering design [19]. An important characteristic of the granular material is that the interactions between grains are dissipative because of kinetic friction and inelastic particle collisions [21, 48]. When sufficient energy is provided to a granular material during vibration, the granular material can exhibit fluid-like behavior [43]. This transition from a solid state to a liquid state occurs when the vibrational acceleration, a, exceeds a certain critical value. For example, when vibration is applied in the vertical direction, fluidization occurs when acceleration a is greater than 1 g [18].
Richards et al. [30] proposed the concept of “dynamic fluidization”, which considers the effect of earthquake accelerations on dry granular soils. When acceleration is imposed at some critical levels, it changes the state of the soil, causing general plastification such that the soil becomes, in a sense, an anisotropic fluid. “Dynamic fluidization” was also observed by Fauve et al. [12], Goldshtein et al. [15], Ristow et al. [31], and Götzendorfer et al. [16] in experimental studies. It was assumed that the main trigger of fluidization was the inertial forces acting between the granular particles. Taslagyan et al. [44] investigated the effects of vibration intensity, normal stress and particle shape on the fluidization phenomenon of dry granular media by conducting a series of laboratory dynamic direct shear tests. The fluidization of granular material under direct shear vibration was observed by a loss in the shear strength that the main trigger of the fluidization depended mainly on horizontal accelerations with a decrease in the shear stress [43, 44]. Based on laboratory test results, it is proposed that the strain localization occurs in a narrow band close to the shear surface. However, it is difficult to relate the width of the strain localization to fluidization in the laboratory test specimens.
In the experiments carried out by Taslagyan et al. [44], the relationship between shear strength and vertical displacement with an increase of the horizontal strain had been measured that the vertical displacement dropped to a certain value when vibration was applied. However, identifying the location of the strain localization in relation to fluidization in the experimental test is a challenge. Numerical models can be used to find the location of strain localization and the behavior of fluidization by observing the micromechanical motion of individual particles. Based on this microscopic observation of the variations of the contact force chain, volumetric strain, porosity, coordination number during vibration, fluidization can be observed and quantified.
The discrete element method (DEM) was first proposed by Cundall and Strack [7]. In the last 30 years, there has been considerable development and application of this approach in solving many geotechnical engineering problems [2] such as soil consolidation [5], erosion [37], debris flow entrainment [23], granular flow mobility [8, 47], and soil irregular vibration [48, 49]. DEM has been chosen in this study because it can directly model processes at the grain level and capture the relative translation between the particles. A particle-based DEM analysis involves modeling a granular material using particles that usually have simple geometries, such as disks in a 2D analysis. To overcome the difficulties associated with laboratory measurements and improve the understanding of the micro–macro mechanical behaviors of fluidization of granular materials, discrete element modeling is used to simulate real granular particles. The 2D DEM model is first calibrated against laboratory results. Then, the model is used to provide further insight into the shearing process and the mechanism under vibration. In this paper, a description of the 2D and 3D DEM models used to simulate the dynamic direct shear test are presented, and the method to measure the volumetric strain distributions, variations of porosity and coordination number of particles in the sample during the vibration process is discussed.
2 Shear vibrational fluidization
In a broad sense, fluidization refers to the fluid-induced mobility of solid granular material subjected to upward seepage flow [27]. Under a hydraulic gradient, the soil particles float in suspension and become a fluidized bed [38]. This quicksand condition is also known as piping or boiling [33].
In the current study, the effect of fluid flow is not the focus and the material is dry. As referring to Richards et al. [30], plasticization will take place when a horizontal acceleration is larger than a specified value such that the granular soil becomes an anisotropic fluid, with flow being possible within a bounded range of directions. Here, we define this phenomenon in a more specific circumstance, i.e. “shear vibrational fluidization”, for dry granular material.
3 Physical tests
A schematic diagram and a photo of the direct shear test apparatus used in the current study are given in Figs. 1 and 2 [42]. The apparatus was modified from a traditional direct shear test machine. The modifications included the installation of an electromagnetic actuator between the proving ring and the shear box and the incorporation of two electromagnets in the actuator, which generated the vibration in the horizontal shearing direction.

Schematic diagram of the vibrational direct shear apparatus, from Taslagyan et al. [42]

The vibrational direct shear apparatus, from Taslagyan et al. [42]
Measurements were carried out using two LVDTs to measure the vertical and horizontal displacements, two load cells, and two uniaxial accelerometers granular the vertical and horizontal vibration accelerations on the soil sample.
As shown in Fig. 1, one of the accelerometers was placed on top of the loading plate (measuring the vertical vibration accelerations), and the other one was attached to the top half of the shear box in the direction of shearing (measuring the horizontal vibration accelerations). The output signals were recorded using an NI Compact DAQ System, which, in turn, was connected to a PC for logging the data with NI LabVIEW software.
The testing procedures followed ASTM D3080/D3080M [1]. A modification of the test procedure was the introduction of vibration close to the end of the test after the soil sample had reached the critical state or residual state. Vibration was applied while the sample was being sheared. The frequency and vibration force were adjusted to a certain magnitude and kept constant [42].
To investigate vibrational fluidization of granular materials, glass beads with diameters of 0.55 mm were also tested on the modified direct shear apparatus. The samples were tested at normal stresses of 23, 50, 118 kPa in the strain-controlled mode at a shear rate of 0.61 mm/min. The vibration frequency was 60 Hz for all of tested samples. The sensor data were logged at 1 kHz frequency.
The physical characteristics of the tested materials were provided that the density of a single glass bead was 2550 (kg/m3), the bulk density was 1566 (kg/m3), the void ratio was 0.692, and the porosity of the macro sample was 0.409.
4 Numerical simulation
In the experimental tests of Taslagyan et al. [43, 44], there was only one test using glass beads that could be used for the current analysis. In order to simulate the characteristics of granular materials using the experimental results for calibration, glass beads are chosen due to the disk/sphere shape in the Particle Flow Code (PFC) by Itasca [20]. For 2D analysis, the limitations have been concluded by Cui et al. [6] that side wall effect enhanced friction and momentum transfer in the out-of-plane direction was not considered. However, it is believed that the 2D simulation will capture the main shearing characteristics of the material because vibration is carried out in one direction and there is no deformation in the other directions in the test. Furthermore, compared with 3D analysis, the calculation time for 2D model is much shorter [25, 45].
4.1 Model setup
The DEM particles were randomly filled in a rectangular box of 60 × 50 mm (Length × Height) bounded by rigid walls. For all the granular specimens used, the particle diameter was equal to 0.55 mm, i.e., the same value as the glass beads used in the laboratory test (as illustrated in Fig. 3). The height of the individual cylindrical model elements was equal to the box width (60 mm) as in the PFC2D (Particle Flow Code in 2 dimensions) analysis disks were considered [6].

a Photograph of 0.55 mm diameter glass beads obtained using a microscope at ×50 magnification [44]; b 0.55 mm diameter DEM particles
To ensure an initial tight packing and to avoid crystallization, the gravitational deposition method was used in the particle generation. A population of particles with the diameter of 0.55 mm was created within the specified volume upon a direct shear box and particles were then falling down into the direct shear box by the effect of gravity until the box was full. The next step was to perform the consolidation by compacting the particles using a servomechanism to reach the designed compression stress of 1 kPa in the horizontal and vertical directions. The servomechanism in DEM simulations is illustrated in Appendix with detailed equations and parameters. The microstructure of the particles used in the DEM model of the direct shear test is illustrated in Fig. 4.

The microstructure of particles and wall elements with numbers marked used in the DEM model of the direct shear test
The side boundary walls (except the top and bottom walls) were then deleted from the model, and a direct shear box with six walls was added to the side boundary of the sample shown in Fig. 4. The DEM model of the direct shear box was created to closely simulate the physical laboratory test box. The size of the shear box used in the current study was 60 × 50 mm with a gap of 0.35 mm in the middle of the box. Two additional flat surfaces (wall numbers 7 and 8) were attached to the edge of the upper and lower box, and a gap between the shear wall and wing wall was set to be less than the particle diameter to prevent the particles from escaping from the box during the shearing and vibration process.
During the shearing process, the lower half of the box (wall numbers 3 and 6) was displaced to the right at a constant velocity of 0.61 mm/min which was consistent with that in the laboratory, while the upper half of the box (wall numbers 4 and 5) was fixed from moving in both x and y directions. The bottom box (wall number 1) was fixed from moving in the y direction but can move in the x direction to simulate the behavior of the bottom plate during the laboratory test. The top boundary could rotate freely and move in the vertical direction to maintain a constant normal stress, and the vertical displacement was calculated. The average shear stress was calculated from the contact forces on wall No. 4 to the actual shear area (Eq. 1). The contact force is equal to the sum of the normal contact forces induced by each particle in contact with the wall No. 4 (Fig. 4). The average shear stress can be expressed as:
where \( F_{\text{n}} \) is the calculated normal force on wall No. 4, \( L \) is the original length of the shear surface, which is equal to 60 mm, and \( \Delta s \) is the shear displacement.
The final horizontal strain can be calculated from:
4.2 Micro parameter calibration for DEM simulations
At the start of the direct shear test, the DEM specimens were first consolidated until equilibrium was reached under a specified normal stress applied on the top boundary using the servomechanism. The equilibrium state was adjusted by measuring the ratio of the maximum contact force and the maximum unbalanced force of the whole sample. To minimize the effects on the shear behavior caused by the initial porosity and packing geometry, a uniform inter-particle friction coefficient of 0.36 was used in the initial consolidation stage.
The micro-properties of the material should be calibrated before the model can be used to simulate the direct shear test. For a material with known macro-properties and simple packing arrangement, its micro-parameters may be calculated from the commonly measured macro-properties [22, 40]. However, for a material with random packing, calibration of the micro properties (such as particle stiffness and inter-particle friction coefficient) of the particles is needed to fit the macro-parameters (such as the peak and residual friction angle and Equivalent Young’s modulus) [14, 28, 29, 34, 35]. The Equivalent Young’s modulus calibration is focus on the initial slope of the shear stress–horizontal strain curve. The relationship between the Young’s modulus \( E_{c} \) and the normal stiffness of particle \( k_{n} \) was calculated from [28]:
where \( t \) is the unit thickness of element disk in two dimension.
The particle friction coefficient calibration is focused on the peak and residual shear strength before the start of the vibration. In this calibration procedure, the relationship between the micro-parameters and the macro-property responses can be established by adjusting the input micro-parameters in a series of direct shear test simulations. The micro-parameters of the synthetic material can then be determined by matching the macro response of the glass beads based on the obtained relation. Since there was no size distribution of the glass beads used in the laboratory test, the effects of particle size and packing arrangement were minor if the packing geometry was not too extreme [20]. Particle stiffness was measured directly from glass beads. Wall friction was set to be zero due to lubrication of the direct shear box [1]. A friction coefficient of 0.35 was used in the discrete element simulation for glass beads based on measurement from direct shear tests [3, 24, 39]. Cui et al. [6] conducted the tilting tests and found the interface friction coefficient for glass beads to be 0.36. In the numerical simulation, the parametric approach can be used to determine the parameters for DEM model [6, 10]. For 0.55 mm diameter glass beads used in the current study, the parametric approach was used to determine the friction coefficient with verification based on laboratory direct shear tests. In addition to the particle stiffness ratio, the wall stiffness was also calibrated. No vibration was applied during calibration.
Gu and Yang [17] conducted a biaxial test with 1600 uniform particles to investigate Poisson’s ratio of glass beads. In real cases, the ratio of particle normal stiffness to shear stiffness \( k_{n}^{b} /k_{s}^{b} \) is associated with Poisson’s ratio of the material [36]. In order to verify the assumption of \( k_{n}^{b} /k_{s}^{b} \) of 1, a simply biaxial test simulation was conducted with the length and width of 40 mm and 20 mm, respectively. A total of 3097 particles were generated in the test. The lateral stress was maintained at 10 kPa during the loading process by controlling the lateral wall to move in the horizontal path. The vertical wall was loaded at a constant velocity of 1 × 10⁻⁵ m/s until the peak axial stress was detected. The calculated Poisson’s ratio in a biaxial test is equal to 0.231, which stays within the range of Poisson’s ratio of a glass bead assembly in the real case [36].
In the numerical simulation, the density of a single glass bead element was set to be 2550 kg/m3, which was equal to the density of real glass bead. The initial porosity of the numerical sample was calculated to be 0.156 in the 2D simulation which corresponded to a porosity of 0.385 in the 3D simulation (dense packing) [20]. The density index \( RD \) of the granular material is defined as the ratio of the difference between the void ratios of a cohesionless soil in its loosest state and existing natural state to the difference between its void ratio in the loosest and densest states [32]:
where \( e_{ {\rm min} } \) and \( e_{{\rm max} } \) are the void ratios of a granular assembly in its densest and loosest state, respectively, and \( e \) is the current void ratio. The maximum void ratio measured in the numerical sample was equal to 0.245, the minimum void ratio was equal to 0.103 for the densest packing [20]. Therefore, the density index (\( RD \)) of the 2D numerical sample was calculated to be 0.423.
The comparison of the DEM and laboratory results after calibration is shown in Fig. 5. As depicted in Fig. 5, the numerical results are consistent with the laboratory results. The input micro parameters for the current numerical simulation are shown in Table 1.

Comparison of numerical and laboratory results before vibration stage based on parameters calibration under different normal stress
4.3 Numerical shear vibration test programme
Vibration was added in the shearing process after the calibration. Several steps were executed from the initial generation of the sample to the end of the shearing. Firstly, the generated assembly was consolidated with the specified normal load. The normal load was held constant during the whole numerical process by using the servomechanism. Secondly, the initial direct shear test was controlled by applying a constant velocity to the lower box until the horizontal strain reached 0.1. Subsequently, vibration was applied by changing the velocities of the upper box with a certain horizontal acceleration according to a specific function. During vibration, the velocity of the lower box was kept constant. Shear strength during vibration was calculated from the vibrational walls of the upper box to the shear area. Finally, when the horizontal strain was equal to 0.113, the vibration of the upper box was terminated and the lower box continued to shear until the horizontal strain reached 0.16.
In the laboratory test [43], vibration was applied to the upper box with the horizontal acceleration of up to 3.5 g when the sample reached the residual state. Frequencies and vibration forces were adjusted to a certain magnitude and then kept constant during the vibration stage. The application of vibration in the DEM simulation was based on the velocity calculation on the top two walls (wall numbers 4 and 5) as shown in Fig. 4. In matching the calculated velocity with the boundary condition in the experimental tests, the derivations of the trigonometric function are conducted using the initial amplitude, frequency (Eqs. 5 and 6) and acceleration (Eq. 7) to obtain the number of steps in the DEM simulations during the acceleration process. The horizontal displacement \( y \) of these two walls at any time \( t \) during the vibration stage is calculated as:
where \( A \) is the vibration amplitude of 0.242 mm, \( \omega \) is the angular velocity which is expressed as \( \omega = 2\pi f \), \( f \) is the vibration frequency of 60 Hz.
The velocities of wall numbers 4 and 5 during the vibration stage are calculated by taking the derivative of Eq. 5 with time:
In the DEM calculation, the velocity of the upper box walls increases from zero to a maximum value step by step:
where \( t_{\text{total}} \) is the total time of accelerating of the wall from zero velocity to the maximum velocity, \( a \) is the acceleration of the vibrational walls equal to 3.5 g [42], \( v_{ \hbox{max} } \) is the maximum velocity, i.e., \( v_{ \hbox{max} } = \omega A \), and \( N \) is the number of steps during the acceleration process, while \( \Delta t \) is the DEM simulation time step [20] such that \( \Delta t = \sqrt {m/K} \) for the linear contact model [26] which is used in the current study, where \( m \) is the mass of the particle and \( K \) is the stiffness of the particle. The calculated DEM time step in this analysis is approximately 1 × 10⁻⁷–1 × 10⁻⁶ s.
5 Numerical simulation results
5.1 Comparison of numerical and laboratory results
The numerical results simulating the vibrating direct shear tests are compared with the laboratory measurements as shown in Fig. 6. It shows the variation of the shear stress with increasing horizontal strain. The horizontal strain is the ratio of the displacement to the original length of the lower part of the shear box, which is calculated from Eq. 2. It is observed that the laboratory and numerical results have almost the same peak shear strength and residual strength. However, the laboratory shear strength drops after reaching the peak, and it is smoother than the current DEM results. This may be caused by the two dimensional model since the particles generated in the sample are less than those in the three-dimensional sample. The limitations of 2D DEM is mainly on side wall confinement effects that the force transfer in the out-of-plane direction is not considered, together with the particle confinement in the out-of-plane direction caused larger dilation during shearing. This point will be returned to in the Comparison of numerical 2D and 3D analysis section that follows.

Comparison of shear stress versus horizontal strain between DEM and laboratory results [42]
It is also found that the shear strength drops to a certain value during vibration in both numerical and laboratory cases. It is observed in the laboratory case that after vibration, the residual strength recovers to a value higher than the shear strength before vibration. However, in the current DEM analysis, the vibro-residual strength only recovers to the same value as that before vibration. There may be several reasons to explain this difference. First, during vibration, the particles will be rearranged (vibration caused repacking) and therefore becomes denser than the critical state of the pre-vibration stage. Second, the experimental study is 3D. During vibration, material in 3D can be densified easier than in 2D due to higher porosity and particle rearrangement in the out-of-plane dimension. Compared with the 3D case, the material in the 2D vibration stage is more difficult to be repacked. With a larger degree of densification, the residual shear stress is larger at the end of vibration. This point will also be returned to in the Comparison of numerical 2D and 3D analysis section that follows. The calculated and observed vertical displacements versus horizontal strains are shown in Fig. 7. It is found that the vertical displacement increases with an increase in the horizontal strain before vibration in both numerical and laboratory results. The initial negative displacement found in the current DEM simulation is caused by particle consolidation. When vibration starts, the vertical displacement drops from 0.65 to 0.3 mm, which shows that the sample is in a contractive state. However, due to higher porosity and easier rearrangement of particles in the out-of-plane direction in 3D laboratory tests, the decrease in vertical displacement is found to be much larger than in the DEM results.

Comparison of vertical displacement versus horizontal strain between DEM and laboratory results [42]
The envelopes of the peak, residual and vibro-residual shear strength from the laboratory tests and the DEM results are shown in Fig. 8. The normal stresses in the current DEM simulations are 23, 50, and 118 kPa which are indicated by hollow markers. As shown in Fig. 8, the peak, residual and vibro-residual shear strengths in the current DEM simulations are consistent with those observed in the laboratory tests. Based on the numerical and experimental results, the friction angle \( \phi \) of the residual value is 21.23° which only has 4.36% difference with the laboratory observation of 22.2°.

Peak, residual and vibro-residual shear strength envelops from the laboratory tests and DEM simulations
5.2 Determination of three zones before vibration
A technique has been developed to determine the thickness of the strain localization and fluidization during the entire shearing process by measuring the volumetric strain in a specified area. The volumetric strain was determined by inserting measurement circles inside the sample in the DEM simulation. The measurement circle is a built-in tool in PFC2D to help the user to measure quantities such as coordination number, porosity, stress and strain rate in a specific measurement volume at the current state [20]. The diameter of the measurement circle should be large enough and it should include at least 20 particles in calculating the average values [4]. In the presented model, there are approximately 53 particles in each measurement circle.
The volumetric strain \( \varepsilon_{\text{v}} \) can be calculated by measuring the volumetric strain rate in a measurement circle [4]:
where \( \dot{\varepsilon }_{{{\text{v}}_{i} }} \) is the instantaneous strain rate determined from the velocity of particle \( i \) within the measurement circle at the end of each DEM time step.
The analysis of the numerical results was focused on the shearing characteristics of the material during shearing and the formation of different zones in the sample. In order to explain the experimental results, 42 measurement circles were used and distributed uniformly in the upper box, as shown in Fig. 9a. During the shearing process before vibration was applied, the average values of the volumetric strains in each row of measurement circles were calculated. For example, average volumetric strain for the first row was calculated based on 7 measurement circles. The upper shear box is divided into three zones, zones A, B, and C, based on the average volumetric strain distribution along the vertical distance from the center line for different horizontal strain from 0.02 to 0.095 before vibration as shown in Fig. 9b. It is revealed that with increase in horizontal strain, the average volumetric strain in zone B increases accordingly. However, the changes in volumetric strains in zone C and zone A are small. This is because the material in zone C is shearing at critical state. In zone B the material is shearing at a state before reaching the critical state which shows shear dilation due to particle rearrangement. This is also the reason why shearing in zone B is less than that in zone C, but the volumetric strain in zone B is larger than that in zone C. On the other hand zone A undergoes very little shearing. From the numerical results displayed in Fig. 9b, the distinguished three zones are plotted in Fig. 9c. Zone C is located close to the middle the sample in the region is subject to strain localization and intensive shearing. The thickness of zones B and C are the same which are equal to 0.004 m.

a Distribution of the measurement circle in DEM simulation to determine the width of fluidized strain localization, b the average volumetric strain distribution along the vertical distance from the center line for different horizontal strain states (from 0.02 to 0.095, before the start of vibration), c the determined thickness of zone A, B, and C
5.3 Strain localization and shear vibrational fluidization
The average volumetric strains of zones A, B and C with the increase of horizontal strain during the whole shearing process are plotted in Fig. 10a. The volumetric strains in zones A, B and C are changing during vibration which means that the process of shearing starts from the beginning until the end of vibration.

Variation of a volumetric strain; b porosity; and c coordination number in three different zones with the increase of horizontal strain during direct shear test
The variation of the volumetric strain determines the contraction or dilation behavior of the material. Shear contraction is defined as a decrease in volumetric strain and shear dilation means increase in volumetric strain. As shown in Fig. 10a, b, based on the calculated volumetric strains in the sample, it is found that zone C is shearing at the critical state since there is no change in volume due to shearing [33]. During vibration, particles will be rearranged (vibration caused repacking) and zone C becomes denser than critical because of volume contraction and decrease in porosity. Therefore, post vibration deformation causes a slight increase in volumetric strain indicating that shear vibrational fluidization has densified the material.
Material in zone B is not shearing at critical state during the entire shearing process. It is shearing before critical state and it shows shear dilation due to particle rearrangement which is evidenced by high volumetric strain and high porosity. During vibration, both volumetric strain and porosity decrease indicating that the material is being densified. The difference in zone B comparing to zone C is that it continues to contract after vibration. The reason is because zone B is not at a critical state and it will continue to decrease in volume until it reaches the critical state. Material in zone A undergoes very little shearing. Since the material was initially in a dense state and the porosity has not changed significantly during shearing. During vibration, relatively small decreases in volume and porosity occur due to densification. After vibration, there is not a lot of volume and porosity change since the material has not sheared significantly. Therefore, strain localization is not found in zone A.
Before vibration, only zone C experiences localized deforming at critical state. During vibration, strain localization in zone C is somewhat relieved. After vibration, material in zone C returns to the critical state due to additional shearing and geometric constraints, and material in zone B moves closer to the critical state. Post vibration brings both zones closer to the critical state.
In order to evaluate the micro mechanism between particles during shear vibrational fluidization, the coordination number in PFC is used to quantify the packing state of granular materials. The coordination number is calculated by counting the number of contacts of a particle with its neighboring particles. It will not only characterize the behavior of strain localization under quasi-static loading [41], it also measures the behavior of fluidization of the granular material [50]. During the simulation, the average coordination number \( \bar{C} \) of a granular assembly in a specific measurement circle is calculated from [20]:
where \( C_{\text{i}} \) is the contact number on a single particle \( i \), and \( N_{\text{p}} \) is the total number of particles within the volume.
Under quasi-static conditions, the coordination number will decrease when the material is exposed to shear dilation. However, the coordination number in zones A, B, and C decrease during vibration and then increase again after vibration, as shown in Fig. 10c. Table 2 shows the values of the coordination number in all three zones before, during and after vibration. The decrease in the coordination number means a decrease in the number of contacts and therefore a decrease in effective stress and shearing resistance. The results are consistent with the results of Zhao [50] for channelized granular flow condition. Therefore, the coordination number, effective stress and shearing resistance will decrease when shear vibrational fluidization occurs.
In order to analyze the characteristics of vibrational fluidization, the porosity and coordination number of different zones in one completely vibrational cycle have been measured. The rate of strain as a significant parameter in the fluidized cell can be represented by the velocity of the upper vibrational wall. The velocity of upper walls in one complete cycle is shown in Fig. 11.

Velocity of upper walls in one complete cycle
The variations of porosity and coordination number of different zones in one complete cycle are shown in Figs. 12 and 13, respectively.

Variations of porosity in one complete vibrational cycle of a zone A; b zone B; c zone C
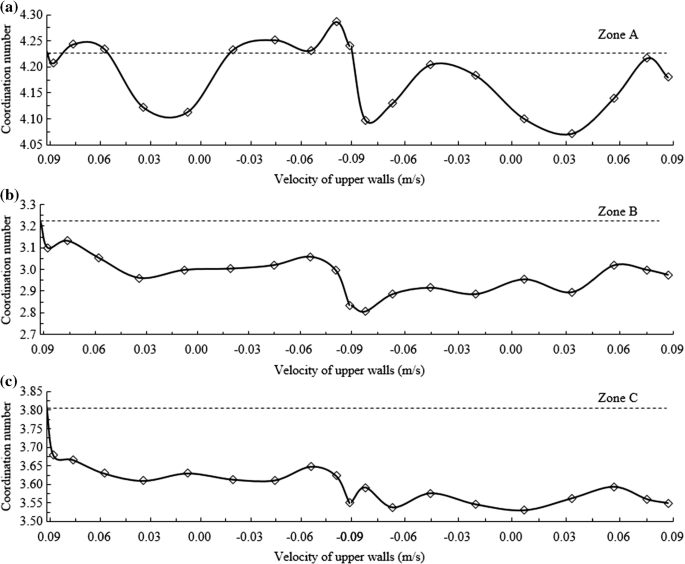
Variations of coordination number in one complete vibrational cycle of a zone A; b zone B; c zone C
As shown in Fig. 12, the porosities in different zones vary differently during one cycle. However, a common characteristic could be found because the porosities at the end of the completed cycle are less than those at the beginning in all three zones. In particular, porosities in zones B and C decrease at the end of the cycle when the upper walls return to its original velocity. In general, the coordination numbers (contact number between granular elements) increase with the decrease in porosity. However, as shown in Fig. 13, the coordination numbers at the end of the vibrational cycle are less than those at the beginning. Meanwhile, the coordination numbers decrease when the vibration starts in zones B and C. Therefore, the decrease in porosity and coordination numbers of the granular elements during vibrational shearing capture the important characteristics of fluidization.
6 Comparison of numerical 2D and 3D analysis
6.1 3D DEM modelling and the input parameters
In the current study, the PFC3D model is geometrically similar to the 2D test, with the same width and height. However, due to dramatically decrease of calculation efficiency in PFC3D with massive particles (approximately 122 times increase in terms of particle number compared with 2D case), the thickness of the model cannot be chosen the same as in the experimental approach of 60 mm [11, 46]. Moreover, considering the average particle size used in this model, the model thickness was determined to be 4 mm, which contains more than 14 particles along the thickness direction [9].
The 3D numerical model setup is shown in Fig. 14. The walls of the shear box were separated into upper and lower parts as planar and rigid elements. Two additional rigid walls were attached to the edge of the upper and lower box which was similar to the 2D model to prevent the particles from escaping from the box during the shearing process. The input parameters and modelling procedures were the same as those used in the 2D simulations. After the generation of particles, a gravitational acceleration of 9.81 m/s2 was applied to the computational domain and elements were allowed to free fall in the storage container until the ratio of average unbalanced force to the average contact forces converged was less than 1% difference. A consolidation by compacting the particles using a servomechanism to reach the designed compression stress of 1 kPa in three directions was then performed. During the shearing process, the lower half of the box was displaced to the right at a constant velocity of 0.61 mm/min. The upper box would be vibrated when the horizontal strain reached a certain value with the same frequency, amplitude and acceleration as those in 2D simulations and physical modelling. Shear stress and vertical displacement were measured during shear process.

3D numerical model setup
6.2 Comparison and discussion
The DEM 3D numerical results during the whole shearing process are compared with the DEM 2D and the experimental results, as shown in Fig. 15. It is observed that the peak shear stress between DEM 3D and experimental results share the same value, and the curve of 3D simulation is much smoother than that of 2D result after peak stage before the start of vibration and is more consistent with the experimental result (Fig. 15a). Furthermore, the residual strength after vibration recovers to a value higher than the shear strength before vibration, which is not obtained in the 2D simulations. This is probably attribute to material in 3D can be densified easier than in 2D during the vibration stage because of higher porosity and particle rearrangement in the out-of-plane direction. However, the residual strength of 3D simulation after vibration is still less compared with the experimental result. The reason may due to the finite thickness of the present model (4 mm in DEM 3D model, compared with 60 mm in experimental approach) restrains the particle rearrangement in the thickness direction.

Comparison among DEM 2D, DEM 3D and experimental results in terms of a shear stress versus horizontal strain; b vertical displacement versus horizontal strain
The general trend of vertical displacement of 3D simulation is observed consistent with the experimental result during the three distinct shearing processes (Fig. 15b). Compared with 2D result, 3D vertical displacement is lower than 2D result due to the higher porosity and easier rearrangement of particles in the out-of-plane direction. However, the 3D results value still higher than those of experimental results, which may also due to the finite thickness of the 3D model. With the increase of the thickness of 3D model, the numerical results are expected to get closer to the experimental results.
As shown in Fig. 15a, the shear stress obtained in the 3D simulation is smoother in comparison to the 2D simulation result. This difference may be attributed to the softening effect present in the 3D simulation that is lacking in the 2D simulation, such as out-of-plane particle motion, which is caused by the added degree of freedom [13]. Tracking individual elements in the 3D simulation reveals that a significant motion in the \( y \) direction (out-of-plane direction), as shown in Fig. 16. Figure 16 shows the trajectories of five such elements within the shear band of the 3D simulation can move 0.58 mm which is larger than the diameter of the granular element in the out-of-plane (\( y \)) direction during the pre-vibration stage. This represents a significant difference when compared with the behavior of the elements in the 2D DEM simulation (fixed moving along out-of-plane \( y \) direction) that the elements in the 3D simulation have an additional degree of freedom in the out-of-plane (\( y \)) direction.

Particle trajectories in an x, y planar cross section within the shear band of the 3D DEM simulation before the vibration stage
An increase in apparent friction in the 3D simulation caused by the presence of forces in the out-of-plane direction [13], which caused the residual frictional angle predicted by 2D simulation substantially low after the vibration stage. The limitations of 2D DEM is mainly on side wall confinement effects that the force transfer in the out-of-plane (\( y \)) direction is not considered, together with the particle confinement in the out-of-plane (\( y \)) direction caused larger dilation during shearing.
For proving the relation between the vertical displacement and the finite thickness (\( T \)) of the 3D model, two more sets of 3D numerical simulation with the thickness of 6 mm and 8 mm have been conducted. Comparison of the numerical and experimental results are shown in Fig. 17.

Comparison of numerical results of 3D models with different thickness \( T \) and the experimental result, a shear stress; b vertical displacement
As shown in Fig. 17a, the shear stress from 3D numerical results with different thickness are consistent with that of the experimental result. The shear stress drop to a certain value during the vibration stage and the residual strength recover to values higher than the shear strength before vibration. It is observed that the thickness of 3D numerical model has no influence on behavior of shear stress. In order to evaluate the influence of the thickness of 3D model on the vertical displacement, comparison among the experimental result and 3D models with different thickness have been shown in Fig. 17b. The general trends of vertical displacements of 3D simulations are observed consistent with the experimental result during the three distinct shearing processes. The vertical displacement of 3D model decreases with the increase of the thickness of the 3D model due to the easier rearrangement of particles in the out-of-plane (\( y \)) direction. However, the vertical displacement of the numerical model with 8-mm thickness during vibration is still much higher compared with the experimental result. It may due to the finite thickness of the present model (compared with 60 mm in the experimental model) still restrain the particle rearrangement in the out-of-plane direction.
Due to dramatically decrease of calculation efficiency in PFC3D with massive particles (approximately 122 times increase in terms of particle number compared with 2D case), the thickness of the model cannot be chosen the same as in the experimental approach of 60 mm.
7 Conclusion
In the current study, the notion of “Shear vibrational fluidization” of dry granular material is defined. The acceleration for glass beads to initial fluidization is determined as 0.23 g [30]. In the experimental tests and numerical simulations, a horizontal acceleration of 3.5 g is applied which provides sufficient energy for granular material to fluidize. The direct shear test combined with vibration is conducted using a 2D discrete element model. The peak, residual and vibro-residual shear strength envelopes are obtained from the numerical simulations. The relationship between strain localization and fluidization zone during the entire shearing process is identified from the volumetric strain calculation in each layer and discussed in detail. The 3D discrete element models are then conducted to evaluate the motion of the granular elements in the out-of-plane direction which cannot be obtained in 2D simulations. Based on the numerical simulation results, the following conclusions can be drawn:
-
1.
Three distinct zones, zones A, B, and C are identified based on the observed changes in volumetric strain before vibration. From the observation of volumetric strain behavior in zones B and C, strain localization before vibration only occurs in zone C, while material in zone B is shearing at pre-critical state. During vibration, material in zone C is being densified with a significant volumetric contraction, and strain localization has been relieved due to particle rearrangement. After vibration, zone C returns to the critical state, and zone B moves closer to the critical state. Material in zone A undergoes very little shearing during the entire shearing process.
-
2.
During vibration, several characteristics of the shear stress, volumetric strain, coordination number, and porosity of the particles in the upper shear box decrease, these are the behaviors of the material fluidization.
-
3.
Fluidization at residual strength state leads to densification of the material in the shear zone. The residual strength drops to nearly zero during vibration in both the numerical model and laboratory tests. Densification of the material at the shear zone leads to strengthening of the material which increases the shearing resistance after vibration.
-
4.
Due to the particles motion and the easier rearrangement in the out-of-plane direction, the shear stress obtained in 3D simulations are smoother in comparison to the 2D simulations results and the vertical displacement of 3D model decreases with the increase of the thickness of the 3D model.
References
ASTM: Standard test method for direct shear test of soils under consolidated drained conditions. D3080/D3080 M. West Conshohocken, PA (2011)
Chen, W., Qiu, T.: Numerical simulations for large deformation of granular materials using smoothed particle hydrodynamics method. Int. J. Geomech. 12(2), 127–135 (2012). https://doi.org/10.1061/(asce)gm.1943-5622.0000149
Chiou, M.: Modelling of dry granular avalanches past different obstructs: numerical simulations and laboratory analyses. Ph.D. dissertation, Technical University Darmstadt (2005)
Cui, Y., Nouri, A., Chan, D., Rahmati, E.: A new approach to DEM simulation of sand production. J. Petrol. Sci. Eng. 147, 56–67 (2016)
Cui, Y., Chan, D., Nouri, A.: Discontinuum modeling of solid deformation pore-water diffusion coupling. Int. J. Geomech. (2017). https://doi.org/10.1061/(asce)gm.1943-5622.0000903
Cui, Y., Choi, C.E., Liu, L.H.D., Ng, C.W.W.: Effects of particle size of mono-disperse granular flows impacting a rigid barrier. Nat. Hazards 91, 1179–1201 (2018)
Cundall, P.A., Strack, O.D.L.: A discrete numerical model for granular assemblies. Géotechnique 29(1), 47–65 (1979)
Ding, W.T., Xu, W.J.: Study on the multiphase fluid-solid interaction in granular materials based on an LBM-DEM coupled method. Powder Technol. 335(15), 301–314 (2018)
Ding, X., Zhang, L., Zhu, H., Zhang, Q.: Effect of model scale and particle size distribution on PFC3D simulation results. Rock Mech. Rock Eng. 47, 2139–2156 (2014)
Dove, J.E., Jarrett, J.B.: Behavior of dilative sand interface in a geotribology framework. J. Geotech. Geoenviron. Eng. 12(1), 25–37 (2002)
Fan, X., Li, K., Lai, H., Xie, Y., Cao, R., Zheng, J.: Internal stress distribution and cracking around flaws and openings of rock block under uniaxial compression: a particle mechanics approach. Comput. Geotech. 102, 28–38 (2018)
Fauve, S., Douady, S., Laroche, C.: Collective behaviours of granular masses under vertical vibrations. J. Phys. Colloq. 50(C3), 187–191 (1989)
Fleischmann, J.A., Plesha, M.E., Drugan, W.J.: Quantitative comparison of two-dimensional and three-dimensional discrete-element simulations of nominally two-dimensional shear flow. Int. J. Geomech. 13(3), 205–212 (2013)
Fu, Y.: Experimental quantification and DEM simulation of micro-macro behaviors of granular materials using x-ray tomography imaging. J. Therm. Anal. Calorim. 90(3), 873–879 (2005)
Goldshtein, A., Shapiro, M., Moldavsky, L., Fichman, M.: Mechanics of collisional motion of granular materials. Part 2. Wave propagation through vibrofluidized granular layers. J. Fluid Mech. 287, 349–382 (1995)
Götzendorfer, A., Tai, C.H., Kruelle, C.A., Rehberg, I., Hsiau, S.S.: Fluidization of a vertically vibrated two-dimensional hard sphere packing: a granular meltdown. Phys. Rev. E 74(1), 011304 (2006)
Gu, X.Q., Yang, J.A.: Discrete element analysis of elastic properties of granular materials. Granul. Matter 15(2), 139–147 (2013)
Huan, C.: NMR experiments on vibrofluidized and gas fluidized granular systems. Ph.D. thesis, University of Massachusetts Amherst, USA (2008)
Huang, D., Wang, G.: Energy-compatible and spectrum-compatible (ECSC) ground motion simulation using wavelet packets. Earthq. Eng. Struct. Dyn. 46(11), 1855–1873 (2017)
Itasca Consulting Group: Inc. PFC3D, version 4.0. Minneapolis, USA (2008)
Jaeger, H.M., Nagel, S.R., Behringer, R.P.: Granular solids, liquids, and gases. Rev. Mod. Phys. 68, 1259 (1996)
Jenkins, J.T., Strack, O.D.L.: Mean-field inelastic behavior of random arrays of identical spheres. Mech. Mater. 16(1–2), 25–33 (1993)
Kang, C., Chan, D.: Numerical simulation of 2D granular flow entrainment using DEM. Granul. Matter 20, 13 (2018). https://doi.org/10.1007/s10035-017-0782-x
Law, R.H., Choi, C.E., Ng, C.W.W.: Discrete element investigation of the influence of debris flow bafes on rigid barrier impact. Can. Geotech. J. 53(2), 179–185 (2015)
Liu, Z., Koyi, H.A.: Kinematics and internal deformation of granular slopes: insights from discrete element modeling. Landslides 10(2), 139–160 (2013)
Otsubo, M., O’Sullivan, C., Shire, T.: Empirical assessment of the critical time increment in explicit particulate discrete element method simulations. Comput. Geotech. 86, 67–79 (2017)
Payne, F.C., Quinnan, J.A., Potter, S.T.: Remediation Hydraulics. CRC Press, Boca Raton (2008)
Potyondy, D.O., Cundall, P.A.: A bonded-particle model for rock. Int. J. Rock Mech. Min. Sci. 41(8), 1329–1364 (2004)
Radjai, F., Evesque, P., Bideau, D., Roux, S.: Stick-slip dynamics of a one-dimensional array of particles. Phys. Rev. E 52(5), 5555–5564 (1995)
Richards, R.J., Elms, D.G., Budhu, M.: Dynamic fluidization of soils. J. Geotech. Eng. (1990). https://doi.org/10.1061/(ASCE)0733-9410(1990)116:5(740)
Ristow, G.H., Strassburger, G., Rehberg, I.: Phase diagram and scaling of granular materials under horizontal vibrations. Phy. Rev. Lett. 79(5), 833–836 (1997)
Salot, C., Gotteland, P., Villard, P.: Influence of relative density on granular materials behavior: DEM simulations of triaxial tests. Granul. Matter 11(4), 221–236 (2009)
Schofield, A.N., Wroth, C.P.: Critical State Soil Mechanics. McGraw-Hill, New York City (1968). ISBN 978-0641940484
Shi, X.S., Herle, I.: Numerical simulation of lumpy soils using a hypoplastic model. Acta Geotech. 12(2), 349–363 (2017)
Shi, X.S., Herle, I., Muir Wood, D.: A consolidation model for lumpy composite soils in open-pit mining. Géotechnique 68(3), 189–204 (2018)
Sjögren, B.A., Berglund, L.A.: Failure mechanisms in polypropylene with glass beads. Polym. Composite. 18(1), 1–8 (1997)
Tang, Y., Chan, D.H., Zhu, D.Z.: A coupled discrete element model for the simulation of soil and water flow through an orifice. Int. J. Numer. Anal. Met. (2017). https://doi.org/10.1002/nag.2677
Tang, Y., Chan, D.H., Zhu, D.Z.: Numerical Investigation of sand-bed erosion by an upward water jet. J. Eng. Mech. 143(9), 04017104 (2017)
Teufelsbauer, H., Wang, Y., Chiou, M.C., Wu, W.: Flow–obstacle interaction in rapid granular avalanches: DEM simulation and comparison with experiment. Granul. Matter 11(4), 209–220 (2009)
Thorton, C.: Coefficient of restitution for collinear collisions of elastic-perfectly plastic spheres. J. Appl. Mech. 64(2), 383–386 (1997)
Thornton, C.: Numerical simulations of deviatoric shear deformation of granular media. Géotechnique 50(1), 43–53 (2000)
Taslagyan, K.A., Chan, D.H., Morgenstern, N.R.: A direct shear apparatus with vibrational loading. Geotech. Test. J. 38(1), 1–8 (2015)
Taslagyan, K.A., Chan, D.H., Morgenstern, N.R.: Effect of vibration on the critical state of dry granular soils. Granul. Matter 17(6), 687–702 (2015)
Taslagyan, K.A., Chan, D.H., Morgenstern, N.R.: Vibrational fluidization of granular media. Int. J. Geomech. (2016). https://doi.org/10.1061/(asce)gm.1943-5622.0000568
Wang, J., Gutierrez, M.: Discrete element simulations of direct shear specimen scale effects. Géotechnique 60(5), 395–409 (2010)
Wong, R.H.C., Lin, P., Tang, C.A.: Experimental and numerical study on splitting failure of brittle solids containing single pore under uniaxial compression. Mech. Mater. 38, 142–159 (2006)
Xu, W.J., Hu, L.M., Gao, W.: Random generation of the meso-structure of a soil–rock mixture and its application in the study of the mechanical behaviors in a landslide dam. Int. J. Rock. Mech. Min. 86, 166–178 (2016)
Zhang, Z., Zhang, X., Qiu, H., Daddow, M.: Dynamic characteristics of track-ballast-silty clay with irregular vibration levels generated by high-speed train based on DEM. Constr. Build. Mater. 125, 564–573 (2016)
Zhang, Z., Zhang, X., Tang, Y., Cui, Y.: Discrete element analysis of a cross-river tunnel under random vibration levels induced by trains operating during the flood season. J. Zhejiang Univ. SC. A 19(5), 346–366 (2018)
Zhao, T.: Investigation of Landslide-Induced Debris Flows by the DEM and CFD. Ph.D. thesis. University of Oxford, UK (2014)
Acknowledgements
The project was financially supported by an NSERC Postgraduate Scholarship and Alberta Innovates Graduate Student Scholarship. The authors are grateful for financial support from the Opening Fund of State Key Laboratory of Hydraulics and Mountain River Engineering (SKHL1609) and Hong Kong Research Grants Council (T22-603/15N). The project was also supported by the Natural Sciences and Engineering Research Council of Canada (RGPIN 355485) and the key international collaborative project of the Natural Science Foundation of China (No. 41520104002) and the Fundamental Research Funds for the Central Universities (2017-YB-014; WUT: 2017IVB079).
Author information
Authors and Affiliations
Corresponding author
Ethics declarations
Conflict of interest
The authors declare that they have no conflict of interest.
Appendix: Servomechanism for computing and controlling the wall-based stress state
Appendix: Servomechanism for computing and controlling the wall-based stress state
Throughout the loading process, the top normal stress is kept constant by adjusting the top loading wall velocity using a numerical servomechanism. The servomechanism implements the following algorithm [20]. The equation for wall velocity \( \dot{u}^{w} \) is calculated in Eq. A1:
where the superscript \( w \) represents wall, \( \sigma^{\text{measured}} \) is the contact pressure of the wall which is measured during shearing, \( \sigma^{\text{required}} \) is the required contact pressure that we set, \( G \) is a calculated parameter that is estimated from Eqs. A2–A6.
The maximum increment in wall force arising from the wall movement in one time step is calculated from Eq. A2:
where \( N_{c} \) is the number of contacts on the wall, \( k_{n}^{c} \) is the average combined normal stiffness of the two contacting entities (ball-to-wall), \( k_{n}^{b} \) and \( k_{n}^{w} \) are the normal stiffness of the ball and the wall, respectively, the superscript symbol \( b \) represents balls, \( \Delta t \) is the DEM simulation time step. Therefore, the change in the average wall stress is calculated from Eq. A3:
where A is the wall area. For stability, the absolute value of the change in wall stress must be less than the absolute value of the difference between the measured and required stresses. In practice, a relaxation factor \( \alpha \) is used such that the stability requirement becomes that:
Substituting Eqs. A1 and A3 into Eq. A4 yields:
The “gain” parameter \( G \) is determined using Eq. A6:
Here, α is the relaxation factor which is equal to 0.5, A is the area of the top plane, in the 2D numerical model, A is the area of the top loading plane, which is equal to the length of the top loading plane multiplies by the width of the box. In current study, A = 60 mm × 60 mm.
Rights and permissions
About this article

Cite this article
Zhang, Z., Cui, Y., Chan, D.H. et al. DEM simulation of shear vibrational fluidization of granular material. Granular Matter 20, 71 (2018). https://doi.org/10.1007/s10035-018-0844-8
Received:
Published:
DOI: https://doi.org/10.1007/s10035-018-0844-8