
Abstract
The unique role of the South China Sea summer monsoon (SCSSM) onset process in the development of the East Asian summer monsoon (EASM) is demonstrated in this study. The SCSSM onset process is examined in terms of the vertical linkage between the Western Pacific subtropical high (WPSH) and the South Asian high (SAH). A composite analysis is performed in order to adequately describe the vertical linkage in a synoptic timescale. The South China Sea (SCS) is a key region for the seasonal migrations of the WPSH and the SAH, with the former retreating northeastward, the latter advancing northwestward, and both taking place over the SCS during the SCSSM onset period. The SCSSM onset process is characterized by a significant change in the relative configuration of the ridge lines of the WPSH and the SAH. Just prior to the onset period, the ridge lines intersect vertically over the SCS, thus prohibiting convective activities. During the onset period, the ridge line intersection moves away from the SCS due to the retreating WPSH and the northward shift of the SAH ridge line. This coincides with the emergence of monsoonal convective activities over the SCS and the establishment of a moisture channel from the tropics, which in turn provides favorable conditions for the development of deep convective activity. The northeastward intrusion of the lower level southwesterlies and the moisture supplying channel are closely related to the development of a preexisting twin cyclone in the Bay of Bengal. The northeastward lower level southwesterlies form a monsoonal ascending motion in the SCS, which further merges upward into the northeasterlies to the south of the SAH ridge line. This is a signature of the establishment of the local Hadley circulation, which marks the beginning of the EASM. The frontal system is the most frequent attendant synoptic event during the SCSSM onset. From the viewpoint of synoptic process, the SCSSM undergoes a two-stage onset process which is characterized by the southward intrusion of the frontal system in the earlier stage and the outbreak of the tropical convection in the later stage. The frontal system may act as a trigger for the outbreak of the tropical convection in the later stage. The burst out of the monsoonal convection over the SCS is essential for the breakdown of the vertical intersection between the WPSH and the SAH therein.
1 Introduction
The East Asian summer monsoon (EASM) exhibits a stepwise northward movement (Ding and Chan 2005; Wang et al. 2004). It is well recognized that the EASM development is characterized by both substantial changes in large-scale atmospheric circulation as well as in the rainfall distribution throughout the monsoon region. These include: (1) the northward displacement of the subtropical upper level westerly jet stream (Lau and Li 1984; Liang and Wang 1998; Lau et al. 2000); (2) the development and northward advance of the upper level South Asian high (SAH) and the establishment of the easterly jet stream along its southern periphery (He et al. 1987; So and Chan 1997); (3) the progressively northward advance of the monsoon-related rain band and the commencement of the summer rainy seasons in East Asia, and (4) the seasonal migration of the Western Pacific subtropical high (WPSH) and the eastward penetration of the lower level westerlies originating from the tropical Indian Ocean (Lau and Li 1984; Tao and Chen 1987; Lau and Yang 1997; Ding and Chan 2005; Wang et al. 2004).
Many previous studies have attributed the very first appearance of the South China Sea (SCS) monsoonal convection to the WSPH retreat. The onset of the SCS summer monsoon (SCSSM) has also been regarded as the earliest EASM development transition (Tao and Chen 1987; Lau and Yang 1997; Wang et al. 2004). During the first EASM transition (hereafter referred to as SCSSM onset), the eastward retreat of the WPSH is accompanied by significant changes in the lower level zonal wind and the sudden development of deep convections in the SCS region (So and Chan 1997; Xie et al. 1998; Kueh and Lin 2001). The summer monsoon circulation has been related to the thermal contrast between the Tibetan Plateau and the surrounding area (Luo and Yanai 1984). He et al. (1987) characterized the first transition of the Asian summer monsoon as the sudden northward movement of the SAH due to an increase in the upper tropospheric temperature, which responded to the adiabatic warming as a result of large-scale subsidence. Hsu et al. (1999) related the first transition to the interaction between convection, large-scale circulation, and lower boundary forcing, which includes differences in oceanic and land surface heating rates due to topographical lifting. Liang and Wang (1998) noted that the East China monsoon rainfall pattern is dominated by the East Asian jet stream (EAJ) and Hadley-type circulation. The equator-ward displacement of the EAJ causes an increase in precipitation over South Central China during June–August. A Hadley-type circulation, which prevails over the SCS, intensifies the rainfall concurrently with the enhancement of lower level westerlies. Lau et al. (2000) characterized the EASM internal dynamics as a “hybrid” monsoon system, which features multicellular meridional circulation over the East Asian sector, extending from the deep tropics to the mid-latitudes. The meridional cells link tropical heating to extratropical circulation systems via the East Asian jet stream and are responsible for the observed zonally oriented anomalous rainfall patterns over East and Southeast Asia as well as over the subtropical Western Pacific.
The aforementioned studies suggest a close relationship among monsoon-related rainfall, lower level westerlies, the WPSH and the SAH, as well as a connection between the tropics and the mid-latitudes. Chang and Chen (1995) indicated that the SCS is the only tropical region in the entire longitudinal Asian area where the mid-latitude baroclinic disturbances in the lower troposphere can penetrate. This geographic characteristic of the SCS, accompanied by the warm and moist tropical atmosphere, favors the early occurrence of the monsoon onset, with the invading mid-latitude front acting as a triggering force. By the use of satellite-estimated rainfall data, Lau et al. (1998) showed that simultaneously with the SCSSM onset, a moist tongue and frontal rain band emanating from the northern SCS moves across southern China and the East China Sea to southern Japan and that an enhanced equatorial convection occurs in the Western Pacific inter-tropical convergence zone (ITCZ). However, the possible connection between the SCSSM onset and the mid-latitude frontal system is a controversial issue. The 1998 SCSSM onset was related to the early rapid development of a twin cyclone over the Bay of Bengal (BoB) and the progressive retreat of the subtropical high from the SCS; the SCSSM onset was suggested to have been triggered by a strong mid-latitude cold front (Chan et al. 2000; Ding and Liu 2001). In contrast, Li and Wu (2000) pointed out that the rainfall in the southern China coastal region, before the 1998 summer monsoon onset, was the result of cold front activity and could not be regarded as a sign of the initiation of the summer monsoon over the SCS. Kueh and Lin (2001) indicated that more than half of their onset cases during the years 1979–1995 were frontal-related. Ding and Liu (2001) also noted that 13 out of 47 cases in 1953–1999 were frontal-related SCSSM onset. Therefore, the possible impact of frontal systems on the SCSSM onset, at least for certain years, appears to be indisputable.
Geographically, the SCS is a unique region which not only connects the EASM with the Indian summer monsoon but also links the Asian summer monsoon (ASM) to the Australian monsoon. The SCS is also a sensitive region of the thermal contrast between Asia and Australia (Murakami et al. 1986). Meteorologically, the SCSSM represents a transition between major circulation systems over the Indian Ocean and the western Pacific. It is also exposed to the influences of tropical and mid-latitude synoptic-scale disturbances. As a result, the convections in the SCS are extremely sensitive to the interactions and fluctuations of these multi-scale circulation systems.
This situation implies a unique role for the SCSSM onset in large-scale seasonal variations and was a major motivation of the present study. The main purpose of the present study was to examine the synoptic- and large-scale features around the onset period of the summer monsoon over the South China Sea. Two major objectives are given: (1) to discuss the unique role of the SCSSM onset process in the development of the EASM and (2) to describe the possible linkage between frontal system and large-scale circulations during the SCSSM onset period. The paper is organized as follows. Section 2 describes the data and method used in this study. Section 3 documents the climatology of the EASM evolution and its relation to the SCSSM onset. Section 4 discusses the definition and the interannual variability of the SCSSM onset. Section 5 provides a composite study for describing the relationship between the SCSSM and the synoptic event (frontal system) as well as the large-scale circulations. The final section summarizes this study.
2 Data and methodology
Two sets of data are used in this study: (1) the daily averaged pressure-level data from the National Centers for Environmental Prediction/National Center for Atmospheric Research (NCEP/NCAR) reanalysis data (Kalnay et al. 1996) and (2) the outgoing longwave radiation (OLR) daily averaged data from the National Oceanic and Atmospheric Administration–Cooperative Institute for Research in Environmental Sciences/Climate Diagnostics Center satellite observations (Liebmann and Smith 1996). Both datasets span the years from 1979 to 1998 and have a horizontal grid resolution of 2.5° × 2.5°. The OLR data are commonly used as a proxy to represent large-scale convective activities. However, there are inherent uncertainties in using OLR to describe convective activities in the extra-tropics and other regions with inhomogeneous surfaces. Thus, the OLR data are adopted to describe only convective activities over the tropical and subtropical areas, while features over higher latitudes are disregarded. The long-term daily mean and monthly mean are obtained by arithmetically averaging the 20-year (1979–1998) dataset, hereafter referred to as the climatology.
To define the onset of the SCSSM, we adopted a semi-objective, two-step definition of monsoon onset, as introduced by Kueh and Lin (2001). According to their study, several additional datasets are used for monitoring and defining the SCSSM onset. The surface weather charts compiled by the Japan Meteorological Agency (JMA), the Geostationary Meteorological Satellite (GMS) enhanced satellite IR images, and the best tracks derived from the Joint Typhoon Warming Center (JTWC) have been adopted to track the space–time evaluation of synoptic weather systems, namely, the frontal system or typhoon/tropical cyclone associated with the SCSSM onset. The synoptic- and large-scale features around the onset period are examined through a composite study. A local t test (Chervin and Schneider 1976) is applied to the composite analysis. The details of the definition of the SCSSM onset are provided in Section 4. The composite technique is described in Section 5.
3 Climatology of the EASM transition and the SCSSM onset
This section elucidates the role of the SCSSM onset in the seasonal march of the EASM climatologically using long-term mean data.
3.1 Seasonal transition of the EASM
Figure 1 presents the climatological monthly mean 850-hPa and 200-hPa streamlines superimposed on the OLR and 200-hPa isotachs, respectively. The low OLR over the Tibetan Plateau seems to indicate surface condition (such as snow cover) rather than deep convection. Only the interesting features are highlighted below. From April to June, the most interesting features of the 850-hPa streamlines are the development of a South Asian monsoon trough and the eastward retreat and northward movement of the WPSH. The South Asian monsoon trough is established in May, and the lower level southwesterlies downstream of the trough line prevail over the BoB. In June, the southwesterlies of tropical origin (hereafter referred to as the equatorial southwesterlies) further intrude eastward, turning cyclonically to form a localized monsoon trough (hereafter referred to as the MT) over the SCS. Meanwhile, the WPSH retreats eastward, with the ridge line maintaining an east–northeast orientation. The westernmost tip of the ridge line retreats completely from the SCS region in June when the equatorial southwesterlies penetrate further northeastward and merge with the southeasterlies in the northwestern periphery of the WPSH. Accompanying the development of the monsoonal troughs and equatorial southwesterlies, organized convective activities occur over the BoB and the SCS–tropical Western Pacific region. An elongated frontal-related cloud band also appears along the northwestern periphery of the WPSH. The frontal cloud band signifies the Meiyu season in early summer, namely, the pre-summer rainy season (Tao and Chen 1987; Chen 1994).

Monthly climatological mean 850-hPa (left panels) and 200-hPa (right panels) streamlines superimposed on the OLR and isotachs, respectively. The OLR ≤ 220 W m−2 and isotach ≥ 30 m s−1 are shaded with corresponding intervals of 10 W m−2 and 10 m s−1
The most pronounced upper level features are the development and northward migration of a huge anticyclone, namely, the SAH. In April, the circulation center of the SAH is located over the SCS. It moves northwestward to the Indochina in May and to north of the BoB later in June. Meanwhile, the eastern ridge of the SAH extends further eastward, as do the northeasterlies south of the ridge line. The East Asian jet stream undergoes a poleward withdrawal and structural changes; it distinctly weakens and narrows from April to May, resulting in a much more localized jet core centered near Japan. The jet stream keeps on elongating and weakening in June. This evolution of the mid-latitude upper level westerlies indicates the seasonal transition from winter to summer. The upper and lower level circulations maintain a similar pattern for the next 2 months (July–August, figures not shown), except that the corresponding anticyclones and monsoonal troughs have advanced further northward, revealing the seasonal progression of the Asian summer monsoon circulation. It is noteworthy to point out that the tropical convective activities over the area from the BoB to SCS–tropical Western Pacific region are embedded in a regional thermally direct circulation (referred to as local Hadley-type circulation hereafter) characterized by lower level southerlies (switching eastward from southwesterlies to southeasterlies) and upper level northeasterlies. In contrast, the frontal cloud band takes place in deep westerly layers (varying upward from southwesterlies to northwesterlies), corresponding to a relative baroclinic circulation in the subtropical region.
The oceanic convective activities over the BoB and SCS could have a timescale of much less than a month. Merely examining the monthly mean circulation pattern might result in overlooking some important features on a relative shorter timescale. To elucidate the fluctuations within a month, we further examined the standard deviation of the daily OLRs for May and June (Fig. 2). Note that both the WPSH and SAH act as the large-scale background circulation for these oceanic convective activities; the corresponding monthly mean 850- and 200-hPa streamlines are thus superimposed for reference. Larger daily OLR standard deviation values signify that a relative larger variation in convective activities occur within the month.

Climatological standard deviations of daily mean OLR for May (a) and June (b). The 850-hPa (blue) and 200-hPa (white) streamlines are superimposed. The contour interval for the OLR shading is 5 W m−2
Two relatively large variability centers appear in May. The eastern one, which is centered over the SCS with larger and rather zonally elongated values distributed along the WPSH ridge, extends northeastward from the SCS to the open ocean south of Japan. Such a pattern implies a close relationship between the retreat of the WPSH and convective activities in May. The western center, which resides at the BoB, is related to the existence of the South Asian monsoon trough. Geographically, the Indochina Peninsula acts as a natural barrier between the two OLR variability centers. Although the two variability centers are both beneath the SAH ridges, the one over the SCS coincides with the intersection of the upper level SAH and the lower level WPSH ridge lines. An inspection of the sub-monthly mean circulation reveals that the convection over the SCS breaks out around the second half of May, in association with the full retreat of the WPSH ridge and the northward shift of the eastern SAH ridge, as well as the establishment of the MT (not shown). This is suggestive of a close relationship between the breakdown of the vertical intersection of the ridge lines and the commencement of oceanic convective activities, which all take place over the SCS in a short span of time around late May.
In June, the relative arrangement of the upper and lower level ridge lines has changed. Both ridge lines move north of 20° N and become more zonally orientated. Their superimposition shifts to the open ocean east of 120° E. Relatively larger variability regimes appear on both sides of the ridge lines. The ridge lines appear to be an invisible boundary between these two distinct convective regimes. In the southern part, there are two variability centers over the SCS and over the east of the Philippines, respectively. Note that the large overlap between the southern regime and the aforesaid tropical convections over the SCS–tropical Western Pacific region is expressive of the variation of the convective activities within the Hadley-type circulation. In contrast, the northern regime indicates the subtropical frontal-related variability.
Both the WPSH and the SAH are important components of the EASM. The vertical configuration of the ridge lines of the two giant anticyclones over the SCS is crucial to the early establishment of the EASM. The SCS is thus a key area in exploring the possible connection between the variations of the two ridge lines and the outbreak of the monsoonal convective activities in early summer.
3.2 Relationship between the SCSSM onset and the development of the EASM
Figure 3 shows the sub-monthly mean latitude–pressure cross-sections of the zonal wind and meridional circulation in the East Asia sector (110° E–120° E). The latitudinal variations of the OLR are also imposed; an upward extension of the OLR curve is representative of deep convection. The extratropical region is dominated by upper level westerlies during the entire period. From late April to mid May, the jet core weakens and shifts northward. The jet core maintains its latitudinal position at 30° N–40° N for the rest of the period. There are ascending (descending) motions occurring in the adjacent region south (north) of the jet stream; the descending branch forming a localized jet-transverse circulation in the lower troposphere. The descending motions prevent convection to the north of the jet core, whereas the ascending motions concur with a convective zone, which represents the frontal cloud band.

Vertical cross-sections of the sub-monthly climatological mean zonal wind (contour) and meridional circulation (vector) averaged over the East Asia sector (110° E–120° E). The contour interval is 10 m s−1; the westerly is shaded. The vector scale shown at the bottom is 10 m s−1 for the meridional wind and 10−2 hPa s−1 for the vertical motion. The thick curve shows the longitudinal variation of the averaged OLR; the scale is shown on the right axis
From late May to June, ascending motions in the SCS (10° N–20° N) develop and merge with the jet-related upward branch and the ascending branch along with the ITCZ, resulting in ascending motions prevailing in the entire sector between the jet core and the equator. The great stretch of the ascending motions is accompanied by an increase in convective activities in the SCS and southward movement of the frontal cloud band. The tropical upper level easterlies and lower level westerlies also intensify and advance poleward. Consequently, the enhancement in the upper level northeasterlies and lower level southwesterlies, as well as the increase in convective activities within the ascending branch, concurs to form a local Hadley-type (thermally direct) circulation with the corresponding descending branch, which is absent in the plots shown here, residing in southern hemisphere. The local Hadley-type circulation strengthens in late June and maintains a similar but slightly less intense pattern in July, indicating the full establishment of the summer monsoon circulation.
Given that the zero line along with the anticyclonic zonal wind shear (∂u/∂y > 0) could be representative of the latitudinal location of the ridge lines in 10° N–20° N sector, the northward movement of the SAH ridge and the absence of the WPSH ridge from the SCS are also presented in Fig. 3. Furthermore, the zero line along with the lower level cyclonic zonal wind shear (∂u/∂y > 0) near 20° N indicates the establishment of the MT in late May. The retreat of the WPSH from the SCS leads to the intrusion and prevalence of equatorial southwesterlies and the establishment of the MT and convections therein. The monsoonal convection is embedded in an environment with relatively moderate vertical zonal wind shear, characterized by upper level easterlies and lower level westerlies. In contrast, the frontal cloud band is accompanied by significant vertical and horizontal wind shear in the upper troposphere, yet the entire troposphere is dominated by westerlies that increase in intensity with height.
It is expected to exhibit significant variation in the lower level zonal wind and the relative vorticity in the SCS. To describe the climatological evolution of the localized changes over the SCS, three long-term daily mean monsoon indices averaged over the SCS region are examined (Fig. 4). The region 10° N–20° N, 110° E–120° E is chosen as an area of study for SCS. The area-averaged daily 850-hPa zonal wind and relative vorticity were calculated as monsoonal circulation indicators. The area-averaged daily OLR maintains higher values until mid May when it drops drastically and remains at values of about 220 W m−2 thereafter. Thus, the OLR values were subtracted from a reference value (220 W m−2) to conduct the OLR index which is representative of the variation of convection. A negative OLR index indicates a strong convection occurring in SCS.

Time series of the climatological daily mean monsoon indices averaged over the SCS. The monsoon indices are the 850-hPa zonal wind (gray solid line), the 850-hPa relative vorticity (black solid line), and OLR minus 220 W m−2 (dashed line)
Almost in synchronization with the sudden decrease of the OLR index, the zonal wind and relative vorticity change from negative to positive around mid May. The zonal wind index remains at positive values (westerly) thereafter. The relative vorticity index switches back to negatives in late May to early June; it then changes sign again and remains positive for the rest of the period. The zonal wind index shows an increase in wind speed along with this second sign reversal of the relative vorticity index. Further analysis for daily 850-hPa streamlines reveals that the fold-back transition of relative vorticity index occurs when the WPSH ridge intrudes back into SCS (figures not shown). The positives of the zonal wind index in this short transition turn out to be the southwesterlies north of the ridge line.
Given the sign reversal of zonal wind index as a criterion, the climatological SCSSM onset can be identified as in mid May (around 17 May) when the index turns positive. Meanwhile, the corresponding relative vorticity index and OLR index signify the developments of lower level cyclonic circulation and convective activity, respectively. This climatological SCSSM onset date is in good agreement with many previous researches (e.g., Lau and Yang 1997; Wang and Wu 1997; Xie et al. 1998; Mao et al. 2004). However, the fold-back transition of the relative vorticity index and the nearly concurrent enhancement of the westerly imply that the onset of SCSSM may take place in a short period instead of on a single date. In the period from mid May to early June, the remarkable variations of these three indicators concurred to elucidate a transition of the climatological SCSSM onset process. The timing of this transition is concurrent with the retreat of WPSH, the development of southwesterlies and MT, as well as the outbreak of convective activities, as shown in Fig. 3.
4 Interannual variability of the SCSSM onset
4.1 Definition for SCSSM onset
Climatologically, the onset of SCSSM is characterized by a sudden change of low-level zonal wind direction along with an abrupt development of deep convection in the SCS. The variations of zonal wind and deep convection or rainfall thus often serve as indicators for defining the timing of SCSSM onset. A great variety of local indices with objective or subjective criteria have been proposed to define the onset of SCSSM. These indices usually make use of precipitation data or its proxies derived from satellite data (Tao and Chen 1987; Lau and Yang 1997; Wang and LinHo 2002), low-level winds (Wang et al. 2004), or combined measures of convection and low-level winds (Wang and Wu 1997; Xie et al. 1998; Ding and Liu 2001). These onset indices can be used to determine not only the abrupt onset of SCSSM but also the large-scale circulation transition of an Asian/East Asian summer monsoon. This is suggestive of the importance of the SCSSM onset in regard to the understanding of Asian/East Asian summer monsoon variability.
The SCSSM, also the EASM, develops with a wide variety of synoptic and intraseasonal variations. Thus, atmospheric internal dynamics, intraseasonal oscillation, and sea/land surface conditions over the monsoon regions may all play a role in the onset time. The climatological mean SCSSM onset time is commonly defined as in mid May by numerous researches, yet there is considerable year-to-year variation in the timing of the SCSSM onset (e.g., Lau and Yang 1997; Wang and Wu 1997; Wang et al. 2004; Mao et al. 2004). Kueh and Lin (2001) compared monsoon onset dates, as determined by nine definitions, for the period 1979–1995. In this 17-year period, there were 10 years during which different definitions yielded remarkably diverse onset dates. The diversity implies that the onset dates are controlled by many factors which exhibit different interannual variability. It is a great challenge to define the onset date when each related monsoon component undergoes different interannual variability. The choice of various local variables or definitions, as well as the use of different datasets, could result in a particular emphasis for certain fluctuations. Briefly, it is difficult to seek a universally accepted definition of SCSSM onset.
Geographically, the SCS is exposed to the influences of various synoptic fluctuations, namely, the mid-latitude frontal systems and the tropical cyclones. Considering the attendant synoptic event(s) during the transition of EASM, Kueh and Lin (2001) proposed a semi-subjective, two-step definition in an attempt to study the relationship between the SCSSM onset and the synoptic fluctuations. In this paper, we adopted the definition to determine the timing of SCSSM onset. A brief description of the definition is given below for completeness of the paper.
-
Step 1:
to determine a transition time (Fig. 5a, b)
Fig. 5 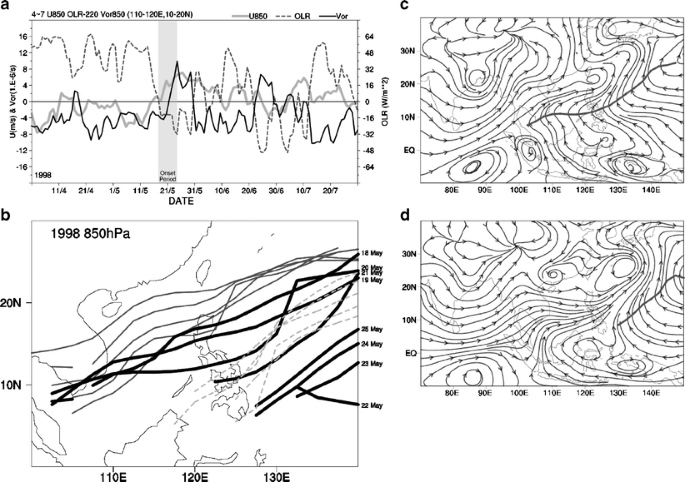
The monsoon indices and 850-hPa ridgelines/streamlines for defining the onset period of the SCS summer monsoon. Take 1998 as an example: a Time series of daily mean monsoon indices averaged over the SCS. The monsoon indices are the 850-hPa zonal wind (gray solid line), the 850-hPa relative vorticity (black solid line), and OLR minus 220 W m−2 (dashed line). b The 850-hPa WPSH ridgelines before/during/after the onset period. The thick black lines indicate the WPSH ridges during the onset period, whereas the dark gray lines and the light gray dashed lines indicate the WPSH ridgelines 5 days prior and subsequent to the onset period, respectively. c, d Composites of the 850-hPa streamlines for the earlier stage and later stage of the onset period, respectively

Three indices, namely, the area-averaged daily 850-hPa zonal wind index (U 850), relative vorticity index (ζ 850), and OLR index (O 220), are taken as auxiliary indicators to pick out available transition time. These monsoonal indices, which are the same as shown in Fig. 4, span from April to August for the entire 20 years. The region 10° N–20° N, 110° E–120° E is chosen as the averaging area. The threshold value 220 W m−2 is again used to conduct the OLR index. The retreat of the 850-hPa WPSH is adopted as a supplementary criterion to verify the transition time.
The available transition time for each year is determined by the following criteria: In May–June, find the first date when rising ζ 850 and falling O 220 intersect each other; the date of the intersection is denoted as\( X_{\zeta } \). The rising ζ 850 and falling O 220 must change sign within 2 days around the\( X_{\zeta } \); ζ 850 (O 220) must be positive (negative) and last for at least 5 days after the sign changing date. The date of intersection for rising U 850 and falling O 220 (denoted as X U ) should also occur in 5 days around the \( X_{\zeta } \). Taking \( X_{\zeta } \) as an auxiliary indicator, the WPSH ridge line should retreat from the SCS in 10 days, which centered on \( X_{\zeta } \). The retreat of the WPSH ridge lines must be sustained for at least 5 days around \( X_{\zeta } \). Search for the next \( X_{\zeta } \) if the retreat of WPSH ridge lines are not maintained for 5 days around the previous \( X_{\zeta } \). The WPSH ridge lines are examined using 850-hPa streamlines.
Taking 1998 as an example, the first \( X_{\zeta } \) occurs on May 21st and corresponds with an X U on May 18th (Fig. 5a). The WPSH ridge line retreats from SCS on \( X_{\zeta } \); the situation lasts for more than 5 days thereafter (Fig. 5b). This \( X_{\zeta } \) satisfies the above criteria and becomes the transition time for 1998. Note that U 850 changes sign several days prior to the \( X_{\zeta } \); it remains positive for a longer period, even though a positive \( X_{\zeta } \) is not reserved in the above criteria.
-
Step 2:
to identify onset type and onset period (Table 1)
Table 1 Descriptions of the SCSSM onset types (second column) and the criteria for defining onset period (third and fourth columns)
Kueh and Lin (2001) classified the onset processes into four types identified by the attendant synoptic event(s) (Table 1, second column) along with the retreat of the WPSH from the SCS and the establishment of equatorial southwesterlies (and/or MT) therein. Accordingly, the onset process is first classified into one of the onset types listed in Table 1. The start and end date of the onset period are then determined corresponding to the onset type for each individual year. Both the onset types and onset period are identified based on combined analyses of 850-hPa streamlines, surface weather charts from JMA, IR images from GMS, and best tracks from JTWC in 20 days which centered on\( X_{\zeta } \). To determine the start and end date of the onset period for different onset types, different criteria are used (Table 1, third and fourth columns). The equatorial southwesterlies are thereafter taken as the southwesterlies originating from the upstream of the SCS (the Equatorial Indian Ocean and BoB). The equatorial southwesterlies flow downstream over the Indochina peninsula, mainly through 5°–15° N sector during and after the SCSSM onset. For a particular onset type, the start date is defined as the day when the corresponding criterion is satisfied accompanied by the retreat of the WPSH ridge from the SCS. The end date is defined as the day when the corresponding criterion is satisfied in association with the intrusion of equatorial southwesterlies and/or the establishment of the MT in the SCS.
The SCSSM onset in 1998 is classified as type III since there is a frontal system approaching the SCS several days prior to the \( X_{\zeta } \), and the onset period is identified as May 18th–25th. Before the onset period, the SCS is under the influence of the WPSH, with the ridge lines extending southwestward into central SCS (thin gray lines in Fig. 5b). During the onset period, the WPSH ridge lines sway gently during the May 18th–20th period; it then retreats from the SCS on May 21st and thereafter (thick black lines in Fig. 5b). After the onset period, the retreat of the WPSH ridge lines last for at least 5 days (thin gray dashed lines in Fig. 5b). Note that the U 850 remains positive, ζ 850(O 220) and increases (decreases) in the onset period (Fig. 5a). Before the onset period, the equatorial southwesterlies do not appear to directly connect with the southwesterlies from the WPSH in northern SCS (figures not shown). The temporal mean 850-hPa streamlines for the earlier stage (May 18th–21st) and later stage (May 22nd–25th) of the onset period demonstrate different circulation patterns in the vicinity of the SCS (Fig. 5c, d). In the earlier stage, a frontal system arrives at northern SCS (Fig. 5c). The equatorial southwesterlies merge with the southwesterlies in northern SCS, yet the central–southern SCS is still under the influence of the WPSH. In the later stage, the entire SCS is controlled by equatorial southwesterlies (Fig. 5d); the frontal system is still evident.
4.2 Interannual variability of SCSSM onset
The resulting onset periods and onset types of the SCSSM in 1979–1998 are summarized in Table 2. For 12 out of the 20 years, from 1979 to 1998, the onset processes are associated with frontal systems approaching the northern SCS, named type III in Table 1. There are another 3 years (type II) in which both the frontal system and tropical cyclone accompany the onset process. In total, during 15 out of the 20 years, the onset process can be related to a frontal system approaching northern SCS. In other words, the frontal system is the most frequent synoptic event associated with the SCSSM onset process. Table 2 reveals that the resulting onset periods appear to have large year-to-year variations. We emphasize an onset period rather than a single onset date because the onset is a process which should span a short transition. The length of the onset period is not identical for each individual year; it varies between 3 and 13 days, with the average being about 7 days.
One noteworthy controversy with the SCSSM onset definition use here arises from the subjective criteria for the duration of onset period. Our onset definition, which is proposed with particular concern for synoptic fluctuations, is somewhat arbitrary and complicated. The relative irregular temporal and spatial variations of synoptic fluctuations lead to the primary difficulty in objectively defining the monsoon onset. For the purpose of describing the synoptic event in association with the SCSSM onset, certain subjective criteria are necessary for determining the timing of the onset. To further examine the rationality of our onset periods, we make comparisons with the onset pentads/dates adopted from Wang et al. (2004, hereafter W04) and Hung and Hsu (2008, hereafter H08).
W04 proposed an objective SCSSM local index making use of the pentad (5-day) mean 850-hPa zonal winds averaged over the central SCS (5°–15° N, 110°–120° E). The SCSSM onset is defined by a shift from a steady easterly to a steady westerly regime. W04 also introduced an objective definition for identifying the first transition of the lower level monsoon circulation of the broadscale EASM using the dominant empirical orthogonal function (EOF) mode (denoted as EOF1), which made use of 850-hPa zonal winds over East Asia and the western North Pacific (0°–40° N, 100°–140° E). Their resultant onset pentads as derived from the local index and large-scale index were highly correlated. This can also be seen from Table 2; the onset pentads for the SCSSM (gray hollow rectangles) are the same as those for the EASM (EASM column), except that for 1983, 1990, and 1991. The great consistency between their onset pentads for the SCSSM and the large-scale EASM indicates that the SCSSM onset signifies the beginning of the broadscale EASM. In 1979–1998, there are 17 out of the 20 years in which our onset periods and W04’s onset pentads overlap (Table 2; black solid squares versus gray hollow rectangle for each year). The other 3 years (1985, 1992, and 1993) are found to have ζ850 < 0 in the onset pentads of W04 (not shown). Furthermore, there are 15 out of those 17 years in which our onset periods overlap the broadscale EASM onset (Table 2; black solid squares versus onset pentad in EASM column for each year). The good agreement in these 17 years indicates that the semi-subjective definition used here is reasonable not only for identifying a rather localized SCSSM onset but also for reflecting a broadscale EASM development.
H08 indicated that the first transition of the ASM concurred with obvious increase in rainfall of Taiwan, which primarily resulted from the stationary front in the pre-summer rainy season in Southern China. Note that the frontal system in our type III corresponds to the stationary front. H08 dated the first transition of the ASM, also making use of the EOF analysis, which is applied to the 5-day running means of 850-hPa stream functions in a larger domain (30° S–50° N, 30° E–180°). The first ASM transition is defined as the sign reversal of the temporal fluctuation of the EOF1 (denoted as PC1). H08 further combined the temporal variations of the PC1 and the rainfall in Taiwan to identify the onset dates and onset types for the first ASM transition; from 1979 to 1998, 3 out of 20 years do not show a clear onset date (they claimed that this was due to irregular temporal variations of PC1). Among these 17 years, there are 5 years in which the ASM onset date overlaps with our onset period. For 7 out of the remaining 12 years, the ASM onset date occurs within 5 days prior or posterior to our onset period. Furthermore, for those 11 type III (1985 is excluded from their result), there are 8 years in which ASM onset dates overlap or are close to our onset periods.
As compared with W04, H08 applied the EOF analysis to a larger domain with a somewhat different variable derived from 850-hPa wind fields. Their data spanned a slightly different duration and under different temporal procedure, namely, 5-day running mean versus pentad mean. Both their results revealed that a sudden change in SCS corresponded to the broadscale summer monsoon transition, yet there is still inconsistency between their resulting onset dates/pentads from 1979 to 1998. There are 5 years in which their resulting onset dates/pentads overlap (Table 2; columns ASM versus EASM). For the remaining 12 years, there are 7 years with the range of differences being about 5 days. The diversity of the timing between the two studies may result from the multiple advancing phases of the broadscale monsoon development in Asia.
Nevertheless, the agreements in the above comparisons provide increased confidence in our findings, especially for the type III cases. The arrival of the frontal system around the SCSSM onset period is thus closely linked not only with the localized abrupt changes in SCS but also with the transition of broadscale ASM/EASM.
5 The connection between large-scale circulation and synoptic events: a composite analysis
In this section, the major characteristics of the SCSSM onset process are examined via a composite analysis in terms of the evolution of the large-scale circulation, as well as the linkage between the SCS monsoonal convective activities and the frontal system.
5.1 Composite technique
To produce a reliable mean feature of the SCSSM onset process on a synoptic timescale, we constructed the composites relative to the onset periods of various onset types. The daily atmospheric variables from the NCEP/NCAR reanalysis dataset were composited in the area 40°–180° E, 20° S–50° N. Each onset period was first divided into two sub-periods; the lengths of the sub-periods varied from 2 to 7 days (Table 2). Temporal averaging for each sub-period was then taken to represent the earlier/later stage of each onset period. For each onset type, both the earlier/later stages of all the cases were then averaged in order to derive the corresponding composite earlier/later stages of the onset period. The resultant composite earlier stage and later stage for each onset type will be hereafter denoted as onset days 0− and 0+, respectively. A time span of 28 days—14-day periods before and after each onset period—was used for the third composite procedure. Finally, each of the individual 14-day pre-/post-onset periods for a particular onset type was averaged to obtain a composite 14-day period. This was produced by aligning the earlier/later stages of each individual case for each onset type; the mean of each variable for each day was then taken. These composite 28 days are denoted as day −14, day −13,..., day −1 in the pre-onset period, and day +1,..., day +13 and day +14 in the post-onset period.
A composite time series of the three monsoon indices are shown in Fig. 6 for the 30-day period centered on the composite onset days 0− and 0+. The temporal variations of the composite monsoon indices for type III reveal an apparent contrast between the 14-day periods before and after the onset (Fig. 6a). The ζ 850 increases sharply from negative to positive, whereas the O 220 drops from positive to negative around onset days 0− and 0+. The ζ 850 and O 220 reach a maximum and minimum respectively in 2 days posterior to the onset. The U 850 also changes sign just prior to the onset. After the onset period, both the positive ζ 850 and U 850 are sustained for the rest of the composite 14-day period, while the O 220 remains negative for about 10 days. The temporal variations of the composite monsoon indices for all-cases appear to be quite similar to those of type III. This agreement can be attributed to the fact that type III is the most frequent type to occur over the past 20 years. For the other three onset types, there are also sign reversals of the composite monsoon indices around the onset (Fig. 6 b–d) which result in similar contrasts between the 14-day periods before and after the onset. However, the temporal variations occurring in these 14-day periods are more oscillatory within a shorter timescale as compared with the composite type III.

Composite time series of the daily mean monsoon indices. a The 850-hPa zonal wind (gray solid line), the 850-hPa relative vorticity (black solid line), and OLR minus 220 W m−2 (dashed line) for type III. b–d Represent the 850-hPa zonal wind, the 850-hPa relative vorticity, and OLR minus 220 W m−2, respectively. The labels ‘0’, ‘1’, ‘2’, ‘3’, ‘4’ are denoted as all-cases, type I, type II, type III, and type IV, respectively. The “all-cases” is the composite for all 20 cases from 1979 to 1998
In considering the similarities among the temporal variations of the monsoon indices for the composite type III and all-cases (Fig. 6), as well as the diversity of the onset characteristics between various onset types (Table 1), in this paper, we chose to devote our attention to the type III composite study. As the frontal-related onset process occurs frequently, the composite analysis particular to the type III should permit a rational and clear view of the possible relationship between the SCSSM onset and the frontal system. Understanding this relationship is useful for further studying the pre-monsoon rainy season in Southern China, the major rainy season in the area. The analyses below will focus on the composites of the 12 frontal-related (type III) onset cases. In view of the fact that composites were compiled from only 12 of the total 20 cases, statistical significances calculated based upon a two-sided Student’s t test were carried out to portray the representativeness of the results herein. The fields with over 95% significance are shaded or denoted as black vectors in the corresponding figures in this section.
5.2 Evolution of the monsoon circulations
Several days before the onset period, the WPSH dominates the region east of 110° E, while the westernmost tip of the ridge line gradually retreats from Indochina (left panels of Fig. 7a, b). The SCS is under the control of the WPSH; the southeasterlies to the south of the ridge line turn anticyclonically to become southwesterlies over the northern SCS. The flow regime to the west of 110° E is characterized by a north/south-oriented twin cyclone straddling the equator. Statistically significant equatorial westerlies (as depicted by the black vectors) appear between the twin cyclone. The equatorial southwesterlies remain mostly in the BoB on day −3, but intrude further northeastward by day −1 when the northern cyclone is gradually enhanced. Only a small portion of the equatorial southwesterlies appears to connect with the southwesterlies over the northern SCS on day −1. Meanwhile, a branch of cross-equatorial flow is found near 105° E, which advances northward and merges with the equatorial southwesterlies from the BoB. Consequently, the northern SCS is under the influence of statistically significant southwesterlies resulting from the confluence of three branches of inflows: the southwesterlies from the northwestern flank of the WPSH, the equatorial southwesterlies, and the cross-equatorial flow near 105° E. The major portion of these northern SCS southwesterlies still comes from the WPSH.

Composites of the 850-hPa (left panels) and 200-hPa (right panels) wind vectors for day −3 (a); day −1 (b); day 0− (c); and day 0+ (d). The black wind vectors indicate where the wind field of either wind component is statistically significant at the 95% level or above. The composite OLR (contour) are superimposed on the 200-hPa wind vectors. Only OLR ≤ 220 W m−2 are plotted; the contour interval is 20 W m−2. Areas where the composite OLR is statistically significant at the 95% level or above are shaded
The most important events of the onset period are the full retreat of the WPSH from the SCS and the further northeastward intrusion of the enhanced equatorial southwesterlies (left panels of Fig. 7c, d). The twin cyclone is still evident; the northern cyclone apparently strengthens, while the southern cyclone weakens. The enhancement of the northern cyclone leads to an acceleration of the equatorial southwesterlies in the BoB. The cross-equatorial flow also intensifies at around 105° E. In the earlier onset stage (day 0−), the equatorial southwesterlies from the BoB and the cross-equatorial flow near 105° E converge on the SCS; however, the central–southern SCS is still under the influence of the cross-equatorial flow. In the later stage (day 0+), the entire SCS is fully occupied by the intensified equatorial southwesterlies. The apparent northeastward penetration of the equatorial southwesterlies is clearly demonstrated by a broad extension of significant southwesterly channel stretches from the BoB to the region south of Japan.
The corresponding composite OLR and 200-hPa wind fields are also shown in the right panels of Fig. 7. Throughout the analysis period, the development of the northern cyclone component of the twin cyclone leads to the intensification and northeastward movement of the large convection in the BoB. The convective activities over southern China and the SCS undergo apparent changes; these will be further described later. The upper level circulations (those taken at 200-hPa for example) are characterized by the SAH and the mid-latitude westerly. On the whole, changes in the upper level flow patterns are less dramatic in comparison to their lower level counterparts. The SAH circulation center is located near northern Indochina, with the eastern ridge lying over the northern SCS. There are upper level diffluent northwesterlies and widely extended northeasterlies straddling the ridge line, both providing favorable conditions for convective activities therein.
Prior to the onset period, an elongated frontal cloud band approaches the southern China coastal area and a mid-latitude lower level anticyclone migrates southeastward along with the frontal cloud band (right panels of Fig. 7a, b). The ridge lines of the WPSH and the SAH vertically intersect over the SCS (also seen in Fig. 10a). The frontal cloud band moves southeastward beneath the diffluent northwesterlies north of the SAH ridge line accompanied by the lower level convergence of the southwesterlies to the south and the northeasterlies from the mid-latitude anticyclone.
On day 0−, the frontal cloud band progressively moves southeastward in association with the northeastward intrusion of lower level equatorial southwesterlies (right panel of Fig. 7c). The frontal cloud band is characterized by a statistically significant, elongated band of low OLR with a local minimum over the northern SCS. At this time, the convective activity over the central–southern SCS is still suppressed. Significant convection, as depicted by a statistically significant low OLR area, occurs over the central SCS on day 0+ when the equatorial southwesterlies dominate the entire SCS (right panel of Fig. 7d). This convection appears to connect with the frontal cloud band; the joint may be indicative of a close relationship between the frontal system and the SCSSM onset. Initially, the frontal cloud band is associated with southwesterlies from the northern branch of the WPSH, but then alters in order to accompany the equatorial southwesterlies originating from the BoB. During the onset period, the SAH circulation center moves sequentially northeastward, while the eastern ridge and the northeasterlies to its south extend further eastward. Consequently, the enhanced northeasterlies/easterlies stretch for a vast area from the SCS to the Equatorial Indian Ocean. The vertical intersection of the two ridge lines over the SCS vanishes (see also Fig. 10). Adjustment in the upper level westerlies also takes place in mid-latitude, associated with the enhancement and migration of the lower level anticyclone.
Throughout the entire period, the regional convective activities remain closely related to the evolutions of the SAH, the WPSH, and the equatorial southwesterlies. The preexisting twin cyclone in BoB has also been documented in previous researches studying the SCSSM onset (e.g., Lau et al 1998; Ding and Liu 2001). Here, the SCSSM was shown to undergo a two-stage onset process similar to that described in Ding and Liu (2001). The convection over the SCS in later stage can be understood as a follow-up to the occurrence of the BoB deep convection and the arrival of the frontal cloud band. The convections over both the BoB and the SCS develop significantly within the lower level equatorial southwesterlies and beneath the upper level diffluent flows from the SAH, yet they are separated geographically. In other words, the convection over the SCS may not be a direct expansion or an eastward displacement of the convection over the BoB. This may be suggestive of an indirect relationship between the convections over these two regions; further description will be given in Fig. 13.
5.3 Moisture transport and upper tropospheric thickness
Sufficient moisture transport is essential to initiate and maintain the active convection associated with the summer monsoon. The left panels of Fig. 8 show the lower tropospheric moisture transport and the moisture flux divergence. The moisture transport and moisture flux divergence over the Tibetan Plateau were unreliable. We focus only on the main features over the BoB and the SCS here.

Composites of the 1,000- to 850-hPa vertically integrated moisture flux (\( q\overrightarrow {v} \); where q is the specific humidity) superimposed on the moisture flux divergence (\( \nabla \cdot q\overrightarrow {v} \)) (left panels) and the 500- to 200-hPa thickness (contour) superimposed on the 200-hPa wind vector (right panels) for day −3 (a); day −1 (b); day 0− (c); and day 0+ (d). The contour intervals of \( \nabla \cdot q\overrightarrow {v} \) and thickness are 10 g s−1 m−2 and 30 m, respectively. Solid (dashed) contour lines refer to positive (negative) values. Areas where \( \nabla \cdot q\overrightarrow {v} \) or thickness is statistically significant at the 95% level or above are shaded. Only vectors for areas where the \( q\overrightarrow {v} \) or wind vector with either zonal/meridional components are statistically significant at the 95% level or above are plotted
The BoB is dominated by strong northeastward moisture transport originating from the tropics. The northeastward moisture transport intensifies and expands northeastward during the onset period. There are localized convergence centers of moisture flux in the central and northeastern BoB; the locations are close to the aforementioned convective centers. In contrast, the moisture transport pattern over the SCS–southern China sector undergoes significant changes. Prior to the onset period, the SCS lies under the influence of less significant westward moisture transports. On day 0−, the moisture transport in the SCS reverses from westward to eastward, primarily the result of the cross-equatorial moisture transport near 105° E. The northeastward moisture transported in the BoB appears to be interrupted by the Indochina peninsula; this can be determined by the absence of flux vectors and the appearance of a localized moisture flux divergence center therein. On day 0+, the northeastward moisture transport in the BoB further intrudes into the SCS and merges with the cross-equatorial moisture transport near 105° E. During the onset period, the major eastward moisture transports results in a statistically significant, elongated moisture flux convergence zone located near to the frontal cloud band.
Although there are statistically significant northward moisture transports over the board area to the south of 10° N throughout the analysis period, the moisture supplied by the equatorial southwesterlies and the cross-equatorial flow are apparently efficient components for allowing moist air from the deep tropics to be transported to the SCS and the mid-latitudes. The locations of the resulting moisture flux convergence are crucial to the development and maintenance of monsoonal convective activities.
The upper level (500–200 hPa) thicknesses, which are often proportional to the layer mean temperature, were also examined. The statistically significant 200-hPa wind fields were imposed in order to indicate the evolution of the SAH circulation. The vast area of larger thickness values over South Asia will be referred to as the thickness ridge hereafter (right panels of Fig. 8). The thickness ridge centers, which lie immediately to the northwest of the SAH circulation centers, reside near the northern tip of the BoB throughout the analysis period. The high overlapping between the SAH circulation and the thickness ridge is apparently indicative of the warm-core structure of the SAH. The reinforcement of the thickness ridge coincides with the strengthening of the SAH circulation. The increase in the thickness values indicates that the upper troposphere is warming up. This is demonstrative of the influence of the upper tropospheric warming on the evolution of the SAH.
Moreover, a large area of statistically significance appears to the south of the thickness ridge center prior to the onset period. During the onset period, the statistically significant area is apparently concentrated upon the thickness ridge as it intensifies. The result is suggestive of the close correspondence between the warming of the upper troposphere and the localized deep convections; this is substantially supported by the continuous lower level moisture supply channel. Consequently, the SCSSM onset process may be understood to be closely related to the evolution of the vast upper tropospheric thermal structure over the Asian monsoon region.
5.4 Localized characteristics in the SCS
To elucidate the development of the localized convection over the SCS, the structural changes of vertical kinematic and thermodynamic profiles averaged over the area are examined (Fig. 9). The apparent heat source and apparent moisture sink introduced by Yanai et al. (1973) were adopted to describe the heating/drying associated with monsoonal convective activities.

Composite vertical profiles of the relative vorticity and divergence (left panels), the vertical motion, heating rate Q 1/c p and drying rate Q 2/c p (central panels), the equivalent potential temperature, and the saturated equivalent potential temperature (right panels) averaged over the SCS for the 5-day mean before (a); earlier stage of (b); later stage of (c); and 5-day mean after (d) the onset period. The corresponding units for the relative vorticity, divergence, heating/drying rate, vertical motion, and equivalent potential temperature are 1 × 10⁻⁶ s−1, 2 × 10⁻⁶ s−1, K day−1, hPa h−1, and K, respectively. The vertical gray solid lines on each right panel portray the corresponding equivalent potential temperature value at the lowest level and the minimum value in the mid-troposphere, respectively. The vertical gray solid line for the equivalent potential temperature value at the lowest level also elucidates the process for a parcel raised pseudo-adiabatically from that level. The intersection of this vertical gray line and the saturated equivalent potential temperature curve represents the level of the free convection (LFC). The horizontal gray solid line indicates the 850-hPa pressure level
There are structural changes in the kinematic fields, namely, the relative vorticity and the divergence (left panels of Fig. 9). Five days before the monsoon onset, the relative vorticity is negative (anticyclonic) throughout the entire troposphere. The anticyclonic vorticity increases upward, reaching a maximum value in the upper troposphere. The vorticity profile remains negative on day 0−, but its intensity is slightly reduced. The divergence profiles reveal the development of divergence and convergence in the upper and lower troposphere, respectively. Significant changes occur on day 0+ when the cyclonic vorticity appears in the lower troposphere, extending from the surface up to the 700-hPa level. This is illustrative of the establishment of the MT. Both the upper level divergence and the lower level convergence are moderately enhanced. After the monsoon onset, the lower tropospheric cyclonic vorticity is obviously strengthened, with a maximum at the 850-hPa level. The upper tropospheric anticyclonic vorticity increases at the same time. Note that the enhancement of the lower tropospheric convergence precedes that of the lower tropospheric cyclonic vorticity in the onset period.
The enhanced convergence in the lower troposphere is compensated for by the increased divergence in the upper troposphere. This coincides with the reinforcement of the upward vertical motion during and after the onset period; the heating rate (Q 1/c p ) and the drying rate (Q 2/c p ) apparently also increase (central panels of Fig. 9). There is a deep and intense tropospheric heating/drying rate associated with upward vertical motion. The maximum heating (positive heating rate) occurs at 400-hPa, while the maximum moisture sink (positive drying rate) occurs at a relatively lower level (700-hPa). There is a clear separation between the level of maximum heating and the level of maximum moisture sink, indicating the highly convective nature of the atmosphere (Luo and Yanai 1984). The heating rate is higher than the drying rate above the 600-hPa level throughout the entire onset period and shows contributions from eddy vertical transports due to cumulus convection. In the lower troposphere, the two profiles are considerably closer to each other on day 0−, implying that a higher percentage of stratiform cloud/precipitation occurs along with the convective activities. On day 0+, the lower tropospheric drying rate is larger than the heating rate, indicating the dominance of deep cumulus convection. Briefly, there is a transformation from a mixture of stratiform and convective types in the earlier stage into a deep convective type in the later stage. This transformation will be further addressed in Fig. 11. The heating profiles and upward vertical motions intensify for at least 5 days posterior to the onset period. The aforementioned mean vertical heating rate profiles show strong heating in the deep troposphere, corresponding with positive drying rates above 925-hPa and a slight cooling (mostly due to moistening) near the surface. These features reveal that the heating over the SCS can be mostly attributed to the latent heat released during and after the monsoon onset. The enhanced upward vertical motion further compensates for the upper level divergence via lower level convergence; this corresponds to the development of deep convective activities.
The vertical profiles of equivalent potential temperature (θ e) and saturated equivalent potential temperature (θ se) describe changes in the thermal structure (right panels of Fig. 9). Throughout the composite period, the atmosphere below 500-hPa remains in a condition of convective (potential) instability and conditional instability, which may be simply defined as a decrease in the θ e and θ se with height, respectively. This distribution of the thermal profile is typical of a tropical atmosphere. The vertical θ e profiles exhibit evident warming in the middle troposphere. Further examination of the 14-day pre-onset/post-onset period reveals that the θ e at 500-hPa remains at a value of about 333 K in each day of the pre-onset period, whereas the value increases to above 336 K in the post-onset period (figure not shown). There are no distinguishable differences found among the potential temperature profiles throughout the composite period (figure not shown). Thus, the increase in the middle tropospheric θ e can be mostly attributed to the moistening of the troposphere. As mentioned previously, the moistening should result from the moisture supply of the tropics carried by the southwesterlies. The θ se profiles remain quite similar throughout the composite period and therefore result in an apparent decrease in the difference between the θ se and the θ e in each level below the 300-hPa during and after the onset period. Again, this feature is indicative of the moistening in the troposphere. There is also a fall in the level of free convection (LFC) subsequent to the onset period, which is shown in the tagged LFC value of each panel. Furthermore, the daily LFC remains at a level of about 880-hPa during the 14-day post-onset period, whereas it remains approximately 872-hPa for the 14-day pre-onset period (figure not shown). Here, the LFC were derived from area-averaged values in the SCS, yet the changes in the LFC may still be indicative of atmospheric instability. On day 0−, the short span of the rising LFC is more or less suggestive of a stabilization of the atmosphere in response to an outbreak of convective activity. Meanwhile, the persistent fall in the LFC after the onset signifies a more favorable environment for the monsoonal convective activities over the SCS.
The structural changes in the relative vorticity point to an enhancement of the SAH and the retreat of the WPSH. The establishment of the lower tropospheric cyclonic vorticity, which is characteristic of the development of MT, is preceded by the increase in lower tropospheric convergence. This situation concurs with the attendant upward motion and heating/drying profiles and is a signature of latent-heating-induced atmospheric circulation. The significant warming and moistening in the troposphere is mainly attributable to the latent heat release of the monsoonal convective activities and moisture transport from the tropics, respectively. The enhanced upward motion results in strengthening upper level divergence, which may in turn reinforce the SAH through the beta effect under a vorticity balance requirement. This is consistent with the basic mechanism for the maintenance of the subtropical high proposed by Hoskins (1996).
5.5 Establishment of the local Hadley-type circulation
This section illustrates the SCSSM onset process in terms of the establishment of a local Hadley-type (thermally direct) circulation and its corresponding thermal structure.
Prior to the onset period, the WPSH and the SAH ridge lines vertically intersect over the SCS (right panel of Fig. 10a). During the onset period, the location of this intersection shifts eastward due to the retreat of the WPSH and the northward movement of the SAH (right panels of Fig. 10b, c). The 200-hPa East Asian jet stream undergoes a reorganization, forming a new jet core to the north of the circulation center of the SAH. The onset process is accompanied by an elongation of the jet core and a statistically significant extension of the tropical upper level easterlies. There is southward movement of a frontal cloud band just beneath the south side of the reorganized jet stream (left panels of Fig. 10a, b). The frontal cloud band is accompanied by enhanced ascending motion, northward and upward withdrawal of upper level westerlies, and significant southward extension of the lower level westerlies. The presence of the deep ascending motion prevents downward westerly momentum transport. Thus, the lower level westerlies in SCS (10°–20° N) cannot be understood as the downward intrusion of the mid-latitude westerlies. The lower level westerlies shall result from the northeastward intrusion of the equatorial southwesterlies. On day 0+, significant convection develops in SCS that corresponds to the significant southward expansion of the ascending motion and the enhancement of the lower level southwesterlies (left panel of Fig. 10c). The major upward branch shifts from around 20° N to about 15° N in association with a vanishing of the frontal cloud band and the outbreak of the tropical convection in SCS. Posterior to the onset period, there is a concurrent enhancement of the convection, an ascending motion and lower level southwesterlies in the SCS. The deep upward motion in the SCS becomes the ascending branch of a local Hadley-type circulation, with the attendant descending branch residing at around 5°–10° S. This ascending branch links the lower level southwesterlies and the upper level return flow, namely, the divergent northeasterlies from the SAH. Note the less significant cross-equatorial flow in between the ascending and the descending branches; the smaller significance may result from the zonal averaging.

Composite vertical cross-sections of the zonal wind (contour) and meridional circulation (vector) averaged over the East Asia sector (110° E–120° E, left panels) and the 200-hPa zonal wind (right panels) for the 5-day mean before (a); earlier stage of (b); later stage of (c); and 5-day mean after (d) the onset period. The contour interval of the zonal wind is 5 m s−1. Solid (dashed) contour lines refer to positive (negative) values. The vector scale shown at the bottom is 20 m s−1 for the meridional wind and 2 × 10⁻² hPa s−1 for the vertical motion. For each left panel, the thick curve shows the longitudinal variation of the averaged OLR; the scale is shown on the right axis. The black wind vectors indicate where the meridional circulation of either wind component is statistically significant at the 95% level or above. Areas where the zonal wind is statistically significant at the 95% level or above are shaded. For each right panel, the thick gray line and thick black line represent the 200-hPa SAH ridgeline and the 850-hPa WPSH ridgeline, respectively. Areas where the 200-hPa zonal wind is statistically significant at the 95% level or above are shaded
Inspection of the heating/drying profiles elucidates a transition between the frontal cloud band and the sequence of monsoonal convective activities (Fig. 11). Prior to the onset period, the frontal cloud band (along ∼25° N) is accompanied by both heating and drying (moisture sink) distributions with vertically separated maximum centers. A lower level moisture source, which results from the mid-latitude cold air surge, appears to the north of the frontal cloud band. On day 0−, the frontal cloud band moves southward alongside the southward expanding heating and drying distribution. At this stage, the upper level elongated heating maximum (about 15°–25° N) is accompanied by a lower level drying maximum centered near 25° N. It is apparent that the area-averaged heating/drying profiles in Fig. 9 are derived from the southern part of this heating and drying distribution, which explains a mixture of stratiform cloud/precipitation along with the frontal-related convection. Note also the good correspondence between the heating distribution and the remarkable warming of the troposphere which exhibits a deep vertical extent over the 10°–30° N sector (left panel of Fig. 12b). On day 0+, the southern part of the previous elongated heating maximum enhances, whereas the northern part vanishes. This enhanced heating maximum is centered at about 15° N along with a lower lever drying maximum center, indicating the occurrence of deep convection. The warming in the middle troposphere also extends further southward. Consequently, both the frontal cloud band and the tropical convection contribute to the warming of the troposphere. The heating and drying distributions, which are representative of deep convection, further amplify posterior to the onset period. There is also concurrent wetting in the troposphere over the 10°–30° N sector (right panels of Fig. 12). The wetting in response to the substantial lower level moisture transport can be indicated by the gradually upward displacement of the thick specific humidity contour (12 g kg−1) on the plot.

Composite vertical cross-sections of the heating rate Q 1/c p (left panels) and drying rate Q 2/c p (right panels) averaged over the East Asia sector (110° E–120° E) for the 5-day mean before (a); earlier stage of (b); later stage of (c); and 5-day mean after (d) the onset period. The contour intervals of the heating rate and the drying rate are 1 K day−1. Solid (dashed) contour lines refer to positive (negative) values. The wind vectors, which are the same as in Fig. 10, indicate where the meridional circulation of either wind component is statistically significant at the 95% level or above. Areas where the heating rate (left panels) or drying rate (right panels) is statistically significant at the 95% level or above are shaded

Composite vertical cross-sections of the equivalent potential temperature (left panels) and specific humidity (right panels) averaged over the East Asia sector (110° E–120° E) for the 5-day mean before (a); earlier stage of (b); later stage of (c); and 5-day mean after (d) the onset period. The contour intervals of the equivalent potential temperature and the specific humidity are 4 K and 2 g kg−1, respectively. The thick contours in the left (right) panels are 336 K (12 g kg−1). The wind vectors, which are the same as in Fig. 10, indicate where the meridional circulation of either wind component is statistically significant at the 95% level or above. Areas where the equivalent potential temperature (left panels) or specific humidity (right panels) is statistically significant at the 95% level or above are shaded
During the onset period, the ridge lines of the WPSH and the SAH no longer vertically intersect each other over the SCS. The most pronounced feature is the development of the local Hadley-type circulation in which the ascending branch links up the lower level equatorial southwesterlies and the upper level return flow from the SAH. The breakdown of the vertical intersection of the ridge lines is presumed to be related to the development of the localized convective activities over the SCS. The transition of the heating and drying distribution is again suggestive of the two-stage process of the SCSSM onset.
5.6 Vertical linkage between the WPSH and the SAH
The role of the SCSSM onset in the vertical linkage between the WPSH and the SAH will be discussed below. Figure 13 shows the vertical cross-sections of the meridional wind component and longitudinal circulation along 15° N. Along the latitude of 15° N, the BoB is roughly located in 80°–100° E, while the SCS is situated around 110°–120° E, with the Indochina peninsula in between.

Composite vertical cross-sections of the meridional wind (contour) and longitudinal circulation (vector) along 15° N for the 5-day mean before (a); earlier stage of (b); later stage of (c); and 5-day mean after (d) the onset period. The contour interval of the meridional wind speed is 2.5 m s−1. Solid (dashed) contour lines refer to positive (negative) values. Areas where the meridional wind component is statistically significant at the 95% level or above are shaded. The vector scale shown on the bottom right is 40 m s−1 for the zonal wind and 4 × 10⁻² hPa s−1 for the vertical motion, respectively. The black wind vectors indicate where the longitudinal circulation of either wind component is statistically significant at the 95% level or above. The thick curve shows the latitudinal variation of the OLR, with scale shown on the right axis
Prior to the onset period, the primary ascending motion and convective activities are restricted to the west of 110° E. The deep ascending motion appears to merge with the upper level flow from the SAH. The convection in BoB is associated with a middle tropospheric cyclone, as depicted by the meridional wind fields. The SCS is controlled by southeasterlies originating from the southern periphery of the WPSH at below 600-hPa. At the middle level, the southeasterlies climb upward and merge into the upper level flow from the SAH. This configuration is suggestive of a vertical coupling between the WPSH and SAH; the SCS is, moreover, a key region for the coupling. Recall that this is the period when the ridge lines of the WPSH and SAH vertically intersect in the SCS.
On day 0−, evident change occurs in the SCS where a statistically significant ascending branch replaces the previous vertical linkage between the WPSH and SAH. At this time, the convection in the BoB enhances along with the intensification of the ascending branch and the attendant middle tropospheric cyclone. Meanwhile, part of the enhanced lower level southwesterlies in the BoB passes through the Indochina peninsula and reaches the SCS. Note that there is a local lower level southerly maximum center in SCS resulting from the cross-equatorial flow near 105° E. This cross-equatorial flow arrives in the SCS, climbs up, and connects with the ascending motion of the frontal system (see Fig. 10b). Consequently, the lower level southwesterlies from the BoB merge with the cross-equatorial flow and form the ascending branch over the SCS. The resultant ascending motion merges upward into the enhanced northeasterlies south of the SAH ridge line. The flow patterns and convections in the sector from the BoB to SCS apparently intensify on day 0+, yet the local lower level southerlies in SCS weaken. Also, note the significant enhancement of the southwesterlies passing through the Indochina peninsula as well as the outbreak of the convection in the SCS. The above feature marks the importance of the equatorial southwesterlies to the convective activities in the SCS in the later stage of the onset period. The flow patterns and convections maintain similar features for at least 5 days after the onset period, with upward extension and enhancement of the lower level southerlies in the SCS.
Although both are embedded in lower level equatorial southwesterlies and upper level return flow from SAH, there is a clear regional discrepancy between the convective systems in the SCS and BoB. The convection in the BoB is accompanied by a middle tropospheric cyclone, whereas that in the SCS is characterized by a lower level MT located just to the north of 15° N. Despite the close connection between the circulations over these regions, the SCSSM onset is not simply an eastward extension of the circulation system from the BoB. Moreover, the commencement of monsoonal convective activities in the SCS may be demonstrative of the breakdown of the vertical linkage between the WPSH and SAH in the area. This is unique to the monsoon region.
6 Summary and discussion
Climatologically, the development of the EASM can be interpreted in terms of the seasonal variations of the WPSH and the SAH as well as in the reductions of the East Asian jet stream and the establishment of the local Hadley-type circulation. The localized convective activities over the BoB, the SCS, and southern China are signatures of the advancing EASM. The SCSSM onset is an abrupt process that includes the outbreak of southwesterlies and localized convective activities and usually occurs over a very short time period. It also accounts for the first transition of large-scale circulation over East Asia. The SCS is a key region for the seasonal migrations of the WPSH and the SAH, with the former retreating northeastward while the latter advances northwestward; both take place over the SCS during the SCSSM onset period. Since the onset process of the SCSSM occurs within a transition of a large-scale background dominated by these two huge anticyclonic circulation systems, the local variations in the SCS region can also be used as indicators of the large-scale seasonal variation of the EASM.
The semi-subjective, two-step definition proposed by Kueh and Lin (2001) was adopted to determine the timing of the SCSSM onset in 1979–1998. The definition made use of daily data to preserve synoptic signals and combined both objective and subjective criteria based on the evolutions of lower level circulation and various area-averaged monsoonal indices. The resulting onset period is reasonable not only for identifying a rather localized SCSSM onset but also for reflecting a broadscale EASM transition. The frontal system is the most frequent synoptic event associated with the SCSSM onset process. Composite analysis was conducted to study the frontal-related SCSSM onset process.
Prior to the onset, the large-scale pre-condition is dominated by the lower level WPSH and the upper level SAH. The ridge lines vertically intersect over the SCS prohibiting convective activities in the area. A twin cyclone with an attendant deep convection preexists in the BoB as a frontal system approaches Southern China. Both synoptic events occur within the upper level diffluent easterlies/northeasterlies from the SAH, providing favorable conditions for convections.
During the onset period, the relative configuration of the WPSH and the SAH undergoes significant change. The ridge line intersection moves away from the SCS as a result of the retreat of the WPSH and the northward shift of the SAH ridge line. This coincides with the intrusion of the equatorial southwesterlies and the lower level moisture transport. The SCSSM undergoes a two-stage onset process characterized by the southward intrusion of the frontal system in the earlier stage and the outbreak of the tropical convection in the later stage. In the earlier stage, the eastward equatorial southwesterlies and the northward cross-equatorial flow near 105° E converge in the SCS. At that time, both contribute to the moisture transport. The equatorial southwesterlies prevail over the region from the BoB to the SCS in the later stage. This coincides with the emergence of monsoonal convective activities over the SCS and the establishment of a broad moisture channel from the tropics, which in turn provides favorable conditions for the development of deep monsoonal convections. The eastward intrusion of equatorial southwesterlies is closely related to the reinforcement of the preexisting twin cyclone in the BoB. The enhancement and the eastward extension of the SAH/thickness ridges concur with the intensification of the lower level moisture transport and convective activities over the BoB and the SCS. This is suggestive of the close correspondence between the warming of the upper troposphere and the localized deep convections which is substantially supported by the continuous lower level moisture supply channel. Overall, the SCSSM onset leads to the development of the local Hadley-type circulation in which the ascending branch links up the lower level equatorial southwesterlies and the upper level return flow from the SAH.
The most pronounced features in the SCS are the development of the convective activities and the lower tropospheric cyclonic vorticity, which are characteristic of the development of MT. The concurrence of the enhanced upward motion and heating/drying distributions, as well as the sufficient lower level transport, results in significant warming and moistening in the troposphere. Consequently, the increase in lower tropospheric convergence precedes the establishment of the lower tropospheric cyclonic vorticity. This is a signature of the latent-heating-induced localized monsoon trough in the SCS. Moreover, the transformation in the monsoonal convective types, as depicted by the heating/drying rates, is also indicative of the two-stage onset of the SCSSM. The result reveals that the convection occurring in the later stage is related to the tropical disturbances, whereas the earlier stage is controlled both by mid-latitude and tropical disturbances. In addition, the enhanced upward motion results in a strengthening upper level divergence, which may in turn reinforce the SAH. It is suggested that the circulation pattern itself can generate a favorable environment for the monsoonal convective activities, thus maintaining a self-amplifying monsoonal system. Finally, the breakdown of the vertical ridge line intersection is presumed to be related to the development of the localized convective activities over the SCS. This is unique to the monsoon region.
The present study is concerned only with the connection between the SCSSM onset and the vertical linkage between the WPSH and the SAH. We do not attempt to explore the seasonal evolution mechanism of the WPSH and the SAH, nor do we attempt to explore the mechanism of the vertical intersection of ridge lines just prior to the SCSSM onset period. Mao et al. (2004) defined the ridge surface of the subtropical anticyclone as a westerly–easterly boundary (WEB) and argued that the WEB can be maintained by the thermal wind constraint. They examined the seasonal variation, as well as the SCSSM onset, in terms of the tilt of the WEB. Their results revealed a vertical intersection of ridge lines over monsoon regions similar to our findings. The vertical intersection of ridge lines vanishes below 500 hPa over the SCS during the onset period, although the mechanism of this situation was not fully investigated in their work. In this study, we might consider this absence of lower tropospheric WEB as a breakdown of the thermal wind balance due to the enhanced monsoonal convective activities in the SCS. Nevertheless, the dynamical coupling between the WPSH and the SAH remains under-documented. Such coupling processes might involve much more complicated multi-scale interactions, but they are beyond the scope of the present study.
The importance of the lower level moisture supplying channel is a well-known feature in the development of the EASM (e.g., Tao and Chen 1987; Chen 1994). In our study, the enhancement and the northeastward intrusion of the equatorial southwesterlies, as well as the moisture transport, are closely related to the preexisting twin cyclone in the BoB. This twin cyclone event may also be found in several previous studies (Lau et al. 1998; Chan et al. 2000; Ding and Liu 2001). Lau et al. (1998) further related the twin cyclone event to the eastward propagating Madden–Julian oscillation. The MJO, or certain of tropical intraseasonal oscillation, is thus suggested as a precursor to monsoonal convective activities over the SCS. Furthermore, according to our composite study, the cross-equatorial moisture transport near 105° E may also contribute to the SCSSM onset. While the cross-equatorial flow around 105° E during the SCSSM onset has also been documented by several previous studies, its influence on the onset process remains a controversy (e.g., Chang and Chen 1995 versus So and Chan 1997).
The arrival of the frontal system is likely a trigger for the first outbreak of deep convection in central–southern SCS. The SCSSM onset has been connected to the approach of the mid-latitude frontal system by some previous studies (e.g., Chang and Chen 1995; Ding and Liu 2001; Lau et al. 1998; Chan et al. 2000). Some studies considered the arrival of the frontal system as a trigger for the SCSSM onset (Chang and Chen 1995; Chan et al. 2000). Recent studies on the 1998 SCSSM onset process suggested that there exists a kind of positive feedback mechanism between the large-scale circulation and the mesoscale convective systems (MCSs; Johnson and Ciesielski 2002; Ding et al. 2004; Ding and Chan 2005). The large-scale circulation provides favorable conditions for the formation of MCSs, while the occurrence of persistent MCSs, in turn, produces obvious feedback related to the large-scale circulation by way of latent heat release. In addition, the numerical simulation results of Lin and Kueh (2003) suggested that frontal activities over the northern SCS might be a possible triggering mechanism for localized monsoonal convective activities over the SCS. The present composite analysis is consistent with these previous studies. It is suggested that while the large-scale condition may be favorable to the development of monsoonal convective activities over the SCS, the frontal system to the north acts as a triggering mechanism for the subsequent development of the organized MCSs, which in turn enhances the large-scale circulation through latent heat release. These sequential processes result in a self-intensifying monsoon system.
References
Chan JCL, Wang YG, Xu XJ (2000) Dynamic and thermodynamic characteristics associated with the onset of the 1998 South China Sea summer monsoon. J Meteor Soc Japan 78:367–380
Chang C-P, Chen GT-J (1995) Tropical circulation associated with southwest monsoon onset and westerly surges over the South China Sea. Mon Weather Rev 123:3254–3267
Chen GT-J (1994) Large-scale circulations associated with the East Asian summer monsoon and the Mei-Yu over South China and Taiwan. J Meteorol Soc Jpn 72:959–983
Chervin RM, Schneider SH (1976) On determining the statistical significance of climate experiments with general circulation models. J Atmos Sci 33:405–412
Ding Y, Chan JC-L (2005) The East Asian summer monsoon: an overview. Meteorol Atmos Phys 89:117–142
Ding Y, Liu Y (2001) Onset and the evolution of the summer monsoon over the South China Sea during SCSMEX field experiment in 1998. J Meteorol Soc Jpn 79:255–276
Ding Y, Li C, Liu Y (2004) Overview of the South China Sea Monsoon experiment. Adv Atmos Sci 21:343–360
He H, McGinnis JW, Song Z, Yanai M (1987) Onset of the Asian summer monsoon in 1979 and the effect of the Tibetan Plateau. Mon Weather Rev 115:1966–1995
Hoskins BJ (1996) On the existence and strength of the summer subtropical anticyclones. Bull Am Meteorol Soc 77:1287–1292
Hsu H-H, Terng C-T, Chen C-T (1999) Evolution of large-scale circulation and heating during the first transition of Asian summer monsoon. J Climate 12:793–810
Hung C-W, Hsu H-H (2008) The first transition of the Asian summer monsoon, intraseasonal oscillation, and Taiwan Meiyu. J Climate 21:1552–1568
Johnson RH, Ciesielski PE (2002) Characteristics of the 1998 summer monsoon onset over the northern South China Sea. J Meteorol Soc Jpn 80:561–578
Kalnay E, Kanamitsu M, Kistler R, Collins W, Deaven D, Gandin L, Iredell M, Saha S, White G, Woollen J, Zhu Y, Chelliah M, Ebisuzaki W, Higgins W, Janowiak J, Mo K-C, Ropelewski C, Wang J, Leetma A, Reynolds R, Jenne R, Joseph D (1996) The NCEP/NCAR 40-year reanalysis project. Bull Am Meteorol Soc 77:437–471
Kueh M-T, Lin S-C (2001) East Asian summer monsoon—onset definition and circulation characteristics during onset period. Atmos Sci 29:141–170 (in Chinese with English abstract)
Lau K-M, Li M-C (1984) The monsoon of East Asia and its global associations—a survey. Bull Am Meteorol Soc 65:114–125
Lau K-M, Yang S (1997) Climatology and interannual variability of the Southeast Asian summer monsoon. Adv Atmos Sci 14:141–161
Lau K-M, Kim K-M, Yang S (2000) Dynamical and boundary forcing characteristics of regional components of the Asian summer monsoon. J Climate 13:2461–2481
Lau K-M, Wu H-T, Yang S (1998) Hydrologic processes associated with the first transition of the Asian summer monsoon: a pilot satellite study. Bull Am Meteorol Soc 79:1871–1882
Li C, Wu J (2000) On the onset of the South China Sea summer monsoon in 1998. Adv Atmos Sci 14:176–194
Liang X-Z, Wang W-C (1998) Associations between China monsoon rainfall and tropospheric jets. Q J R Meteorol Soc 124B:2597–2623
Liebmann B, Smith C (1996) Description of a complete (interpolated) outgoing longwave radiation dataset. Bull Am Meteorol Soc 77:1275–1277
Lin S-C, Kueh M-T (2003) A modeling diagnosis of the development of mesoscale convective systems over the South China Sea during the summer monsoon onset in 1998. TAO 14:369–399
Luo H, Yanai M (1984) The large-scale circulation and heat sources over the Tibetan Plateau and surrounding areas during the early summer of 1979. Part II: heat and moisture budgets. Mon Weather Rev 112:966–989
Mao J, Chan JC-L, Wu G (2004) Relationship between the onset of the South China Sea summer monsoon and the structure of the Asian subtropical anticyclone. J Meteorol Soc Jpn 82:849–859
Murakami T, Chen L, Xie X (1986) Relationship among seasonal cycles, low-frequence oscillations and transient disturbances as revealed from outgoing long wave radiation data. Mon Weather Rev 114:1456–1465
So C-H, Chan JC-L (1997) An observational study on the onset of the summer monsoon over South China around Hong Kong. J Meteorol Soc Jpn 75:43–57
Tao S-Y, Chen L-X (1987) A review of recent research on the East Asian monsoon in China. In: Chang C-P, Krishnamurti TN (eds) Monsoon meteorology. Oxford University Press, Oxford, pp 60–92
Wang B, LinHo (2002) Rainy seasons of the Asian-Pacific monsoon. J Climate 15:386–398
Wang B, Wu R-G (1997) Peculiar temporal structure of the South China Sea summer monsoon. Adv Atmos Sci 14:176–194
Wang B, LinHo ZY, Lu M-M (2004) Definition of South China Sea monsoon onset and commencement of the East Asia summer monsoon. J Climate 17:699–710
Xie A, Chung Y-S, Liu X, Ye Q (1998) The interannual variations of summer monsoon onset over the South China Sea. Theor Appl Climatol 59:201–213
Yanai M, Esbensen S, Chu J-H (1973) Determination of bulk properties of tropical cloud clusters from large-scale heat and moisture budgets. J Atmos Sci 30:611–627
Acknowledgements
We thank the two anonymous reviewers for their constructive comments. This study was supported by the National Science Council in Taiwan under Grants NSC91-2111-M-008-030 and NSC92-2111-M-008-016.
Author information
Authors and Affiliations
Corresponding author
Rights and permissions
About this article
Cite this article
Kueh, MT., Lin, SC. A climatological study on the role of the South China Sea monsoon onset in the development of the East Asian summer monsoon. Theor Appl Climatol 99, 163–186 (2010). https://doi.org/10.1007/s00704-009-0136-7
Received:
Accepted:
Published:
Issue Date:
DOI: https://doi.org/10.1007/s00704-009-0136-7