
Abstract
Evaluation of rock abrasivity is important when utilizing mechanized excavation in various mining and civil projects in hard rock. This is due to the need for proper selection of the rock cutting tools, estimation of the tool wear, machine downtime for cutter change, and costs. The Cerchar Abrasion Index (CAI) test is one of the simplest and most widely used methods for evaluating rock abrasivity. In this study, a new device for the determination of frictional forces and depth of pin penetration into the rock surface during a Cerchar test is discussed. The measured parameters were used to develop an analytical model for calculation of the size of the wear flat (and hence a continuous measure of CAI as the pin moves over the sample) and pin tip penetration into the rock during the test. Based on this model, continuous curves of CAI changes and pin tip penetration into the rock were plotted. Results of the model were used for introduction of a new parameter describing rock–pin interaction and classification of rock abrasion.
1 Introduction
Excavation of rock in civil and mining applications is accomplished by use of the mechanized technologies or by drilling and blasting techniques (Hood and Roxborough 1992). In mechanized excavation, the cutters, including disks or picks, are mounted on the cutting head and are in contact with the rock at the cutting surface. The cutters transfer the forces and energy to the rock for fragmentation. Wear of the cutting tools is one of the most important parameters in this process for evaluating the economic efficiency of the operation (Maidl et al. 2008). Penetration of the cutter tip into the face and subsequent interaction between the cutters primarily depends on the geometry of the cutting tool at the contact point, which varies based on the wear condition of the tools. Increased bluntness of the cutter tips will require a higher cutting force to achieve a certain amount of penetration (Rad 1975). Costs involved in the replacement of the cutters and the related machine downtime substantially increase for highly abrasive rocks. Thus, a proper measurement of the rock abrasion would be very useful in estimating the cutting tools’ life and cost.
Wear in general could be defined as the undesirable and continuous loss of the material from a solid surface due to the mechanical interactions such as, contact and relative motion between two bodies (Zum Gahr 1987). In fact, the wear and frictional properties of a material are not intrinsic properties, but instead, they are behavioral parameters that are associated with the operational conditions (Stolarski 2000). Abrasivity is a general term which refers to characteristic of the interaction of two objects and as a concept, has not been explicitly defined. In other words, the abrasivity of a certain rock depends on the properties of the cutting tool or the body exposed to wear, as well as the properties of the rock, and the dominant conditions of temperature and pressure (Verhoef 1997).
Laboratory testing is the common procedure to assess the abrasivity of the rocks. Several tests have been developed for this purpose. However, the basic problem in most of the tests is that the results are highly dependent on the test conditions and mechanisms used in performing the tests. Therefore, the testing mechanism and its similarity with the real conditions of the tool–rock interaction in the process of wear is the most important parameter in design and selection of the methods for the rock abrasion characteristics (Verhoef 1997).
The Cerchar Abrasion Index (CAI) test is a simple and fast method compared with the other rock abrasion tests that have been in use, such as Taber test, the LCPC test used in Europe, or AV/AVS used in the SINTEF testing by NTNU in Norway, among others. The test was originally introduced by CERCHARFootnote 1 institute in the 1970s (Cerchar 1973) and the results have been widely used in classification of the rock abrasion, assessment of the wear life of the rock cutting tools, and estimation of the tool consumption, both in mechanical excavation and rock drilling. Many tunneling projects also used this test to describe the rock abrasion for contractual purposes. While the original description of the testing procedure was offered in French Standard NF P 940-430-1 (AFNOR 2000), a standard for CAI testing was offered by the ASTM in 2010 (ASTM D7625-10 2010). Currently a subcommittee of the International Society of Rock Mechanics (ISRM) works on development of a rock abrasion testing method based on the Cerchar test.
There are various configurations for testing machines including three different generations of Cerchar testing devices (Fig. 1). The first-generation testing device was designed and manufactured by Cerchar institute in France. The second-generation device was manufactured at the Colorado School of Mines (CSM) in the mid 80s, and the third one in the UK by West in 1989 (Rostami et al. 2005). The test involves use of a steel stylus having a 90° conical tip (Fig. 2), which is placed on the rock surface, perpendicular to the surface of the specimen under a total constant force of 70 N. The stylus is scratched in a direction parallel to the rock surface over a distance of 10 mm. After the test, the width of the wear flat (Fig. 2) is measured on the stylus tip surface in units of 0.1 mm. The number of units is reported as the CAI. For example, a 0.1-mm wear flat is equal to 1 CAI. Five individual pins are tested for each rock specimen to achieve an average value for the Cerchar index for a rock sample. Fifty-five HRC styluses are advised to be used for testing. A toolmaker’s microscope with a minimum magnification of 30× (ASTM D7625-10 2010) and means of measuring distances are required to read the wear flat.

Schematic drawing of various versions of Cerchar Abrasion testing devices, a the original or first-generation machine by CERCHAR institute in France, b the second-generation device by CSM in the US, c the third-generation device by West in the UK (Rostami et al. 2005)

A pin tip before and after the Cerchar test
Many researchers have investigated the effect of various factors on the Cerchar abrasion test. These factors can be divided into two categories:
-
geological and geotechnical factors related to the rock material;
-
equipment and testing procedures.
Suana and Peters (1982) investigated the relationship between the hardness of rock minerals and CAI. The relationship between Uniaxial Compressive Strength (UCS) and CAI was studied by testing of some synthetic samples (Jager 1988). West (1989) showed an excellent relationship between the Moh’s hardness of minerals and CAI by testing various monomineral specimens. This study revealed that the hardness of the rock-forming minerals is not the only parameter influencing the CAI. Al-Ameen and Waller (1994) concluded that the stylus tip wear is caused by interaction between the stylus body, rock strength, and rock-forming minerals. Plinninger et al. (2003) showed that the hardness of the rock minerals alone is not adequate for interpretation of the testing results and concluded that the obtained abrasivity from Cerchar tests is the result of the rock deformability and its abrasive mineral content. Yarali et al. (2008) performed some tests on sedimentary rocks and showed that measured CAI values increased by increasing the quartz grain size and cementation degree. Alber (2008) placed rock samples in a Hoek cell and carried out the Cerchar test while applying lateral confining stress to the samples. The results demonstrated an increase in measured CAI by increasing the confining stress.
Using of less hardened pins was recommended for testing of softer rocks by Al-Ameen and Waller (1994), whereas Plinninger et al. (2004) recommended using the pins of 54–56 HRC. Cooling of pin tips by some type of fluid is required during re-sharpening process to avoid excessive heating of the pin, which could change the original hardness of the stylus (Büchi et al. 1995). Rostami (2005) showed that the results of 55 HRC pins show less variation than tests performed using 43 HRC pins. Furthermore, he indicated that the results are more sensitive to the testing procedures and operator skills when using softer pins. The following linear equation between the CAI results of 55 HRC and 40 HRC pins was obtained by testing of various rock samples (Michalakopoulos et al. 2006):
Comparing the CAI results obtained on rough and smooth or sawn sample surfaces shows that the CAI has lower values on smooth/sawn surfaces. A linear equation is proposed to determine the relation between the CAI values obtained from various sample surface conditions. For inhomogeneous and anisotropic rock samples that have unsuitable sample surfaces after breaking, Plinninger et al. (2003) recommended carrying out the test on sawn surfaces and correcting the CAI results for rough sample surfaces by the following equation:
where CAI is Cerchar abrasion index on "rough" surfaces and CAIS the Cerchar abrasion index on "Smooth" surfaces, cut with a diamond saw.
According to available standards, the sliding distance on the rock surface is 10 mm (ASTM D7625-10 2010). Various authors showed that about 85 % of the final value of CAI is obtained after the first 2 mm of the scratch length, and 15 % of the change in CAI is obtained in the last 8 mm of the testing length (Al-Ameen and Waller 1994; Plinninger et al. 2003). A positive effect of this observation is that deviations in the CAI coming from the variation of scratch length will not be very significant when the variation in testing length is kept within ±0.5 mm in length (Plinninger et al. 2003).
Despite the popularity of this test, there is a limited understanding of the effect of the different parameters on the results of Cerchar abrasion testing. Testing results (CAI values) are reported based on the measured size of the wear flat at the pin tip and typically, no attention is paid to the interaction between rock and pin tip during the course of test. The CAI values also depend on the experience of the operator, and the test is indeed operator sensitive. This is to say that if identical samples were to be sent to various laboratories, the results will be different and the degree of variation depends on the operators and measurement procedure. The major source of the difference between the operators is in measurement of the wear flat, and previous studies have shown that the measurements using the side view of the pin tip can help in reducing the operator sensitivity of the tests significantly (Ghasemi 2010).
To address the noted deficiencies, this paper presents a new testing approach that allows to monitor the interaction between the pin and rock surface during the Cerchar test. A series of sensors are used to conduct various measurements during CAI testing in addition to record testing parameters such as velocity and distance of sliding, required horizontal force, and vertical displacements of the pin.
Based on the results of the subsequent analysis of the measured parameters, an analytical model was introduced to calculate pin tip wear and its penetration into the rock surface as a function of time and displacement. Results showed that in various samples with different abrasive properties, distribution of pin tip wear and penetration into the surface of the sample are substantially different. These variations are used for better distinction between various rock types and their abrasive behavior.
2 Instrumented Cerchar Testing Device
In order to evaluate the interaction between the pin and rock surface during a Cerchar test, a new Cerchar testing device, capable of measuring frictional forces and pin displacement, was designed and fabricated. Two main objectives were considered in the design of this device:
-
to measure testing parameters including force and displacement of the pin during the test and
-
to allow for better characterization of the interaction between the pin and rock and thus wear phenomenon during the test.
To achieve these objectives, the following issues were considered in the design of the testing device:
-
capability of controlled pin movement on rock surface at a steady predetermined speed;
-
control of the sliding distance;
-
measurement of the horizontal force required to move pin on the sample, and
-
measurement of the vertical displacement of the pin during the test.
To achieve these objectives, the following components were implemented in the design of the new device (Fig. 3):

Schematic view of testing device and its components
-
1.
an electric motor with variable speed, to move the pin with a steady speed with a range of 0–1.7 cm/s;
-
2.
a horizontal displacement sensor for measuring sliding length of the pin on the sample;
-
3.
a vertical displacement sensor for measuring vertical displacement of the pin during the test;
-
4.
a load cell for measuring the required force to move the pin on the sample;
-
5.
data acquisition system to monitor various sensors;
-
6.
a computer program to record and manage the data from various sensors and to send different feedback commands to the device, and
-
7.
a steel frame as a platform for mounting the various components.
Figure 4 is the picture of the device which can be divided into two subsystems: mechanical and electronic. The mechanical subsystem provides a framework for loading and sliding the pin on the rock samples. The electronic part contains electronic circuits to control the motor, to measure the required parameters by various sensors, and to collect and send data to a computer.

Image of testing device
3 Testing Program
A total of 26 specimens that were mainly collected from the Aras hydroelectric power plan (IWPRD 2011) were used in the testing program. This included mainly sedimentary formations. The rock types are identified in Table 1. A few additional rock samples from the petrography laboratory at University of Tehran were used in the testing program as well to provide better distribution of rock abrasivity and strength for subsequent analysis. All tests were carried out according to ASTM and CERCHAR standards on sawn surfaces of rock samples. The CAI values can be corrected to fractured rough surfaces using the Eq. 2. Hardness of the pins was 55 HRC and the tests were conducted with a sliding velocity of 10 mm/s. For each sample, the CAI was determined per standard procedures at the end of the test. In addition, the applied horizontal force on the pin and its vertical displacements during the test were recorded. Figure 5 shows an example of forces and displacement for five separate tests on a limestone sample (shown by 1, 2 … 5 in the graphs in Fig. 5). Sliding displacement of the pins on the rock sample is shown on the x axis. Applied horizontal force to move the pin on the rock surface is shown by T(x) and the vertical displacement by A(x). The vertical displacements of pin have three components:

Graphs of (a) applied horizontal force [T(x)] and (b) pin vertical displacement [A(x)] vs. sliding displacement (x) for 5 separate tests on a limestone sample
-
height reduction due to pin tip wear;
-
height changes due to pin penetration into the rock, and
-
height changes in rock surface.
Tests were carried out on sawn surfaces. In addition, samples were mounted horizontally in the device using a level. Therefore, the slope of sample surface in each test is almost zero. This eliminates the interference of the third component which is the surface undulation of the rock.
To expedite the subsequent analysis, the measured values for each sample were combined in one curve by averaging the values on a point by point basis. The averages of the measured parameters are shown in Fig. 6. As can be seen in this Figure, there is an obvious relationship between T(x) and A(x). The applied shear force on the pin increases proportionally by increasing the depth of pin penetration into the rock surface, as represented by A(x). As the slope of A(x) reduces and the testing values are stabilized, T(x) slowly approaches a constant value. For each sample, the final value of CAI was recorded and plots of T(x) and A(x) were developed according to the described procedure. The related CAI values measured at the end of the scratch are reported in Table 1.

Plot of averaged applied shear force on pin [T(x)] and its vertical displacement [A(x)] versus sliding displacement (x)
4 Analysis of Wear
Using of the new device has allowed us to conduct additional measurements of pin–rock interaction that have never been done to this level of detail. The available measurements, including the horizontal force required for sliding and vertical displacements of the pin have been used to determine the relationship between testing parameters, and to examine the possibility of developing a simple model for pin-rock interaction. Such a model has led to the calculation of instantaneous CAI and pin tip penetration into the rock, as described in the following sections.
4.1 Assumptions
Initial assumptions that are used in the analysis are as follows:
-
pin sliding distance on the rock surface is shown as “x” and for x > 0; the amount of pin tip wear at any point of the sliding path is called CAI(x). Similarly, pin tip penetration into the rock is shown by P(x).
-
T′and N′ are resultant reaction forces that are applied on the pin from the rock. These forces are assumed tangent and perpendicular to the line segment “ab”, respectively, and are applied in the mid-point (Fig. 7).
Fig. 7 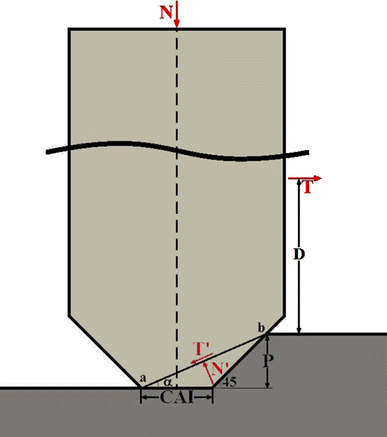
Schematic drawing of the pin tip wear (CAI) and its penetration into the rock (P) and applied forces on the pin from the testing device (T and N) and from the rock (T′ and N′) at any arbitrary point on the sliding path (not to scale)
-
During the test, T(x) and A(x) are measured and recorded by the device. T(x) is the horizontal force needed to move the pin on the rock, and A(x) is the vertical displacement of the pin. Given the geometry of pin tip (Fig. 8), at any point on the sliding path, which has the distance of x from the starting point, the relationship between the pin tip wear CAI(x), its penetration into the rock P(x), and the measured curve of A(x) can be expressed by the following formula:
Fig. 8 
Geometrical relation between pin tip wear [CAI(x)], pin tip penetration into the rock [P(x)], and measured value of vertical displacement sensor [A(x)] (not to scale)


-
All of the samples used in the tests were sawn. Effect of rock surface slope could appear on the right-hand side of Eq. 3, but since the sample surface is leveled for each test, this parameter can be ignored.
-
According to configuration of the testing device, the horizontal force T(x) is applied at a fixed distance D from the rock surface. D depends on the position of the load cell and the system of fixing the sample in the jaw. If the sample is not removed or relocated in the vice jaw during the tests, D is constant in all the tests.
-
The vertical force N is fixed and equal to 70 N, which is the standard dead weight for the Cerchar testing.
4.2 Development of the Analytical Model
The equilibrium of moments at the middle point of the line segment “ab” implies the following:
Given the geometric relations in Fig. 9, the following substitution of parameters can be offered to determine D:

Geometrical relations used to determine moments (not to scale)
In the standard Cerchar test, the CAI value is measured at the end of the test and the result is shown in this study using CAIf = CAI (x = 10 mm). Output of the vertical displacement sensor at the end of the test (A f) can also be used to determine value of penetration at this point “P f” defined as P (x = 10 mm). Given Eq. 3, the value of P f can then be calculated using the final value of pin vertical displacement A f and CAIf. Therefore, the value of D can be calculated from measured values of P f and T f at the end of the test (D f) using the following equation:
T f can be determined on the graph of T(x) as T f = T (x = 10 mm). Knowing that the parameter D is constant for the entire length of the test, it can be used in Eq. 6 and since N is also a constant, this equation can be solved in terms of P to yield P(x) as
The parameter P(x) is determined from Eq. 7 based on the measured horizontal force, T(x). It can be placed back in Eq. 3 along with measured vertical displacement of the pin A(x) to determine CAI(x) as follows:
4.3 Review of the Test Results and Related Analysis
Using the geometry of the contact between the pin and rock surface and available measurements of x, T(x), and A(x), an attempt was made to calculate the CAI(x) or progressive amount of wear on pin tip, assuming that the final dimension of the wear flat would be the traditional CAI value, CAIf = CAI (x = 10 mm). Obviously with the given variations in forces and knowing the fact that the measured vertical displacement of the pin is a combination of the wear and pin penetration into the rock, an algorithm had to be used to determine P(x) and CAI(x).
A computer code was, therefore, developed to use CAIf, A(x), T(x), and determine CAI(x) and P(x). Using this program, the results of testing on the samples of Table 1 were analyzed. For this purpose, the first step was to develop CAI(x) plots. Investigations show that the trends of these curves change as the abrasive characteristics of the rock samples change. To avoid excessive complexity of the graphs, curves were categorized into five groups based on their forms. These groups which represent different classes of rock from the abrasion point of view are as follows:
4.3.1 Non-Abrasive Samples (CAIf < 0.25)
Solid lines in Fig. 10 show graphs of CAI(x) for non-abrasive samples (halite and clayey siltstone). CAI(x) reaches rapidly its final value, in the first 0.5 mm of sliding. The pin tip penetrates substantially into the rock surface and the final value of penetration (P f) is greater than 0.4 mm (solid lines in Fig. 11).

Pin tip wear [CAI(x)] versus sliding distance (x) for non-abrasive and slightly abrasive samples

Pin tip penetration into the rock [P(x)] versus sliding distance (x) for non-abrasive and slightly abrasive samples
4.3.2 Slightly Abrasive Samples (0.25 < CAIf < 1.0)
Dashed lines in Fig. 10 show graphs of CAI(x) for slightly abrasive samples (calcareous sandstone, clayey limestone, marl, sandy limestone, tuff, and anhydrites). The results show that all the curves have similar behavior. CAI(x) increases rapidly in the first millimeter of the sliding path and gradually reaches a more or less constant value. According to these plots, the first 1 mm of sliding is sufficient to reach the final value of CAI as has been mentioned by other researchers in similar studies (Al-Ameen and Waller 1994; Plinninger et al. 2003). In these samples the pin seems to penetrate between 0.15 and 0.3 mm into the contact surface but compared with the non-abrasive samples, the slope of P(x) is reduced substantially after about 2 mm of sliding (Fig. 11).
4.3.3 Abrasive Samples (1.0 < CAIf < 2.0)
Figure 12 shows CAI(x) curves for abrasive samples (andesite, syenite, limestone, compacted tuff, and amphibolite). The general behavior of these curves is somewhat similar to the previous set shown in Fig. 10. The main difference is that the CAI(x) curves have greater values and reach the final value at a more or less longer sliding path (1.0–2.0 mm). Pin penetration at the end of the test was recorded at 0.1–0.2 mm in abrasive samples (Fig. 13). The main part of the penetration seems to occur in the first half of the test. Furthermore, increasing P(x) throughout the test has been observed in some samples.

Pin tip wear [CAI(x)] versus sliding distance (x) for abrasive samples

Pin tip penetration into the rock [P(x)] versus sliding distance (x) for abrasive samples
4.3.4 Very Abrasive Samples (2.0 < CAIf < 2.5)
Figure 14 shows CAI(x) curves for very abrasive samples (diorite, quartz latite, and basalt). The value of CAI(x) increases rapidly in the first 2 mm of sliding path and continues slowly to reach its final value between 4 and 8 mm. It seems that obtaining a correct CAI requires a full 10-mm sliding in this category. Maximum P(x) values of 0.02 to 0.1 mm were experienced in these samples (Fig. 15).

Pin tip wear [CAI(x)] versus sliding distance (x) for very abrasive samples

Pin tip penetration into the rock [P(x)] versus sliding distance (x) for very abrasive samples
4.3.5 Extremely Abrasive Samples (CAIf > 2.5)
Figure 16 shows CAI(x) curves in extremely abrasive samples including granites, quartzitic sandstone, quartzite, schist, and anorthosite. As can be observed, CAI(x) increases sharply at the beginning but the slope of CAI(x) curve decreases as the test continues. In this case, CAI(x) does not reach a final value in most of the samples, unlike the samples shown in Figs. 10, 12 and 14. It is expected that with continuation of the scratching, higher CAI values will be reached. These samples are highly resistant against penetration (Fig. 17). In most cases the amount of pin penetration into the sample is less than 0.015 mm. Some abnormal curves were also encountered but the results were dismissed due to the possible errors in sensor measurements due to very low ranges of values.

Pin tip wear [CAI(x)] versus sliding distance (x) for extremely abrasive samples

Pin tip penetration into the rock [P(x)] versus sliding distance (x) for extremely abrasive samples
4.4 Study of P(x)/CAI(x) Ratio
A better understanding of pin–rock interaction can be obtained by observing P(x)/CAI(x) curves. Figure 18 shows variations of P(x)/CAI(x) in non-abrasive samples. The P(x)/CAI(x) ratio gradually increases with x as the pin scratches along the sample. This means that increasing trend of P(x) is dominant and the pin tip essentially penetrates into the rock rather than wearing the pin tip. So, these samples can be called as non-abrasive. The final values of P(x)/CAI(x) for these samples are greater than 20 and are increasing with length of the scratch.

The ratio of pin tip penetration into rock to its wear [P(x)/CAI(x)] as a function of sliding distance (x) for non-abrasive samples
Figure 19 shows variations of P(x)/CAI(x) ratio in slightly abrasive samples. In these curves a major drop is visible in the first 0.5 mm of slip. This is because of rapid increase in CAI(x) (See Fig. 10) while pin has not penetrated into the surface of the specimen in this part. As the values of CAI(x) reache a constant level along the rest of the path and the pin gradually penetrates into the rock surface, the P(x)/CAI(x) ratio follows the P(x) trends as shown in Fig. 11. Final values of the P(x)/CAI(x) ratio for the slightly abrasive samples reach 2–8.

The ratio of pin tip penetration into rock to its wear [P(x)/CAI(x)] as a function of sliding distance (x) for slightly abrasive samples
In the abrasive samples (Fig. 20), the decrease of the P(x)/CAI(x) ratio in the early stages of test is sharp but it gradually increases for the rest of test. These trends, similar to the trends of slightly abrasive samples, can be explained by looking at the trend of CAI(x) curves in Figs. 12 and 13. In these samples the increase of CAI(x) (Fig. 12) is much greater, and the absolute value of P(x) is much less than the slightly abrasive and non-abrasive samples in early stages of testing. In other words, at the beginning of the scratch, pin wear is more considerable than its penetration. The trend is reverse between sliding intervals of 1 to 5 mm, where the P(x)/CAI(x) ratio starts to increase. This means that in this part of the scratch, the pin tends to penetrate rather than wear. Finally, the P(x)/CAI(x) ratio seems to remain constant in the second half of the tests because CAI(x) and P(x) are almost constant. Final values are between 0.5 and 1.5.

The ratio of pin tip penetration into rock to its wear [P(x)/CAI(x)] as a function of sliding distance (x) for abrasive samples
The initial decrease of P(x)/CAI(x) ratio is very rapid in very abrasive samples and the ratio drops to under 0.25 (Fig. 21). When compared with Fig. 19, more wear occurs during this early stage of testing. In addition, the P(x)/CAI(x) ratios drop to 0.1–0.5 during the rest of the test, which represents low overall penetration.

The ratio of pin tip penetration into rock to its wear [P(x)/CAI(x)] as a function of sliding distance (x) for very abrasive samples
In extremely abrasive samples, soon after the initial movement of the pin, the P(x)/CAI(x) ratio drops to a very small value of nearly zero (Fig. 22). This is due to insignificant amount of pin penetration into the rock surface and continued wear of the pin.

The ratio of pin tip penetration into rock to its wear [P(x)/CAI(x)] as a function of sliding distance (x) for extremely abrasive samples
The results show that for a better analysis and understanding of rock abrasive characteristics and its impact on tool wear, additional measurements are very helpful and may prove to be essential. The P(x)/CAI(x) ratio can be a good indicator of anticipated rock behavior in excavation and drilling applications and of the real abrasivity of rock for estimation of bit life. Thus, a new bit life index can be introduced if the results of the modified Cerchar testing are compared with cutter/bit life in the field in a large number of projects to allow one to examine the correlation of the bit wear with this ratio for future classification of rock abrasion.
The same concept has been used for development of Cutter Life Index (CLI) and Bit Wear Index (BWI) in the Norwegian boreability/drillability testing where rock abrasion and its resistance to drilling is combined to determine life and wear of various rock cutting tools working in different rock formations.
Compared with some approaches where the rock abrasion is solely measured based on the mineral content, the main advantage of the CAI measurement is the fact that CAI test combines mineral composition and rock strength. This attribute allows CAI measurements to be a better indicator of bit life compared with tests that use mineral hardness alone. The results of testing confirm the importance of rock strength. P(x) values can be related to the resistance of the rock to penetration. Thus, measurements of pin penetration into the rock surface and incorporation of this component in the final results indicate that the modified tests offer a better distinction between the rock types. The only drawback of the modified approach in this study is that the CAI is also known and widely used for its simplicity, and to make the additional measurements during the test, a special device needs to be fabricated. This will compromise the simplicity of the equipment, test procedure, and subsequent analysis. However, if the end result proves to offer a better distinction between abrasivity of different rock types, the extra efforts may well be worthwhile.
In summary, the measurement of the sliding force and vertical displacement of the pin in the Cerchar test leads to a better understanding of the pin–rock interaction and process of wear in various rock types and offers new approaches to classification of rock types based on their abrasive behavior.
5 Conclusions
In this study, interaction of the pin and rock surface was examined using a new device for the Cerchar abrasion index test. The new apparatus is capable of accurate control of testing parameters, such as length and velocity of sliding on the rock. It also provides continuous measurement and recording of the forces needed for moving of the pin on rock samples as well as normal displacement of the pin due to wear and penetration into the surface of the specimen.
The analysis of the results includes the continuous calculation of the diameter of the wear flat “CAI(x)” and pin penetration into the rock “P(x)”. The results of the analysis can be summarized as follows:
-
1.
Size of the wear flat at the pin tip, or measured value of the CAI in conventional Cerchar test, reaches its final value after a short sliding distance. This value remains constant during the rest of the test for non-abrasive to medium abrasive rocks. The length of this section of the scratch, where the wear flat stops growing, increases with the increase in rock abrasivity. It seems that in extremely abrasive samples additional sliding of the pin results in additional abrasion of the pin tip and thus would increase the CAI if the scratch were to be continued. In other words, the value of CAI continues to increase after 10 mm of scratch in very abrasive and extremely abrasive rocks.
-
2.
Pin penetration into the rock increases with reduced strength and abrasiveness of the rock. Penetration of the pin into the rock surface is minimal in very abrasive rocks and virtually zero in extremely abrasive rocks. It appears that the depth of penetration corresponds to the strength of the rock.
-
3.
Plots of the P(x)/CAI(x) ratio indicate that various rock types show very distinctive behavior. Using this ratio, one can determine where along the scratch, the pin tip tends to penetrate into the rock surface rather than wear. In the softer rocks with lower abrasivity, the ratio keeps growing as the test continues and in extremely abrasive rocks this ratio drops immediately and remains close to zero.
-
4.
The plots of P(x)/CAI(x) ratio show that the rate of pin tip wear is greater than the rate of its penetration in early stages of the test. But, this trend is reversed with further sliding of the pin. The rate of penetration becomes greater than the size of the wear flat in softer, non-abrasive rocks.
-
5.
The P(x)/CAI(x) ratio can offer a very distinctive classification of rock abrasivity since it can combine the effect of mineral composition and rock strength more explicitly than typical CAI testing.
Additional studies are underway to look at the effect of sample water content on the results as well as behavior of single crystal samples in the Cerchar testing, and the results will be reported in upcoming publications.
Notes
Laboratoire du Centre d' Etudes et Recherches des Charbonnages de France.
Abbreviations
- A(x):
-
Vertical displacement of the pin at the sliding distance of x
- A f :
-
Final value of A(x) (after sliding distance of 10 mm)
- CAI:
-
Value of Cerchar abrasion index
- CAI(x):
-
Value of Cerchar abrasion index at the sliding distance of x
- CAI40 :
-
Value of Cerchar abrasion index obtained by pins of 40HRC
- CAI55 :
-
Value of Cerchar abrasion index obtained by pins of 55HRC
- CAIf :
-
Final value of Cerchar abrasion index (after sliding distance of 10 mm)
- CAIS :
-
Value of Cerchar abrasion index on smooth sawn surfaces
- D :
-
Distance of applied horizontal force on pin from rock surface
- D f :
-
Final value of distance of applied horizontal force on pin from rock surface
- N :
-
Applied normal weight on pin
- P(x):
-
Pin tip penetration into the rock at the sliding distance of x
- P f :
-
Final value of pin tip penetration into the rock (after sliding distance of 10 mm)
- T(x):
-
Applied horizontal force on the pin at the sliding distance of x
- T f :
-
Final value of applied horizontal force on the pin (after sliding distance of 10 mm)
- x :
-
Sliding distance of the pin on the rock surface
References
AFNOR (2000) Roches Détermination du pouvoir abrasive d’uneroche Partie 1: Essai de rayure avec une pointe. NF P 94-430-1
Al-Ameen SI, Waller MD (1994) The influence of rock strength and abrasive mineral content on the Cerchar abrasive index. Eng Geol 36:293–301
Alber M (2008) Stress dependency of the Cerchar abrasivity index (CAI) and its effects on wear of selected rock cutting tools. Tunn and Undergr Space Technol 23:351–359
ASTM D7625-10 ASTM (2010) Standard test method for laboratory determination of abrasiveness of rock using the CERCHAR method. ASTM International
Büchi E, Mathier JF, Wyss CH (1995) Rock abrasivity—a significant cost factor for mechanical tunnelling in loose and hard rock. Tunn 95:38–44
Cerchar (1973) Cerchar tests for the measurement of hardness and abrasivity of rocks. Centre Study Research, French Coal Industry, Document 73-59:1–10
Ghasemi A (2010) Study of CERCHAR abrasivity index and potential modifications for more consistent measurement of rock abrasion. Dissertation, Pennsylvania State University
Hood MC, Roxborough FF (1992) Rock breakage: mechanical. In: SME mining engineering handbook. Society for Mining, Metallurgy, and Exploration, Inc., Littleton, pp 680–721
Iran Water & Power Resources Development Co (IWPRD) (2011) Aras hydroelectric power plan. Report of phase 2 site investigation studies
Jager W (1988) An investigation into the abrasive capacity of rocks. Dissertation, Delft University of Technology
Maidl B, Schmid L, Ritz W, Herrenknecht M (2008) Hard rock tunnel boring machines. Ernst & Sohn, Berlin
Michalakopoulos TN, Anagnostou VG, Bassanou ME, Panagiotou GN (2006) The influence of styli hardness on the Cerchar abrasiveness index value. Int J of Rock Mech & Min Sci 43:321–327
Plinninger RJ, Kasling H, Thuro K, Spaun G (2003) Testing conditions and geomechanical properties influencing the cerchar abrasivity index (CAI) value. Int J of Rock Mech & Min Sci 40:259–263
Plinninger RJ, Kasling H, Thuro K (2004) Wear prediction in hard rock excavation using the Cerchar abrasiveness index (CAI). In: Proceedings of the ISRM regional Symposium EUROCK 2004 & 53rd Geomechanics Colloquy, Salzburg, pp 599–604
Rad PF (1975) Bluntness and wear of rolling disc cutters. Int J of Rock Mech & Min Sci 12:93–99
Rostami J (2005) CAI testing and its implications. Tunn &Tunn Int 37:43–45
Rostami J, Ozdemir L, Bruland A, Dahl F (2005) Review of issues related to Cerchar Abrasivity testing and their implications on geotechnical investigations and cutter cost estimates. In: Proceedings of rapid excavation and tunneling conference (RETC). Seattle, pp 738–751
Stolarski TA (2000) Tribology in machine design. Butterworth–Heinemann, Oxford
Suana M, Peters T (1982) The Cerchar abrasivity index and its relation to rock mineralogy and petrography. Rock Mech Rock Eng 15:1–7
Verhoef PNW (1997) Wear of rock cutting tools. Balkema, Rotterdam
West G (1989) Rock abrasiveness testing for tunneling. Int J Rock Mech & Min Sci 26:151–160
Yarali O, Yasar E, Bacak G, Ranjith PG (2008) A study of rock abrasivity and tool wear in coal measures rocks. Int J of Coal Geol 74:53–66
Zum Gahr KH (1987) Microstructure and wear of materials. Elsevier, Amsterdam
Acknowledgments
The authors would like to express their gratitude to Mr. Reza Sanajian and Mrs. Mahdieh Nasiri in Folowrd Industrial Plans Co. for their unsparing technical supports in designing and manufacturing of the testing device. Also, the authors wish to express their appreciation to Iran Water & Power Resources Development Co., Mr. Banihashemi of Mahab Ghods Consultant Engineers Co. and Mr. Mahinraad of Moshanir Consultant Engineers Co. for providing the samples used in testing and additional information necessary to conduct experiments and subsequent analysis.
Author information
Authors and Affiliations
Corresponding author
Rights and permissions
About this article
Cite this article
Hamzaban, MT., Memarian, H. & Rostami, J. Continuous Monitoring of Pin Tip Wear and Penetration into Rock Surface Using a New Cerchar Abrasivity Testing Device. Rock Mech Rock Eng 47, 689–701 (2014). https://doi.org/10.1007/s00603-013-0397-4
Received:
Accepted:
Published:
Issue Date:
DOI: https://doi.org/10.1007/s00603-013-0397-4