
Abstract
The Tso Morari crystalline (TMC) gneiss dome in the Indian Himalaya extruded from a depth of ~120 km through an inclined subduction channel of sub-elliptical cross-section at the leading edge of the Indian plate. The velocity profile of this gneiss dome is derived after (1) presuming its incompressible Newtonian rheology, (2) finding the “best fit” of the outcrop of the gneiss dome to an ellipse, (3) taking into account different lithologies to have existed at the top of the extruding gneiss body, (4) considering the extrusion to have been driven by the buoyant push of the denser mantle beneath the lighter gneiss, and (5) assigning a range of plausible densities for different litho-units. Fitting the known rates of extrusion—from a few centimetres up to about one-hundredth of a millimetre per year—from ~53 Ma onwards of this gneiss dome to its velocity profile constrains its maximum possible viscosity to ~7.5 × 10²² Pa s. This magnitude is 102–104 times higher than previous estimates for gneisses and granites. Alternative explanations of our data are the following: (1) There was a fall in extrusion rates of the TMC gneiss from 53 to <30 Ma because of an increase in the estimated maximum viscosity from 6.2 × 10²⁰ to 7.5 × 10²² Pa s, possibly indicating a fall in temperature and/or compositional change of the TMC gneiss. (2) Lower the extrusion rates, higher are the estimated viscosities. (3) The TMC gneiss was more viscous probably due to its eclogite content. (4) The estimated maximum viscosity is ~102 times higher than that in collision zones and 102–104 times than that in the Tibetan lower crust, but broadly conforms to that for the crustal channel, and average lithospheric and asthenospheric values. The high magnitude of maximum possible Prandtl number of ~1028 of the TMC gneiss might be related to isothermal decompression of the gneiss during its extrusion.
Introduction
“Shouldn’t a good model provide a weighted balance between simplicity and realistic description?” Kurt Stüwe (2007)
One of the fundamental exercises in structural geology and tectonics has been to estimate the rheological parameters and strength of rocks (e.g., Stöckhert and Renner 1998; Tiwari et al. 2008; Brownlee et al. 2011; Yamato et al. 2011; Yang et al. 2011 as a few examples), most notably their dynamic viscosities (henceforth referred as ‘viscosities’; e.g., Talbot 1999; review by Karato 2008; Barnhoorn et al. 2011 as few of the latest examples). Knowing viscosities of rocks is important (1) in dynamic scaling of analogue models to choose the deformation (or ‘model’) materials of appropriate viscosities (Ramberg 1981) and (2) to estimate other thermo-mechanical parameters of the rocks such as the Prandtl number and rheidity, which are dependent on viscosity (e.g., Davies 1980). Deducing mechanical properties of buoyantly extruded ultra-high-pressure rocks is of particular importance in extrusion and subduction processes and genesis of ore bodies (de Meer et al. 2002). On the other hand, advancement of buoyancy-/isostasy-related geoscientific research is crucial in investigating natural ways of waste disposal (e.g., Burchardt et al. 2011).
Since rocks in tectonic scenarios deform extremely slowly, unlike engineering geological parameters (e.g., Zhang et al. 2011), constraining viscosities based on short-term laboratory (see Dingwell et al. 1985) or even long-term analogue studies (Talbot 1999 and references therein) have seldom been possible. Interestingly, fitting velocity profiles on crustal rebound rates (as reviewed by Schubert et al. 2001) or on specific geological bodies (e.g., Mukherjee et al. 2010) has succeeded in constraining viscosities of specific bodies of rocks.
Recently, Beaumont et al. (2009) postulated buoyancy-driven channel flow as the mechanism for the extrusion of the eclogite-bearing Tso Morari crystalline (TMC) gneiss dome through the NE-dipping subduction channel in the Indian western Himalaya, which is one of the well-accepted mechanisms of doming especially when the rocks are partially molten (also see Yin 2004; Whitney et al. 2004; Mukherjee 2010a, b; Mukherjee and Koyi 2010a, b; review by Gerya 2011; Little et al. 2011; Zhao et al. 2011) or is hydrated as is expected in deep subduction zones (Guillot et al. 2000; Dong 2002; Omori and Komabayashi 2007). Extrusion of ultra-high-pressure terrains from a great depth could also be facilitated by large-scale thermal convection in the mantle (Guillot et al. 2009), but no such evidence applies to the TMC. This work aims to constrain the viscosity (and the Prandtl number) of the TMC gneiss by fitting data of known extrusion rates over a specific time span with a channel of known geometry, orientation and extent.
Geology, geophysics and tectonics
The Tso Morari crystallines (TMC) (Figs. 1, 2a, b) in the Indian western Himalaya have been described as a NW-plunging ‘remnant tilted block of the distal Indian continental origin’ (de Sigoyer et al. 2004; review by Guillot et al. 2008) that now occurs as an isolated single dome (Beaumont et al. 2009 and references therein). However, it is also consistently referred as a ‘nappe’ by Schlup et al. 2003; Epard and Steck 2008 and references therein) or as a doubly plunging anticline (Guillot et al. 1997) between the Indus Yarlung Suture Zone to the north and the Tethyan Himalayan Zone at south to the Indian western Himalaya. The TMC gneiss has a sub-elliptical outcrop with the major axis of ~100 km and minor axis of ~50 km, with >3,000 km2 of aerial exposure (de Sigoyer et al. 2004; Clark 2005, also the review by Jain and Singh 2009). The TMC gneiss dome is elongated along the NW–SE Himalayan trend (Murphy 2002). The vertical dimension of the TMC gneiss is conjectured to be ~7 km (de Sigoyer et al. 2004) though the exact amount of buried, extruded and eroded portions of the TMC gneiss have remained unconstrained (Dixon 1987). Notice that the speculated thickness is at least one-fourth than that expected (~30 km or more) from other eclogite-bearing rocks of the world (Coleman and Wang 1995).

Geological map of the Tso Morari Dome and the adjacent areas. TN Tetraogal Nappe, NT Nyimaling thrust, TML Tso Morari lake. The map is a partial reproduction from fig. 1 of Epard and Steck (2008). However, the term ‘Tso Morari Nappe’ of the authors is replaced with ‘Tso Morari Dome’ in the main text

a A simplified NE–SW cross-section of the Himalaya (reproduced from fig. 1 of Leech et al. 2005). IGP Indo-Gangetic plane, MFT Main Frontal Thrust, SHZ sub-Himalayan zone, MBT Main Boundary Thrust, LHZ Lesser Himalayan Zone, MCT Main Central Thrust, GHZ Greater Himalayan Zone, MHT main Himalayan thrust, STDS south Tibetan detachment system, THZ Tethyan Himalayan zone, TMC Tso Morari crystallines, IYSZ Indus Yarlung suture zone, LBC Ladakh Batholith complex, SSZ Shyok suture zone, KBC Karakoram Batholith complex. b A NE–SW cross-section of the Tso Morari crystallines (a partial reproduction from fig. 3 of Epard and Steck 2008). The other two units—Mata Dome and the Karzok Ophiolite Complex—are not shown in this figure by Epard and Steck (2008), but they mentioned their presence in their paper Epard and Steck (2008). TD Tetraogal Dome (note that the suffix ‘Nappe’ of the ‘Tso Morari Nappe’ Epard and Steck 2008 is replaced here with the term ‘crystallines’)
The TMC gneiss consists dominantly of Proterozoic to Palaeozoic quartzofeldspathic orthogneisses, some meta-sediments and Paleozoic intrusive granitoids that contain small volumes of partially retrogressed eclogite bulges. The eclogite pods are 1–13 m long and 0.5–4 m thick and are oriented usually parallel to the foliations (Guillot et al. 1997; Sharma 2008). The boundary of the TMC gneiss is sparsely serpentinized (Guillot et al. 2000). Boudinaged eclogites, confined mainly to the mylonitized Puga gneiss, are metamorphosed to kyanite-sillimanite grade. The relatively undeformed Polokong la and Rupshu Granitoids indicate that the TMC gneiss underwent deformation partitioning (Sachan et al. 2005). The meta-sediments are calcareous, marly and argillaceous and belong to the Tanglang la Formation that also includes layers of meta-basalts. The ultra-high-pressure metamorphism of the TMC gneiss took place when it was at mantle depths of ~120 km (Mukherjee and Sachan 2009 and references therein). The TMC gneiss was metamorphosed at amphibolite to granulite facies while extruding to crustal depths (Liou et al. 2004) along the subduction channel (henceforth simply referred as a ‘channel’). The concept of extrusion along the channel has been encapsulated as ‘two-way street’ (Ernst et al. 1997); ‘yo–yo tectonics’ (Anderson 2007); and ‘ballon ride’ (Teisser 2011). Extrusion of eclogite-bearing rocks from the mantle depth has also been reported from other orogens (e.g., Scambelluri et al. 2008). The simplified model of collisional scenario in the Himalaya is that the channel was dipped inside a mantle layer of higher density (Warren et al. 2008a, b, c; Beaumont et al. 2009), and later the subducted lump of a crust extruded due to buoyant push of the denser mantle.
From bottom to top, the TMC proto-gneiss before its extrusion was capped by (1) the Mata Dome, (2) the Karzok Ophiolite Complex and (3) the Tetraogal Dome. These three tectonic units now surround the TMC gneiss (Epard and Steck 2008) and were eroded after or could have sheared off during the extrusion of the TMC gneiss. In this work, the structural suffix ‘dome’ is used for the Mata and the Tetraogal rocks keeping in mind that they once capped the TMC gneiss and presumably underwent the same doming process as the TMC gneiss itself. The Tetraogal Dome has been considered as a part of the Mata Series (Guillot et al. 2000) and as the ‘Mata-Karzok Unit’ (de Sigoyer et al. 2004; Guillot et al. 2008). The Karzok Ophiolite Complex has been taken simply as the ‘Karzok Complex’ (Ravikant et al. 2004) and the ‘Karzok nappe’ by Epard and Steck (2008). Likewise, the Mata Dome has also been referred as the ‘Mata nappe’ and the ‘Nyimaling-Tsarap nappe’ by Epard and Steck (2008).
From their thermobarometric studies, Mukherjee and Sachan (2004) constrained the geothermal gradient that prevailed during the extrusion of the TMC gneiss through its channel to be only 5–7°C km−1, which they considered as ‘cold’ (also see Sachan et al. 2005 and references therein). Such a geothermal gradient is about one-fourth magnitude than the global average of 30°C km−1. Further, thermobarometry by de Sigoyer et al. (2004) showed that the extrusion of the TMC gneiss was accompanied by isothermal decompression (see also Sachan et al. 2005). Therefore, had its composition remained the same, the viscosity of the TMC gneiss is predicted not to have varied significantly during its extrusion.
A crust of low resistivity of 1–50 Ω-m below the Tso Morari crystallines up to ≥25 km, and beneath the adjoining Indus Tsangpo Suture Zone (Gokarn 2003), possibly indicates that the crust below the TMC is partially molten. This postulation is corroborated by transverse electric and magnetic finding of a low resistive (5–25 Ωm) zone below the TMC by another research group (Harinarayana et al. 2006), especially below the location Puga. Partial molten rocks are considered to be one of the important conditions for channel flow (Beaumont et al. 2001). The source of fluids could be the eclogitization process (Massonne 2008). Extrusion of eclogites can further release waters (Liu et al. 2008) and/or partially melt the rock (Li et al. 2008; Trap et al. 2011).
The TMC gneiss extruded by extensional down-dip ductile normal shearing (the D3 deformation phase of Guillot et al. 2000) along the Karzok Shear Zone (or the ‘Phirse Detachment Fault’ of Guillot et al. 1997) along its SSW margin and the Zildat Shear Zone (or the ‘Ribil-Zildat fault’ of Schlup et al. 2003) along the NNE boundary (fig. 3 of de Sigoyer et al. 2004). The Zildat Shear Zone has been considered to be active from 55 to 47 Ma (Schlup et al. 2003). The timing of the Karzok Shear Zone is not yet known, but should be coeval with the former zone. The presence of discontinuous patches of serpentinites restricted solely to the Zildat Shear Zone (Guillot et al. 2001; de Sigoyer et al. 2004) might have lubricated extrusion of the TMC gneiss non-uniformly (Guillot et al. 2001). The previous two phases of deformation within the TMC, D1 and D2, involved folding, and the genesis of cleavages and lineations (Guillot et al. 1997; de Sigoyer et al. 2004).
Notwithstanding ~10-km erosion of the rocks over the TMC gneiss since 40 Ma (Epard and Steck 2008), Warren et al. (2008a, b, c) and Beaumont et al. (2009) (also fig. 7 in Warren et al. 2008a, b, c) did not consider erosion as the trigger for the extrusion of the TMC gneiss. The reasons for this are as follows: (1) The estimated rate of erosion of the TMC gneiss from 44 to 38 Ma was merely 0.05 ± 0.11 mm year−1 (Yin 2006; van der Beek et al. 2009). However, considering that to expose a ~120-km-deep TMC gneiss, one requires to erode rocks of the same thickness, over 53 Ma of time span, this would mean that the average erosion rate on the channel to be ≥2.3 mm year−1, thus at a still higher rate during the pre-38-Ma period. (2) Even if such a high erosion rate could had happened on the channel, Yin (2006) argued that widespread erosion in the Trans-Himalaya leading to only a localized uplift of the TMC gneiss is implausible. (3) Rocks overlying the Tetraogal Dome, the Karzok Complex and the Mata Dome shielded erosion (and also lateral gravitational spreading) of the TMC gneiss for a considerable geological time span.
The average rate of extrusion of the TMC gneiss throughout its extrusion history was 1 mm year−1 according to Sachan et al. (2005). A high rate of extrusion of any initially subducted material could be governed by extension of the overlying rocks (Frisch and Meschede 2010). de Sigoyer et al. (2000) deciphered a fall in extrusion rates of the TMC gneiss as has also been recognized from other terrains of ultra-high-pressure metamorphism (Warren et al. 2008b; review by Little et al. 2011). Thus, the extrusion rate of the TMC gneiss fell from 3 cm year−1 between 53 and 48 Ma, to 1.2 mm year−1 between 48 and 30 Ma, and finally to 0.5 mm year−1 after 30 Ma (de Sigoyer et al. 2000). de Sigoyer et al. (2004) explained further the fall in extrusion rate to be due to the transitional extrusion from mantle to crustal conditions. Epard and Steck (2008) also constrained the average uplift and erosion of the TMC gneiss since 40 Ma to be a very low rate of 0.25 mm year−1. By contrast, fig. 6 of de Sigoyer et al. (2004) reveals that between about 55 to 47 Ma, the TMC gneiss rose from 90 to 30 km a rate of at least 7 mm year−1, whereas it maintained a rate of 1.2 mm year−1 between around 47 and 30 Ma corresponding to its rising from 30 to 10 km. In any case, like all other ultra-high-pressure terrains in the world, the TMC gneiss extruded very rapidly (Liou et al. 2004).
Considering the extrusion rate of the TMC gneiss as given by the previous authors, Guillot and Allemand (2002) modelled a wide range of possible dips of the channel from between 7° and 62°, which is a range wider than 30°–60° that for channels in average (Frisch and Meschede 2010). Interestingly, the present-day dip of the subducting Indian plate is estimated to have a gentle value of ~10° (Leech et al. 2005). The ‘planar slab model’ predicts that the channel dipped at ~28° around 55 Ma, and the ‘curved slab model’ a still steeper ~41° at the time and spatial position of the UHP metamorphism (Leech et al. 2005). Kaneko et al. (2003) estimated the dip between 14° and 19°. At ~45 Ma, during slab break-off, the channel had a dip of 45° (Kohn and Parkinson 2002). In all these cases, we notice that the estimated dips lie well within Guillot and Allemand (2002) broadest limit of 7°–62°. The channel remained steep until 46 Ma, but attained a gentle dip by 42 Ma (Leech et al. 2005). In reality, the channel could be either curved or angular (e.g., fig. 4B of Leech et al. 2005; fig. 3 of Guillot and Allemand 2002).
At around 40 Ma, the rising TMC gneiss reached a depth of ~15 km (Epard and Steck 2008), that is, the ductile-to-brittle transition zone (Passchier and Trouw 2005). Since the central part of the TMC gneiss first reached the upper crust at 44–38 Ma, while the NW part took at least after 10 Ma (Yin 2006), that is, arriving at between ~28 and 30 Ma, the TMC gneiss cannot be anticipated to have extruded with the plug-like flow profile indicative of a non-Newtonian rheology. Instead, it closely matches with what happens in a Newtonian viscous fluid. In an ideal channel flow of extrusion, the centre of the channel is expected to exhibit minimum shear strain and the boundaries maximum. Electron-backscattered diffraction studies of in-grain misorientation variations of quartz grains of the TMC gneiss collected from the boundaries and around the centre of the dome too reveal a similar spatial distribution of strain, which also indicates a channel flow extrusion of the TMC gneiss (Mukherjee et al. 2011). This work, therefore, considers the TMC gneiss over kilometre scale to be Newtonian.
Unlike a number of mantled gneiss domes in the world (Dixon 1987’s review), no field evidence has so far been presented, which suggests that the elliptical cross-section of the TMC might be due to its constriction of a supposedly initial circular cross-section. Therefore, as considered by Beaumont et al. (2009), the boundaries of the channel through which this extrusion occurred can reasonably be considered to have remained static throughout the extrusion process. In other words, this work considers the channel to have originally an elliptical cross-section that remained undeformed throughout the extrusion process.
Viscosity estimation
Best-fit ellipse
In order to establish a mathematical model for extrusion, the nearly elliptic outcrop of the TMC gneiss was approximated to a perfect ellipse (Fig. 3). An objective approximation was preferred to a coarse measurement. Reviewing various methods of fitting ‘best/smooth’ ellipses to irregular shapes, Mulchrone and Choudhury (2004) concluded that ‘region-based methods’ are less sensitive to irregularities on the boundary. Wynn and Stewart (2005) compared the performance of numerous boundary-based methods, whereas Ray and Srivastava (2008) developed an approach to boundary-based ellipse fitting using a genetic algorithm. In this work, we follow Fitzgibbon et al.’s (1999) method. This is a direct ellipse-specific fitting technique that minimizes the algebraic distance subject to an ellipse-specific constraint and has the distinct advantage of always producing an ellipse no matter how poor the input data are. The code in Mathematica for implementing the method is presented in section ‘A’ in the Appendix. The input is a set of 66 points sampled from the outcrop of the TMC gneiss (Fig. 3). Applying the algorithm and after finding an appropriate scaling, we found a best-fit ellipse where the semi-major axis ‘a’ is of length 45 km and trends NW–SE, and the semi-minor axis ‘b’ is 16 km long implying a strong ellipticity of a b−1 = 2.81 well within the range of 2–3 for other gneiss domes in the world (Whitney et al. 2004). The intersection between the two axes obviously defines the model centre of the TMC gneiss dome, along which extrusion was fastest.

Stratigraphy of channel before extrusion
-
1.
The channel is schematically presented in Fig. 4a. The ~7-km-thick TMC proto-gneiss (de Sigoyer et al. 2004) is considered to have its top at a depth of 120 km. This means that including the TMC gneiss, the vertical thickness of all the layers at its top we consider is 127 km. Since eclogites and serpentinites occur in widely dispersed bodies with a much smaller volume than their host TMC gneiss, we assign the widest density of gneiss reported from the literature, viz. 2.59–3.12 gm cm−3 (Landholt-Bornstein 1982; Carmichael 1989), to the whole TMC. Assigning the density of solid igneous rocks to their parent melt is reasonable since their magnitudes show only minor variations (as referred in Bose 1997; Philpotts and Ague 2009). Notice that the limit also incorporates the magnitude for that of granites, 2.4–2.65 gm cm−3 (Philpotts and Ague 2009 for the lower limit and Bose 1997 for the higher limit).
Fig. 4 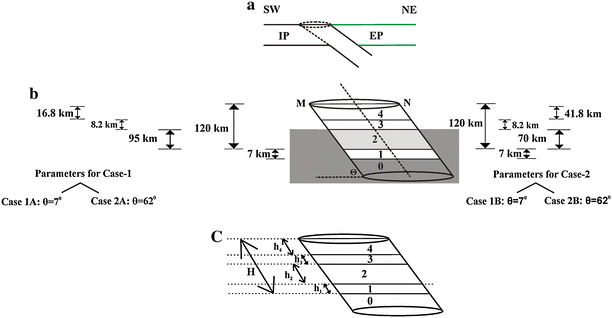
a Schematic diagram (a NE–SW cross-section) showing a subduction channel due to continent–continent collision in the scenario of the Indian plate (IP) and the Eurasian plate (EP). Neither to scale nor angle. b Disposition of the five layers of lithologies in the inclined subduction channel before the extrusion took place (discussed in “Stratigraphy of channel before extrusion” section in the text). The two shaded layers represent mantle that may have different densities. Dip of the channel, ‘θ’, is shown. The line MN is the major axis of the elliptical cross-section, also shown in Fig. 3. c Length (h 1, h 2, h 3, h 4) of layers along the channel. Neither to scale nor angle
-
2.
A mantle layer beneath is considered to have exerted a buoyant push to the proto-TMC gneiss (Fig. 4b). The thickness of this mantle layer is not defined in this work since the buoyant push is independent of its thickness (eqn 18 in the Appendix B). The density of this mantle layer is considered to range within 2.9–3.4 gm cm−3 (data from Turcotte and Schubert 2002). The range incorporates the narrower variation of 3.24–3.27 gm cm−3 used by Warren et al. (2008b) in their tectonic model.
Fig. 5 
Another possibility of rheological stratigraphy that does not fit with the geology (see paragraph VII in “Stratigraphy of channel before extrusion” section). Neither to scale nor angle. a Layer 0 mantle, 1 TMC proto-gneiss, 3 greywackes and carbonates, 4 crust of unknown lithology. b Layer 0 mantle, 1 TMC proto-gneiss, 3 crust of unknown lithology, 4 greywacke and carbonate
-
3.
The once overburden Tetraogal Dome consists of turbidites (Permo-Mesozoic greywackes, slates, quartzites, calc-schists, dolomites and limestones metamorphosed to epidote–amphibolite facies, along with rare basic sills and tuffs; Epard and Steck 2008). Also overlying were the 200- to 300-m-thick (Epard and Steck 2008; Schlup et al. 2003) Karzok Ophiolites (serpentinites, meta-basalts, meta-gabbros and calc-schists and chromatic pods; de Sigoyer et al. 2004; Clark 2005) and at least 7 km of the Mata Dome (dolomites, Late Proterozoic to Cambrian greywackes and Upper Paleozoic to Cretaceous carbonates; Epard and Steck 2008). Thus the Mata Dome, the Karzok Ophiolites and the underlying Tetraogal Dome (henceforth referred as the ‘crust of known lithology’) are cumulatively ~8.2 thick. Assigning specific density values to these three inhomogeneous units was considered impractical. The rocks that mantles gneiss domes usually have densities of 0.1–0.5 gm cm−3 greater than that of the gneiss (Dixon 1987). Therefore, the densities of the Tetraogal Dome, the Karzok Ophiolites and the Mata Dome taken together are expected to lie within a range of 2.62–3.69 gm cm−3. Alternatively, since greywackes were metamorphosed to various extents, we take their densities to be 2.67–2.90 gm cm−3 (Carmichael 1984 for the lower limit and Teyssier and Whitney 2002 as the higher one). We assign densities of 2.2–2.84 gm cm−1 for the carbonates and dolomites that constitute the dominant lithologies in these domes (Farmer 1968 for the lower limit and Carmichael 1989 for the higher one). The densities of these three units can be considered as the extreme limits of the density of the rock assemblage, that is, 2.22–2.90 gm cm−3. Being fully aware that some of the constituents of the Karzok Ophiolites are denser (e.g., chromites: 3.8 gm cm−3, basalts: 2.8–2.9 gm cm−3; gabbro: 3.0–3.1 gm cm−3 etc.—Carmichael 1984; Carmichael 1989), we do not consider them further as the Karzok Complex is 26–40 times thinner than the Mata Dome and the Tetraogal Dome taken together. We consider this layer of known lithology to lie above a mantle layer and below a crustal layer of unknown lithology—as discussed in the subsequent subsection points.
-
4.
What was the exact lithology that took care of 120-km-deep subduction of the TMC gneiss minus ~8.2 km of known lithology is unknown. However, the stratigraphy can still be reasonably be conceptualized. For example, although the crust beneath the TMC gneiss at present is much thicker than the global average (as argued by Rai et al. 2006), this might not have been the case when the channel developed. We consider the thickness of the crust as the uppermost layer in the channel to range widely between 25 and 50 km when the channel formed (USGS, Internet reference for the lower limit; Stüwe 2007 for the upper limit). Thus, the segment of the crust of unknown thickness is 16.8 km (=25–8.2 km) or 41.8 km (=50–8.2 km). The density of this layer is considered to be within the narrower range of 2.7–2.9 gm cm−3 of normal crust (Ernst and Liou 2008 for the lower limit and McCall 2005 for the upper limit).
-
5.
Between the proto-TMC gneiss and the crust of known lithology, we consider that an upper layer of mantle must have been present. Considering the thicknesses of the other layers and the vertical depth of the channel to be 120 km, the vertical thickness of this mantle layer is calculated to be 95 km (=120–25 km) or 70 km (=120–50 km). The density of this layer is considered to have the same range of magnitudes as that of the deepest mantle layer in our model, that is, 2.9–3.4 gm cm−3. Being aware that uncertainties exist in the exact magnitude of the model parameters (Roselle and Engi 2002), we prefer ranges of densities over any specific values reported from the literature (e.g., a mantle density of 3.3 gm cm−3).
-
6.
Thus, altogether five litho-layers are conceptualized inside the channel before the extrusion began where the proto-TMC gneiss was sandwiched within mantle layers (compare Fig. 4b and the first column of Table 1). The vertical thicknesses estimated for each layer were converted into their lengths parallel to the channel under the channel dips to be 7° and 62° (4th to 7th columns in Table 1). Thus, the channel length is ~1,042 km when its dip is considered to be 7° and is ~144 km when it is 62°.
Table 1 Stratigraphy of the Tso Morari area before the gneiss extruded is presented in the first column (see Fig. 4b) -
7.
One may conceptualize different other possibilities of stratigraphy devoid of any mantle layer at the top of the TMC proto-gneiss (Fig. 5a, b). However, those are implausible since greywackes and carbonates at ~120 km would undergo high-grade metamorphism, which is not documented at present at the surface. Secondly, occurrence of greywackes and carbonate layer as the topmost litho-unit would make it unexplained how it outcrops adjacent to the TMC gneiss.


Fluid mechanics
The buoyant pressure exerted by the mantle denser than the TMC gneiss rocks is considered as the extrusion mechanism of the latter. The derivation of the velocity profile of the TMC gneiss (eqn 18 in section ‘B’ in the Appendix) neglects its erosion and gravitational spreading and supposes the presence of an overburden. The extrusion is assumed to have taken place through a static, very long and smooth, cylindrical channel with uniform elliptical cross-section (Fig. 6). We assume that, over the timescale of several million years, the TMC gneiss acted as an incompressible Newtonian viscous fluid. Similar to Gerya et al. (2002) and Stöckhert and Gerya (2005), we start with an implicit consideration that the TMC gneiss had a viscosity that was independent to depth and temperature. Thus, we assume homogeneous lithology of the TMC in each run of our model. We neglect shear heating since it is negligible in extrusion of many (ultra-) high-pressure rocks (Stöckhert 2002).

The model of extrusion of the TMC gneiss (layer 2) that passes through a smooth long cylindrical subduction channel with an elliptical cross-section. All the lithologic layers (‘1’ to ‘5’) demonstrate parabolic velocity profiles with their apices pointing towards the upward flow direction. The two shaded layers represent mantle that may have different densities. Neither to scale nor angle
The velocity profile of extrusion (eqn 18 in section ‘B’ in the Appendix) of the TMC gneiss is deduced starting from the well-known ‘Poisson equation’ (eqn 1 in section ‘A’ in the Appendix). The velocity profile is dependent on the following parameters: (1) acceleration due to gravity, (2) density of the mantle, (3) density and (4) viscosity of the Tso Morari gneiss, (5) dip of the subducting Indian plate at the time of extrusion, (6) time elapsed since extrusion initiated, (7) the lengths of the major and the minor axes and of the inclined channel and (8) the coordinate of points on the cross-section along which the extrusion velocities are considered. When the TMC gneiss is considered to have overburdens, the extrusion profile of the former is additionally dependent on (9) the density and (10) the height of the all the litho-units of the overburden (eqn 18 in section ‘B’ in the Appendix).
The extrusion of the proto-TMC gneiss through the channel is considered to be a Poiseuille flow, which can be looked upon as one of the channel flow mechanisms (Pai 1956). The ‘centre-line’ (Fig. 4b) of the channel is defined as a straight line that passes through the point of intersection between the two axes of the elliptical cross-section of the channel and is parallel to the channel wall. In an ideal Poiseuille flow, the centre-line of the channel experiences the maximum rate of extrusion. Away from the centre-line, the velocity falls systematically and parabolically and attains zero value at the fluid–channel interfaces (Papanastasiou et al. 2000). Considering the extrusion rates as given by the previous authors (e.g., de Sigoyer et al. 2004; Sachan et al. 2005; Epard and Steck 2008) to be at the centre of the dome, we deduce the maximum possible viscosity of the TMC gneiss. Had we chosen the rate of extrusion to be at any other point in the ellipse, the maximum flow rate along the centre-line, and hence the entire flow, would have remained unconstrained, but lower viscosity values would have been obtained. Unlike Mukherjee et al. (2010), we could not specify the lower limit of viscosity values since we dealt with the minimum possible extrusion rates at the centre of the model elliptical cross-section of the TMC gneiss. In the flow equation (eqn 1 in the Appendix B), the centre-line is taken as the Z-coordinate direction. Assigning the available extrusion rates at the centre-line of the channel leads to choice of geographic directions of the two other mutually perpendicular coordinate axes X and Y to be of any orientation.
The interval function of the software Mathematica was used (section ‘C’ in the Appendix) to calculate the viscosity from the velocity profile of extrusion of the TMC gneiss (equation 18 in section ‘B’ of the Appendix) for all possible values of densities lying within respective ranges in all the rheological layers. We used constant extrusion rates (such as 3 cm year−1, 1.2, 0.25 mm year−1, etc.; data of Epard and Steck 2008). We note that the velocity profile of extrusion of the TMC gneiss is independent of the time taken since the flow initiated (eqn 18 in section ‘B’ in the Appendix). Therefore, the time intervals of 5 Ma when the extrusion rate was 3 cm year−1 and the interval of 18 Ma when it was 1.2 mm year−1 found no use in estimating the viscosity. Also used were average extrusion rates of the TMC gneiss for which the time intervals are not specified, such as 7 and 5 mm year−1 (de Sigoyer et al. 2004), 1 mm year−1 (Sachan et al. 2005) and 0.5 mm year−1 (Epard and Steck 2008). Therefore, we did not incorporate in any single trial of deducing the viscosity the slowing of extrusion established by de Sigoyer et al. (2000).
Results and discussions
The maximum possible viscosity calculated for the TMC gneiss is 7.5 × 10²² Pa s (Table 3), which falls within the complete range of 1017–1025 Pa s for all the rock types (Gerya and Meilick 2011). This maximum value results from using the lowest reported extrusion rate, that is, for 0.25 mm year−1 (data of Epard and Steck 2008). This is as expected since, given the fixed shape, size and dip of the channel, and fixed densities of its different layers, the velocity of extrusion at the centre-line is inversely proportional to the viscosity (eqn 19 in section B of the Appendix). The second point to note is that given the fixed shape and size of the channel, the extrusion rate through it, and densities of its different layers, the viscosity of the extruded mass is directly proportional to the dip of the channel (expression 20 in section B of the Appendix). That the maximum viscosity value of 7.5 × 10²² Pa s is obtained for the maximum dip of 62° of the channel also supports this mathematical relation. The parameters and their ranges used in our calculations are presented in Tables 2, 3, 4, 5, 6, 7 and 8. That the TMC gneiss seldom consists of eclogites is utilized in the model by the sole consideration that the crystalline came from ~120 km depth. None of the physical properties of eclogites (nor of serpentinites) were incorporated in the model.
Assuming Newtonian rheology of geological bodies, as adopted in the present study, has been a reasonable approximation in tectonic models (Ramberg 1981; Jackson and Talbot 1986; Talbot and Aftabi 2004; Bruthans et al. 2006; Weinberger et al. 2006; Warren et al. 2008a, b, c; Mukherjee et al. 2010; Mukherjee 2012a, b, c; but also others) even though non-Newtonian behaviour of rocks is also well documented (e.g., Critescu and Hunsche 1998). Although synthetic granitoids of specific compositions have been demonstrated to be usually non-Newtonian at shallow crustal depths (Rutter et al. 2006), natural granitic melt acts as a Newtonian fluid (Shaw 1965). In particular, the ultra-high-pressure rocks that deform by dissolution–precipitation creep and granular flow at low stress levels inside channels have been considered to act as Newtonian fluids (de Meer et al. 2002; Stöckhert 2002; also followed by Cloos and Shreve 1988a, b; Shen 1995 etc.).
The present model is similar to Mukherjee et al. (2010) who estimated the viscosity of natural salts, but differs in that (1) we take into account the overburden that opposed the extrusion of the TMC gneiss, (2) the extrusion of the TMC gneiss took place through an inclined channel unlike the vertical stems of salt diapirs and (3) in contrast to salt diapirs, the mass extruded through the channel is considered not to had modified the pressure gradient of extrusion. The rationale for the last consideration is that unlike relatively a shorter stem of <10 km of the salt diapirs, the channel in the present study was through which extrusion took place was much longer (of at least ~144 km) and therefore was akin to the theoretical consideration of ‘infinitely long channel’ of the ‘Poisson equation’ (eqn 1 in the Appendix B).
The analytical model presented in section ‘B’ in the Appendix follows Papanastasiou et al. (2000) in setting and solving the differential equation of flow. Whereas previous models of doming assume the rheological properties of both the dome and its overburden, and forward model its progressive evolution (see Dixon 1987 and references therein), our model presumes the kinematics (as in eqn 1 in section ‘B’ in the Appendix) and then backcalculates the viscosity of the dome. This work does not evaluate any alternate extrusion mechanisms of the ultra-high-pressure terrain such as those presented by Searle et al. (2001); Christensen (2001); Ernst (2001); King (2001); Lister and Forster (2009), etc.
de Sigoyer et al. (2004) argued that the TMC being a relatively smaller volume of the crust (~35 × 103 km3), buoyancy (=‘hydraulic potential’ of Stüwe 2007) alone could not drive its extrusion. However, the present work negates the conjecture by these authors since the buoyant force depends on the density contrast different layers (eqn 18 in Appendix B), and not on their volumes (Turcotte and Schubert 2002).
The rise of the TMC gneiss was described by the previous workers both as an ‘extrusion’ (e.g., Epard and Steck 2008) and as an ‘exhumation’ process (e.g., Guillot et al. 2008, 2009). Since the present work utilizes the model of buoyancy to explain how the TMC moved up without any role of erosion (eqn 18 in Appendix B), we preferred the word ‘extrusion’. The presented mode, similar to that of Beaumont et al. (2009), does not fall into any of the three extrusion types as compiled by Schulmann et al. (2008), viz. (1) corner flow in accretionary wedge, (2) gravity-driven exhumation guided either by the removal of mountain root or by disparity in potential energy of lithosphere and (3) focused erosion or topographic load-driven flow of partially molten rocks through a sub-horizontal channel.
Several estimates are available, based on the thermobarometric studies, for the pressure on the proto-TMC gneiss before it started to extrude: for example, 1.5–2 GPa corresponding to 55–70 km of subduction. The magnitude was later modified to a maximum of 39 Kbar corresponding to >120 km of subduction (Guillot et al. 1997; Sachan et al. 2005) and 2.7 GPa (Leech et al. 2005). However, none of these values were used directly in our model as we calculated the pressure gradient that led to the extrusion solely by using density contrasts among different layers (eqn 18 in Appendix B).
Ideally, the viscosity of a single rock unit should fall with increasing depth along with the increase in temperature. Nevertheless, for the sake of simplicity, a single representative value of viscosity has often been assigned to particular rock types for a range of temperatures (Talbot et al. 2000; Mukherjee et al. 2010 as a few examples) and has proved fruitful in tectonic modelling (e.g., Schultz-Ela and Walsh 2002; Wagnar and Jackson 2011). The approach could be applicable in particular to extruding melts of granitic composition since their viscosities do not change significantly under a range of pressure and extent of crystallization. For example, nearly the same viscosity is maintained so long (1) the hydrostatic pressure remains ≥7 kbar and (2) until 50% crystallization, the viscosity of the melt vary a little (Shaw 1965). Similarly, taking rocks as solid bodies, deduction of single representative values of other mechanical parameters such as the Poisson’s ratio is a customary exercise in geophysics (Yang et al. 2011 as the latest example).
Unlike Cloos and Shreve (1988a, b), we did not consider any tapering of the channel at depth. As in any mechanical models, we did not consider any intra- and inter-layer chemical reaction nor do we address the (1) genesis, (2) composition, (3) cause and mechanism of subduction and (4) whether eclogitization was due to deformation (cf. Veniamin and Natalia 2008) of the TMC gneiss. We considered the channel to maintain the same dip (7° and 62° in two set of trials) throughout the process of extrusion, that is, it did not change from a steep value in the past into a very gentle value at the present. The mantle layer ‘2’ might accumulate inside the TMC gneiss to form eclogite bodies. However, whether a little volume of eclogites can take care of the voluminous mantle in layer ‘2’ remains a topic of future research (vide Doherty 2011 on modelling uncertainties). These assumptions and simplifications have been customary in most analytical and analogue tectonic models practised to date, viz. Ramberg (1981), Talbot and Aftabi (2004), Weinberger et al. (2006), Warren et al. (2008a, b, c), Mukherjee (2011a, b, 2012a, b, c) and Mukherjee et al. (2010). One more assumption we make is that the thickness of the overburdens—the Tetraogal Dome, the Karzok Ophiolite Complex plus the Mata Dome—as extrapolated from the present structural cross-section by Epard and Steck (2008)—was the same before the TMC gneiss began extruding. This is in accordance with one of the principles of balancing cross-sections (see Fossen 2010 for review), which is logical in a channel flow where no material goes out from the channel nor comes in. Doming of the TMC also domed its overburdens though this study does not deduce the velocity profiles of the latter domes.
Unlike the density, the viscosities of the rocks that capped the TMC proto-gneiss were not controlling parameters of its extrusion rate. In their advanced coupled thermal mechanical model, the Dalhousie school (Warren et al. 2008a, b, c; Beaumont et al. 2009) considered the following additional parameters affecting the domal extrusion of ultra-high-pressure terrains: geothermal gradient, radioactive heat production at depth, thermal expansion coefficients of the rocks, power law flow behaviour of the rocks and change in density due to phase transition of metamorphic rocks. However, since these parameters do not govern the first-order extrusion process (Grasemann et al. 2006), we neglect them for simplicity, even though some anatexis could be expected (Coleman and Wang 1995).
While gneiss remains the dominant rock type in the TMC that could have been molten to a maximum of 20–30% by volume (Zheng et al. 2011), it is characterized by rheological heterogeneities and uncertainties at different scales. For example, (1) even inside eclogites whose rheology as a whole is poorly understood till date (de Meer et al. 2002), garnet grains could be much more rigid than pyroxene grains (Zhang and Green 2007a, b), (2) coesite controls more fundamentally the mechanical property of continental crust (Stöckhert and Renner 1998) and (3) serpentinite in the Karzok Ophiolites and also within the Zildat Shear Zone has a viscosity of 1019 to 4 × 10¹⁹ Pa s (at 550°C). At a shallow crustal depth of <40–50 km, serpentinite is expected to have a lower viscosity of <1017 Pa s (Schwartz et al. 2001), a rheidity of 104 years, a high Poisson ratio of 0.29, a low shear modulus, a high ductility and a density of 2.5–2.6 gm cm−3 (Guillot et al. 2000; de Sigoyer et al. 2004; Guillot et al. 2009 and references therein). Bodies of eclogites inside the TMC gneiss as observed in metre scales have densities of 3.06–3.6 gm cm−3 (Austrheim 1991; Guillot et al. 2000), which span the density (~3.3 gm cm−3) usually taken a typical for the mantle. While the viscosity estimates for the upper mantle range from 1020 to 1022 Pa s (Turcotte and Schubert 2002), those for the eclogites are not known till date. Several qualitative statements on the strength of eclogites and debates are available in the literature (e.g., Jin et al. 2001, 2002; Ji 2002). Dislocation creep, a power law flow, a stress exponent of 3.5 ± 0.4 at a specific temperature and pressure for eclogites (Zhang and Green 2007a, b), and a Poisson’s ratio of 0.24–0.25 (±0.01) for unaltered quartz-bearing eclogites at H2O+ < 10% were reported by Gao et al. (2001). A similar Poisson’s ratio of 0.25–0.265 has been recently deduced by Ábalos et al. (2011). However, a higher range of magnitudes (0.29–0.31) at elevated pressure (750 MPa) was also reported by Babuška et al. (1978). On the other hand, the Poisson’s ratio of the gneiss (of the TMC) could vary from a low-to-medium range of 0.1–0.3 (Gercek 2007). The present work does not address these heterogeneities and uncertainties of the constituents of the TMC.
The maximum possible viscosity of the TMC gneiss (~1022 Pa s) is 102 to 104 times higher than those referred to the literature for (granite) gneiss bodies, for example 2.8 × 10²⁰ Pa s by Fletcher (1972), 1019 Pa s by Ramberg (1972), 8 × 10¹⁸ to <1.66 × 10²¹ Pa s by Beaumont et al. (2009). However, the estimated maximum value is about an order of magnitude less than that referred by Dong (2002) as ~0.3 × 10²³ Pa s and is significantly higher than that of 104 to 107 Pa s of granitic melts at temperatures ≥ the liquidus (Shaw 1965), 109 Pa s for dry granitic melt and ~104 Pa s for a melt with 3 wt% of water (Kushiro 1984). The deduced maximum viscosity of the TMC gneiss is also ~103 times higher than that of the low-grade high-pressure schists (~1019 Pa s: Stöckhert 2002) and 102 times higher than the upper bound value at the plate boundaries (1017–1020 Pa s: Grigull et al. 2011), but could be comparable with dry peridotites that may occur at the serpentinized parts of channels (μ ≥ 1021 Pa s: Gerya et al. 2002). Such a high-viscosity material during extrusion must have given rise to intense shear stress on the boundaries of the channel (Cloos and Shreve 1988a, b). The estimated maximum magnitude is ~103 times larger than crustal viscosity of 1019 Pa s required for efficient channel flow (Beaumont et al. 2004).
A high possible viscosity of the proto-TMC gneiss indicates that it acted as a sluggish fluid during its extrusion. Serpentinites present at the Zildat shear zone had a viscosity (<1017 Pa s at <40–50 km depth—Schwartz et al. 2001 or 1018–1020 Pa s—Gerya et al. 2002) of ≥~102 times smaller than a gneiss with such a high viscosity and therefore might have augmented the extrusion of the TMC gneiss (Guillot et al. 2000, 2001). A wide range of viscosity values are available from laboratory for a variety of temperatures, compositions and water content of granitoid melts (e.g., Rutter et al. 2006 and references therein). In our case, these three fundamental parameters of the proto-TMC gneiss and their progressive evolution also are poorly understood. The proto-TMC could be a mixture of continental and oceanic crust (Stöckhert and Renner 1998) that could have been rheologically weakened by mantle dehydration (Gerya et al. 2008) and therefore chemically inhomogeneous as well. Mixing of two different crusts is expected to be more vigorous as extrusion proceeds (Gerya et al. 2008). The advantage of the present exercise is that it estimates the viscosity of the TMC gneiss in an alternate way in the context of tectonics and avoids these complicacies.
Trials in Mathematica reveal that for a particular combination of density values (in gm cm−3: d 0 = 3.09; d 1 = 2.86; d 2 = 3.15; d 3 = 3.16; d 4 = 2.8) for the five layers lying within their possible limits, viscosity of the TMC gneiss becomes zero for any combination of the other flow parameters. Similarly, negative viscosity values appear for a certain combination of density values (d 0 = 3.4; d 1 = 2.59; d 2 = 2.9; d 3 = 2.62; d 4 = 2.7). Obviously, these are merely mathematical solutions and are not the real cases. Likewise, negative extrusion rates, which are the hypothetical case of sinking proto-TMC gneiss could be obtained when a part of eqn 18 in Appendix ‘B’: (d 0 − d 1 h 1 H −1 − d 2 h 2 H −1 − d 3 h 3 H −1 − d 4 h 4 H −1) is < 0. Since no geoscientific data to date can support this, it means that these are not the natural cases.
The maximum viscosity values deduced in Tables 2, 3, 4, 5, 6, 7 and 8 can be viewed in the following different ways:
-
1.
Fitting the flow eqn 18 (in Appendix B) into the three distinct stages of falling extrusion rates of the TMC gneiss of Epard and Steck (2008), the calculated maximum viscosities (μmax) at those stages are as follows: between 53 and 48 Ma and for a U z = 3 cm year−1, μmax = 6.2 × 10²⁰ Pa s (Table 7); between 48 and 30 Ma and for a U z = 1.2 mm year−1, μmax = 1.6 × 10²² Pa s (Table 6); and 30 Ma onwards and for a U z = 0.25 mm year−1, μmax = 7.5 × 10²² Pa s (Table 3). Thus, a hundred-fold fall in extrusion rate in three steps yields viscosity magnitudes in ascending order. Fall in viscosity of such an order of magnitude is expected when a magmatic material crystallizes up to 90% (Scaillet et al. 1997). However, had the viscosity of the extruding TMC reflected its falling temperatures, it is expected to have increased smoothly rather than in distinct time steps. This may be possible even with the very low geothermal gradient of 5–7°C km−1 (which leads to a maximum variation of 840°C for a 120 km depth). We cannot deduce any progressive variation of viscosity with time since there are so few extrusion rates constrained between known depths and times. As for the extrusion of any terrain, different mineral phases in the TMC gneiss must have appeared and disappeared as it rose through different physical conditions. The bulk composition of the proto-TMC gneiss might have varied as well as the viscosity.
-
2.
This μmax calculated by considering the extrusion rates between 53 and 48 Ma given by Epard and Steck (2008) is 6.2 × 10²⁰ Pa s (Table 7), and that by de Sigoyer et al. (2004) is 2.7 × 10²¹ Pa s (Table 2). The former viscosity value is around one-twentieth than the latter since the 3-cm year−1 rate of extrusion given by Epard and Steck (2008), and is 120 times faster than the rate 0.25 mm year−1 as given by de Sigoyer et al. (2004).
-
3.
The viscosities closest to those of gneisses are likely to be those of granites. The viscosity of granites at 700°C is 105–1012 Pa s (Druguet and Carreras 2006), most viscous granitic melts that on cooling gives obsidian have a value of 4.4 × 10⁶ Pa s, and that at 1,400°C is 2 × 10⁵ Pa s (Ramberg 1981) or the granitic melts have their viscosities within the common range of 106–107 Pa s (Scaillet et al. 1997). The latter value is ~ 1015 times lesser than the μmax = 6.2 × 10²⁰ Pa s (Table 7) of the proto-TMC gneiss at ≥840°C at a 120 km depth. Similarly, the μmax = 7.5 × 10²² Pa s (Table 3) of the extruding TMC gneiss for the last 30 Ma is also 102 times higher than the viscosity of ~1020 Pa s of a granite at a near-surface condition (Stüwe 2007). The reason could be any major compositional difference between a proto-gneiss and a granite, which could most plausibly be due to the presence of elcogites (and other rocks) in the TMC gneiss.
-
4.
Various literatures (Tarling 1978; Meyers 1992; Middleton and Wilcock 1994; Ranalli 1995 to name a few) give the maximum range of the viscosity of the asthenosphere to be between 1019 and 1021 Pa s. Takada and Matsu’ura (2007) provided a lower value of 5 × 10¹⁸ Pa s as the viscosity for the asthenosphere in the India–Eurasia collision zone. During its presence in the asthenospheric depth of ~120 km, the proto-TMC gneiss had its μmax = 6.2 × 10²⁰ Pa s (Table 7), which is ~102 times higher than that estimated specifically for the asthenosphere in the India–Asia collision zone, but lies well within the asthenospheric global average range.
-
5.
Likewise, the range of viscosities of the lithosphere is 1021–1023 Pa s (Tolkunova 1977; Tarling 1978; Watts 2001; Fowler 2005—to name a few). More specifically, the viscosity of rocks in the low-viscosity channel within 0–75 km is 0.04 × 10²¹ Pa s (Teisseyre 1984 and references therein; Guillot et al. 2000). The viscosity of the lower crust below the Tibet is 6 × 10¹⁸ Pa s (Harris 2007 and references therein). In tectonic models, a strong mantle lithosphere (the superstructure) is considered to have a viscosity of 1022–1024 Pa s and a weak mantle lithosphere (the infrastructure) of 1019–1020 Pa s (Harris 2007 and references therein). Thus, μmax = 1.6 × 10²² Pa s (Table 6) calculated for the TMC gneiss from 48 Ma onwards falls within the range for the lithosphere, and the viscosity of the crustal channel falls within the tight range of our estimated μmax of the TMC gneiss from 1020 to 1022 Pa s (Tables 2, 3, 4, 5, 6, 7, 8).
The viscosity of the channel material is expected not to exceed that of the mantle (Shen 1995), which is also validated by the viscosity value of the TMC gneiss. Our calculated μmax lies in between the values for the ‘strong’ and the ‘weak’ mantle lithospheres and is 102–104 times higher than that of the Tibetan lower crust. Copley et al. (2011) speculated, based on numerical experiments, that the Indian lower crust is ‘strong’ with a viscosity >5 × 10²³ Pa s, which is ≥102 times than the upper limit of viscosity of southern Tibet as predicted in a prior modelling by Clark and Royden (2000). However, more recently, based on experimental rock mechanical data, Rutter et al. (2011) estimated the viscosity of the Tibetan mid-crust to range between 1015 and 1021 Pa s. The estimated maximum limit of viscosity in this work also is closer to the lower limit of magnitude speculated by Copley et al.’s (2011) range and exceeds by about an order of magnitude from Rutter et al.’s (2011) range.
The present exercise of estimating viscosity of the TMC gneiss can be used to constrain other important physical parameters. For example, taking its μmax = 7.5 × 10²² Pa s deduced in this work, a minimum density of 2.59 gm cm−3, and a thermal diffusivity of 1.2 × 10⁻⁶ m2 s−1 (Davies 1980), the maximum magnitude of Prandtl number (kinematic viscosity divided by thermal diffusivity) of the TMC gneiss turns out to be 5.6 × 1028. This simplistic calculation neglects a possible minor fall in thermal diffusivity with depth (Nabelek et al. 2010). Even if a mid-crustal value of the parameter, that is, 0.5 × 10⁻⁶ m2 s−1 (cf. Whittington et al. 2009), is considered, the Prandtl number maintains its order of ~1028. The estimated magnitude is ~ 104 times greater than that of the mantle (~1024: Jarvis and Peltier 1989) and is ~106 times greater than the average magnitude of 1022–1023 of the Earth (Davies 1980). A significantly higher maximum plausible Prandtl number of the TMC gneiss indicates that its heat might have diffused more slowly than its extrusion, as is expected in its extrusion by isothermal decompression postulated by the previous workers (e.g., Roselle and Engi 2002; de Sigoyer et al. 2004; Sachan et al. 2005).
The present approach of estimating the viscosity of a rock body could be applied in other terrains of the Himalaya or in other orogens where a rock unit of a particular shape extrudes from a known depth at a known rate due to a buoyant push of a denser material at bottom. While the Ama Drime Dome in Tibet (see the inset map in fig. 2 of Corrie et al. 2010) is a potential terrain, the UHP terrains at Kaghan valley in Pakistan (fig. 1 of O’Brien et al. 2001) and the Arun valley in Nepal (fig. 2 of Corrie et al. 2010) are unsuitable to test the present method of estimating viscosity since occurrences of eclogites in those areas are not inside any particular rock types nor bound any close areas.
Conclusions
The Tso Morari crystalline (TMC) gneiss with a sub-elliptical outcrop extruded at the leading edge of the Indian plate from ~53 Ma. We estimated the maximum possible viscosity of the TMC gneiss to be ~7.5 × 10²² Pa s. The following considerations were incorporated in this estimation: (1) Extrusion took place from a depth of 120 km through a long channel that dipped either 7° or 62° and possessed a uniform perfectly elliptical cross-section. (2) The incompressible Newtonian viscous TMC gneiss extruded with a Poiseuille flow. (3) The extrusion was driven solely by buoyant push of the denser mantle underneath the lighter gneiss. (4) A cover of three rheological layers tried to hinder the extrusion but could not. (5) Extrusion rates remained constant during specific time intervals. And finally, (6) geothermal gradient, gravitational spreading and erosion; (7) any possible brittle deformation during eclogitization (Jolivet et al. 1999) at ~120 km depth; (8) fluid–rock interaction (van der Straaten et al. 2008) within the proto-TMC gneiss; and (9) radiogenic heat production (Roselle and Engi 2002) were neglected. Unlike Roselle and Engi (2002), we did not address specifically the extrusion process of the UHP fragments. Instead of having a range of possible values, our estimation gives only the upper bound of the viscosity magnitudes. For certain combination of parameters, the viscosity values come out to be negative and zero, and extrusion rates to be negative, which imply that those combinations are implausible in nature. The present indirect approach of estimating viscosity can also be applied after suitable modifications on other geological objects of known shapes, sizes and extrusion rates.
Alternative interpretations of our data set are as follows. (1) From 53 to <30 Ma, the maximum viscosity of the TMC gneiss increased in three decipherable steps—from 6.2 × 10²⁰ to 7.5 × 10²² Pa s—possibly indicating a fall in temperature and/or compositional change in the TMC gneiss. (2) Lower the input extrusion rates from 0.25 mm year−1 to 3 cm year−1, higher are the estimated maximum viscosities—from 6.2 × 10²⁰ to 7.5 × 10²² Pa s. (3) The maximum viscosity of the TMC gneiss is ~ 1015 times higher than other gneisses possibly due to more sluggish components in the former such as eclogites. (4) The estimated maximum viscosity lies within the global average range for the asthenosphere, but is ~ 102 times greater than that estimated from collision zones. (5) The calculated maximum viscosity falls within the possible range of lithospheric values. Although the viscosity of the crustal channel falls within our calculated viscosities, our values are 102–104 times more than the lower crust beneath Tibet and are in between the magnitudes for the superstructure and the infrastructure. A high magnitude of maximum possible Prandtl number of 5.6 × 1028 of the TMC gneiss estimated is possibly a manifestation of its isothermal decompression during its extrusion.
The present work is a way of estimating rheology of subduction zone rocks, other than by laboratory methods such as Weidner et al. (2001). This work cannot fully answer King’s (2001) question on the strength of the subduction zones/channels since, based on a single estimate, it is improper to comment on the rheology of the channel over a protracted geological time period (von Huene et al. 2009). Also notice that this work does not utilize the two other possible mechanisms of extrusion of the UHP rocks, viz. the plunger mechanism and the driven cavity flow of Warren et al. (2008b).
References
Ábalos B, Fountain DM, Ibarguchi JIG et al (2011) Eclogite as a seismic marker in subduction channels: seismic velocities, anisotropy, and petrofabric of Cabo Ortegal eclogite tectonites (Spain). GSA Bull 123:439–456
Anderson DL (2007) The eclogite engine: chemical geodynamics as a Galileo thermometer. In: Foulger GR, Jurdy DM (eds) Plates, plumes and planetary processes. Geol Soc Am Sp Pap, pp 47–64
Austrheim H (1991) Eclogite formation and dynamics of crustal roots under continental collision zones. Terra Nova 3:492–499
Babuška V, Fiala J, Mayson DJ et al (1978) Elastic properties of eclogite rocks from the Bohemian massif. Stuclia Geoph et Geod 22:348–361
Barnhoorn A, van der Wal W, Drury MR (2011) Upper mantle viscosity and lithospheric thickness under Iceland. J Geodyn Res 52:260–270
Beaumont C, Jamieson RA, Nguyen MH et al (2001) Himalayan tectonics explained by extrusion of a low-viscosity crustal channel coupled to focused surface denudation. Nature 414:738–742
Beaumont C, Jamieson RA, Nguyen et al (2004) Crustal channel flows: 1. Numerical model with applications to the tectonics of the Himalaya-Tibetan Orogen. J Geophys Res 109:B06406. doi:10.1029/2003JB002809
Beaumont C, Jamieson RA, Butler JP et al (2009) Crustal structure: a key constraint on the mechanism of ultra-high-pressure rock exhumation. Earth Planet Sci Lett 287:116–129
Bose MK (1997) Igneous petrology. World Press, Cleveland, p 227
Brownlee SJ, Hacker BR, Salisbury M et al (2011) Predicted velocity and density structure of the exhuming Papua New Guinea ultrahigh pressure terrane. J Geophys Res 116:B08206
Bruthans J, Filippi M, Geršl M et al (2006) Holocene marine terraces on two salt diapirs in the Persian Gulf, Iran: age, depositional history and uplift rates. J Quater Sci 21:843–857
Burchardt S, Koyi H, Schmeling H (2011) Strain pattern within and around denser blocks sinking within Newtonian salt structures. J Struct Geol 33:145–153
Carmichael RS (1984) Handbook of physical properties of rocks, vol III. CRC Press, Florida
Carmichael RS (1989) Practical handbook of physical properties of rocks & minerals. CRC Press, Florida
Christensen U (2001) Geodynamic models of deep subduction. In: Rubie DC, Dan der Hilst RD (eds) Processes and consequences of deep subduction. Physics Earth Planetary Interior 127:25–34
Clark RJ (2005) Structural constraints on the exhumation of the Tso Morari Dome. Massachusetts Institute of Technology. Unpublished B.S. Thesis, pp 1–51
Clark MK, Royden LH (2000) Topographic ooze: building the eastern margin of Tibet by lower crustal flow. Geology 28:703–706
Cloos M, Shreve R (1988a) Subduction-channel model of prism accretion, melange formation, sediment subduction, and subduction erosion at convergent plate margins: 1. Background and description. Pure Appl Geophys 128:455–500
Cloos M, Shreve RL (1988b) Subduction-channel flow mode of prism accretion, mélange formation, sediment subduction, and subduction erosion at convergent plate margins; Part II, implications and discussions. Pure Appl Geophys 128:501–545
Coleman RG, Wang X (1995) Overview of the geology and tectonics of UHPM. In: Coleman RG, Wang X (eds) Ultrahigh pressure metamorphism. Cambridge University Press, Cambridge, pp 1–23
Copley A, Avouac J-P, Wernicke BP (2011) Evidence for mechanical coupling and strong Indian lower crust beneath southern Tibet. Nature 472:79–81. doi:10.1038/nature09926
Corrie SL, Kohn MJ, Vervoort JD (2010) Young eclogite from the Greater Himalayan Sequence, Arun Valley, eastern Nepal: P-T-t path and tectonic implications. Earth Planet Sci Lett 289:406–416
Critescu ND, Hunsche U (1998) Time effects in Rock mechanics. Series: materials, modelling and Computation. Wiley, Chichester
Davies PA (1980) Laboratory modelling of mantle flows. In: Davies PA, Runcorn SK (eds) Mechanisms of continental drift and plate tectonics. Academic Press, London, pp 225–244
De Meer S, Drury MR, de Bresser JHP et al. (2002) Current issues and new developments in deformation mechanisms, rheology and tectonics. In: De Meer S, Drury MR, de Bresser (eds) Deformation mechanisms, rheology and tectonics: current status and future perspectives. Geol Soc, London, Sp Publ 200:1–27
de Sigoyer J, Chavagnac V, Blichert-Toft J et al (2000) Dating Indian continental subduction and collisional thickening in the northwest Himalaya: multichronology of the Tso Morari eclogites. Geology 28:487–490
de Sigoyer J, Guillot G, Dick P (2004) Exhumation of the ultrahigh-pressure Tso Morari unit in eastern Ladakh (NW Himalaya): a case study. Tectonics 23:TC3003
Dingwell DB, Scarfe M, Cronin D (1985) The effect of fluorine on viscosities in the system Na20–AI20 3 –SiO2: implications for phonolites, trachytes and rhyolites. Am Mineral 70:80–87
Dixon JM (1987) Mantled gneiss domes. In: The encyclopedia of structural geology and plate tectonics. In: Suyfert CK (ed) Encyclopedia of earth sciences, vol X. Van Nostrand Reinhold Company, New York, pp 398–411
Doherty J (2011) Modelling: picture perfect or abstract art? Ground Water 49:455
Dong S (2002) On continent-continent point-collision and ultrahigh-pressure metamorphism. Acta Geol Sinica 76:69–80
Druguet E, Carreras J (2006) Analog modeling of syntectonic leucosomes in mylonitic schists. J Struct Geol 28:1734–1747
Epard J-L, Steck A (2008) Structural development of the Tso Morari ultra-high pressure nappe of the Ladakh Himalaya. Tectonophysics 451:242–264
Ernst WG (2001) Subduction, ultrahigh-pressure metamorphism, and regurgitation of buoyant crustal slices-implications for arcs and continental growth. In: Rubie DC, Dan der Hilst RD (eds) Processes and consequences of deep subduction. Physics Earth Planetary Interior 127:253–275
Ernst WG, Liou JG (2008) High- and ultrahigh-pressure metamorphism—past results and future prospects: Am Mineral 93:1771–1786
Ernst WG, Maruyama S, Wallis S (1997) Buoyancy-driven, rapid exhumation of ultrahigh-pressure metamorphosed continental crust. Proc Natl Acad Sci 94:9532–9537
Farmer IW (1968) Engineering properties of rocks. E.&F.N. Spon Ltd, London 15
Fitzgibbon A, Pilu M, Fisher RB (1999) Direct least square fitting of ellipses. IEEE Trans Pattern Anal Mach Intell 21:476–480
Fletcher R (1972) Application of a mathematical model to the emplacement of mantled gneiss domes. Am J Sci 272:197–216
Fossen H (2010) Structural geology. Cambridge University Press, Cambridge
Fowler CMR (2005) The solid earth: an introduction to global geophysics, 2nd edn. Cambridge University Press, Cambridge
Frisch W, Meschede M (2010) Plate tectonics. Springer, Berlin, p 112
Gao S, Kern H, Jin Z-M et al (2001) Poisson’s ratio of eclogite: the role of retrogression. Earth Planet Sci Lett 192:523–531
Gercek H (2007) Poisson’s ratio values for rocks. Int J Rock Mech Min Sci 44:1–13
Gerya T (2011) Future directions in subduction modelling. J Geodyn 52:344–378
Gerya TV, Meilick F (2011) Geodynamic regimes of subduction under an active margin: effects of rheological weakening by fluids and melts. J Meta Geol 29:7–31
Gerya TV, Stöckhert B, Perchuk AL (2002) Exhumation of high-pressure metamorphic rocks in a subduction channel: a numerical simulation. Tectonics 21:1056
Gerya TV, Perchuk LL, Burg J-P (2008) Transient hot channels: perpetrating and regurgitating ultrahigh-pressure, high-temperature crust–mantle associations in collision belts. Lithos 103:236–256
Gokarn SG (2003) Electrical conductivity patterns along transects over the Indian lithospheric domains of differing temporal evolution: a review. In: Mahadevan TM, Arora BR, Gupta KR (eds) Indian continental lithosphere: emerging research trends. Mem Geol Soc India 53:129–147
Grasemann B, Edwards M A, Wiesmayr G (2006) Kinematic dilatancy effects on orogenic extrusion. In: Law RD, Searle MP, Godin L (eds) Channel flow, extrusion and extrusion in continental collision zones, vol 268. Geol Soc, London, Special Publication, pp 183–199
Grigull S, Krohe A, Moos C et al (2011) “Order from chaos”: a field-based estimate on bulk rheology of tectonic melanges formed in subduction zones. Tectonophysics (in press)
Guillot S, Allemand P (2002) Two-dimensional thermal modelling of the early tectonometamorphic evolution in central Himalaya. J Geodyn 34:77–98
Guillot S, de Sigoyer J, Lardeaux JM et al (1997) Eclogitic metasediments from the Tso Morari area (Ladakh Himalaya): evidence for continental subduction during India—Asia convergence. Contrib Mineral Petrol 128:197–212
Guillot S, Hattori K, de Sigoyer D (2000) Mantle wedge serpentinization and exhumation of eclogites: insights from eastern Ladakh, northwest Himalaya. Geology 28:199–202
Guillot S, Hattori K, de Sigoyer J et al (2001) Evidence of hydration of the mantle wedge and its role in the exhumation of eclogites. Earth Planet Sci Lett 193:115–127
Guillot S, Mahéo G, de Sigoyer J et al (2008) Tethyan and Indian subduction viewed from the Himalayan high- to ultrahigh-pressure metamorphic rocks. Tectonophysics 451:225–241
Guillot S, Hattori K, Agard P et al (2009) Exhumation processes in Oceanic and continental subduction contexts: a review. In: Lallemand S, Funiciello F (eds) Subduction zone geodynamics. Springer, Berlin, pp 175–205
Harinarayana T, Azeez KKA, Murthy DN et al (2006) Exploration of geothermal structure in Puga geothermal field, Ladakh Himalayas, India by magnetotelluric studies. J App Geophys 58:280–295
Harris N (2007) Channel flow and the Himalaya-Tibetan orogen: a critical review. J Geol Soc London 164:511–523
Jackson MPA, Talbot CJ (1986) External shapes, strain rates and dynamics of salt structures. Geol Soc Am Bull 97:305–325
Jain AK, Singh S (2009) Geology and tectonics of the Southeastern Ladakh and Karakoram. Geological Society of India, Bangalore, pp 1–181
Jarvis GT, Peltier WR (1989) Convection models and geophysical observations. In: Convection: plate tectonics and global dynamics. In: Peltier WR (ed) The fluid mechanics of astrophysics and geophysics. Gordon and Breach Science Publishers, vol 4, pp 479–593
Ji S (2002) Eclogite rheology: implications for subducted lithosphere: comment. Geology 30:483
Jin Z-M, Zhang J, Green HM II et al (2001) Eclogite rheology: implications for subducted lithosphere. Geology 29:667–670
Jin Z-M, Zhang J, Green HM II et al (2002) Eclogite rheology: implications for subducted lithosphere: reply. Geology 30:484
Jolivet L, Faccenna C, D’Agostino N et al (1999) The kinematics of back-arc basins, examples from the Tyrrhenian, Aegean and Japan Seas. In: Mac Niocaill C, Ryan PD (eds) Continental tectonics. Geol Soc, London, Sp Pub 164:21–53
Kaneko Y, Katayama I, Yamamoto H et al (2003) Timing of Himalayan ultrahigh-pressure metamorphism: sinking rate and subduction angle of the Indian continental crust beneath Asia. J Meta Geol 21:589–599
Karato S-I (2008) Deformation of earth materials. An introduction to the rheology of solid earth. Cambridge University Press, Cambridge, pp 336–337
King SD (2001) Subduction zones: observations and geodynamic models. In: Rubie DC, Dan der Hilst RD (eds) Processes and consequences of deep subduction. Physics Earth Planetary Interior 127:9–24
Kohn MJ, Parkinson CD (2002) Petrologic case for Eocene slab breakoff during the Indo-Asian collision. Geology 30:591–594
Kushiro I (1984) Structures and some physical properties of silicate melts of geological interest. In: Sunagawa I (ed) Material science of the earth’s interior. Terra Scientific Publishing Company, Tokyo, pp 39–60
Landholt-Bornstein N (1982) Numerical data and functional relationships in science and technology. In: Angenheister G (ed) Physical properties of rocks, subvolume A, vol 1. Springer, Berlin, p 103, 116
Leech ML, Singh S, Jain AK et al (2005) The onset of the India–Asia continental collision: early, steep subduction required by the timing of UHP metamorphism in the western Himalaya. Earth Planet Sci Lett 234:83–97
Li H, Liu J, Tian Z (2008) Fluid/melt activities and a partial melting process during exhumation of the subducted continental crust in the Sulu UHP terrane, China. In: Session: UHP-02 Collisional orogeny, ultrahigh-pressure metamorphism and crustal melting. 33rd International Geological Congress, Oslo, Norway
Liou JG, Tsujimori T, Zhang RY et al (2004) Global UHP metamorphism and continental subduction/collision: the Himalayan model. Int Geol Rev 46:1–27
Lister G, Forster M (2009) Tectonic mode switches and the nature of orogenesis. Lithos 113:274–291
Little TA, Hacker BR, Gordon SM et al (2011) Diapiric exhumation of Earth’s youngest (UHP) eclogites in the gneiss domes of the D’Entrecasteaux Islands, Papua New Guinea. Tectonophysics (in press)
Liu J, Liu W, Kai Y (2008) The release of H2O from ultrahigh-pressure (UHP) granitic rocks during the process of exhumation: Implicated by chlorine-zoning of apatite and amphibole. In: Session: UHP-02 Collisional orogeny, ultrahigh-pressure metamorphism and crustal melting. 33rd International Geological Congress, Oslo, Norway
Massonne H-J (2008) Hydration, dehydration, and melting of upper crustal rocks at high pressure and ultrahigh pressure conditions. In: Session: UHP-02 collisional orogeny, ultrahigh-pressure metamorphism and crustal melting. 33rd International Geological Congress, Oslo, Norway
McCall GJM (2005) Crust. In: Shelley RC, LCocks RM, Pimer IR (eds) Encyclopedia of geology. Elsevier, Amsterdam, pp 403–409
Meyers RA (ed) (1992) Encyclopedia of physical science and technology, vol 4. Academic Press, Orlando, pp 496–499
Middleton GV, Wilcock PR (1994) Mechanics in the earth and environmental sciences. Cambridge University Press, Cambridge, pp 416–418
Mukherjee S (2010a) Structures in Meso- and Micro-scales in the Sutlej section of the Higher Himalayan Shear Zone, Indian Himalaya. e-Terra 7:1–27
Mukherjee S (2010b) Microstructures of the Zanskar Shear Zone. Earth Sci India 3:9–27
Mukherjee S (2011a) Channel flow extrusion model to constrain dynamic viscosity and Prandtl number of the Higher Himalayan Shear Zone. Int J Earth Sci (submitted)
Mukherjee S (2011b) Estimating the viscosity of rock bodies—a comparison between the Hormuz and the Namakdan Salt Diapirs in the Persian Gulf, and the Tso Morari Gneiss Dome in the Himalaya. The J Indian Geophys Union 15:161–170
Mukherjee S (2012a) Simple shear is not so simple! Kinematics and shear senses in Newtonian viscous simple shear zones. Geol Mag (in press)
Mukherjee S (2012b) Kinematics of “top-to-down” simple shear model in a Newtonian viscous rheology. J Indian Geophys Union (submitted)
Mukherjee (2012c) Viscous dissipation pattern in incompressible Newtonian simple shear zones- analytical model & application in the Higher Himalaya. Geol Mag (Submitted)
Mukherjee S, Koyi HA (2010a) Higher Himalayan Shear Zone. Sutlej section: structural geology and extrusion mechanism by various combinations of simple shear, pure shear and channel flow in shifting modes. Int J Earth Sci 99:1267–1303
Mukherjee S, Koyi HA (2010b) Higher Himalayan Shear Zone, Zanskar section-microstructural studies & extrusion mechanism by a combination of simple shear & channel flow. Int J Earth Sci 99:1083–1110
Mukherjee S, Mulchrone K (2011) Estimation of viscosity of the Tso Morari Gneiss Dome, western Indian Himalaya. Session: regional studies. Annual meeting of the “Tectonic Studies Group”, Department of Earth Sciences, Durham University, Durham, UK, pp 47, 05–07 January 2011 (Abstract)
Mukherjee BK, Sachan HK (2004) Garnet response diamond pressure metamorphism from Tso-Morari region, Ladakh, India. 19th Himalaya-Karakoram-Tibet Workshop
Mukherjee B, Sachan HK (2009) Fluids in coesite-bearing rocks of the Tso Morari Complex, NW Himalaya: evidence for entrapment during peak metamorphism and subsequent uplift. Geol Mag 146:876–889
Mukherjee S, Talbot CJ, Koyi HA (2010) Estimating the viscosities of two salt diapirs in the Persian Gulf: Hormoz & Namakdan. Geol Mag 147:497–507
Mukherjee S, Jain L, Samajdar I et al (2011) Grain-scale strain variation in quartz in the Tso Morari Gneiss Dome (Indian western Himalaya) supports its channel flow extrusion. ICOTOM Conference. IIT Bombay (Abstract)
Mulchrone KF, Choudhury KR (2004) Fitting an ellipse to an arbitrary shape: implications for strain analysis. J Struct Geol 26:143–153
Murphy MA (2002) Orogen-parallel extension as expressed by the development of gneiss domes: an example from the Himalaya. Denver annual meeting (October 27–30, 2002). Thermal and mechanical significance of gneiss domes in the evolution of Orogens. Colorado Convention Center. URL: http://gsa.confex.com/gsa/2002AM/finalprogram/abstract_42867.htm. Accessed on 24-March-2010
Nabelek PI, Whittington AG, Hofmeister AM (2010) Strain heating as a mechanism for partial melting and ultrahigh temperature metamorphism in convergent orogens: implications of temperature-dependent thermal diffusivity and rheology. J Geophys Res 115:B12417
O’Brien P, Zotov N, Law R et al (2001) Coesite in Himalayan eclogite and implications for models of India-Asia collision. Geology 29:435–438
Omori S, Komabayashi T (2007) Subduction zone: the water channel to the mantle, chap 5. In: Yuen DA, Maruyama S, Karato S-I, Windley BF (eds) Superplumes: beyond plate tectonics. Springer, Berlin, pp 113–138
Pai S-I (1956) Viscous flow theory I-laminar flow. D. Van Nostrand, New Jersey, p 51
Papanastasiou CT, Georgiou GC, Alexandrou AN (2000) Viscous fluid flow. CRC Press, Florida, p 253
Passchier CW, Trouw RAJ (2005) Microtectonics. Springer, Berlin, p 366
Philpotts AR, Ague JJ (2009) Principles of igneous and metamorphic petrology, 2nd edn. Cambridge University Press, Cambridge 22
Rai SS, Pristley K, Gaur VK et al (2006) Configuration of the Indian Moho beneath the NW Himalaya and Ladakh. Geophys Res Lett 33:LI5308
Ramberg H (1972) Theoretical models of density stratification and diapirism in the Earth. J Geophys Res 77:877–889
Ramberg H (1981) Gravity, deformation and the Earth’s crust in theory, experiments and geological applications, 2nd edn. Academic Press, London
Ranalli G (1995) Rheology of the Earth, 2nd edn. Chapman & Hall, London, p 371
Ravikant V, Pal T, Das D (2004) Chromites from the Nidar ophiolite and Karzok complex, Transhimalaya, eastern Ladakh: their magmatic evolution. J Asian Earth Sci 24:77–184
Ray A, Srivastava DC (2008) Non-linear least squares ellipse fitting using the genetic algorithm with applications to strain analysis. J Struct Geol 30:1593–1602
Roselle GT, Engi M (2002) Ultra high pressure (UHP) terrains: lessons from thermal modeling. Am J Sci 302:410–441
Rutter EH, Brodie KH, Irving DH (2006) Flow of synthetic, wet, partially molten ‘‘granite’’ under undrained conditions: An experimental study. J Geophys Res 111:B06407. doi:10.1029/2005JB004257
Rutter EH, Mecklenburgh J, Brodie KH (2011) Rock mechanics constraints on mid-crustal low-viscosity flow beneath Tibet. In: Prior DJ, Rutter EH, Tatham DJ (eds) Deformation mechanisms, rheology and tectonics: microstructures, mechanics and anisotropy. Geol Soc, London, Sp Pub, 360:329–336
Sachan BK, Mukherjee BK, Ahmad T (2005) Cold subduction of the Indian continental crust: evidence from Tso-morari region, Ladakh, India. Himal Geol 26:25–32
Scaillet B, Holtz F, Pichavant M (1997) Rheological properties of granitic magmas in their crystallization range. In: Bouchez JL, Hutton DHW, Stephens WE (eds) Granite: from segregation of melt to emplacement fabrics. Kluwer, Dordrecht, pp 11–29
Scambelluri M, Pettke T, van Roermund HLM (2008) Majoritic garnets monitor deep subduction fluid flow and mantle dynamics. Geology 36:59–62
Schlup M, Carter A, Cosca M et al (2003) Exhumation history of eastern Ladakh revealed by 40Ar/39Ar and fission-track ages: the Indus river-Tso Morari transect, NW Himalaya. J Geol Soc London 160:385–399
Schubert G, Turcotte DL, Olson P (2001) Mantle convection in the earth and planets. Part I. Cambridge University Press, Cambridge
Schulmann K, Lexa O, Štípská P et al (2008) Vertical extrusion and horizontal channel flow of orogenic lower crust: key exhumation mechanisms in large hot orogens? J Meta Geol 26:273–297
Schultz-Ela DD, Walsh P (2002) Modeling of grabens extending above evaporites in Canyonlands National Park, Utah. J Struct Geol 24:247–275
Schwartz S, Allemand P, Guillot S (2001) Numerical model of the effect of serpentinites on the exhumation of eclogitic rocks: insights from the Monviso ophiolitic massif (Western Alps). Tectonophysics 42:193–206
Searle MP, Hacker BR, Bilham R (2001) The Hindu Kush Seismic Zone as a Paradigm for the Creation of Ultrahigh-Pressure Diamondand Coesite-Bearing Continental Rocks. J Geol 109:143–153
Sharma RS (2008) Geohistory of Tso-Morari Crystalline, Eastern Ladakh, India: a plausible model for ultra-high pressure rocks in the Himalaya. Extended Abstracts: 23rd Himalayan-Karakoram-Tibet Workshop. Him J Sci 5:139–140
Shaw HR (1965) Comments on viscosity, crystal settling, and convection in granitic magmas. Am J Sci 263:120–152
Shen Z-K (1995) Oblique subduction of a Newtonian fluid slab. Pure Appl Geophys 145:561–577
Stöckhert B (2002) Stress and deformation in subduction zones: insight from the record of exhumed metamorphic rocks. In: de Meer S, Drury MR, de Bresser JHP, Pennock GM (eds) Deformation mechanisms, rheology and tectonics: current status and future perspectives. Geol Soc London Sp Pub 200:255–274
Stöckhert B, Gerya TV (2005) Pre-collisional high pressure metamorphism and nappe tectonics at active continental margins: a numerical simulation. Terra Nova 17:102–110
Stöckhert B, Renner J (1998) Rheology of crustal rocks at ultrahigh pressure. In: Hacker BR, Liou JG (eds) When continents collide: geodynamics and geochemistry of ultrahigh-pressure rocks. Kluwer, London, pp 57–95
Stüwe K (2007) Geodynamics of the lithosphere. Springer, Berlin, p 39 (231, 325)
Takada U, Matsu’ura M (2007) Geometric evolution of a plate interface-branch fault system: its effect on the tectonic development of the Himalayas. J Asian Earth Sci 29:490–503
Talbot CJ (1999) Can field data constrain rock viscosities? J Struct Geol 21:949–957
Talbot CJ, Aftabi P (2004) Geology and models of salt extrusion at Qum Kuh, central Iran. J Geol Soc London 161:321–334
Talbot CJ, Medvedev S, Alavi M et al (2000) Salt extrusion rates at Kuh-e-Jahani, Iran: June 1994 to November 1997. In: Blundell DJ, Scott, AC (eds) Lyell: the Past is the Key to the Present. Geological Society, London, Special Publication no. 143, pp 93–110
Tarling DH (1978) Plate tectonics: present and past. In: Tarling DH (ed) Evolution of the earth’s crust. Academic Press, London, pp 1–443
Teisser C (2011) Exhumation of deep orogenic crust. Lithosphere 3:439–443
Teisseyre R (1984) Creep processes, viscosity models, and the quality factor q in the earth’s interior, chap 3. In: Kopystyński JL, Teisseyre R (eds) Constitution of the earth’s interior. Elsevier, Amsterdam, pp 1–368
Teyssier C, Whitney DL (2002) Gneiss domes and orogeny. Geology 30:1139–1142
Tiwari VM, Banerjee P, Singh B (2008) Density model and effective strength of lithosphere in the northwest Himalaya. In: Session: EIL-07 the earth’s gravity field—a key to surface tectonics and mantle geodynamics. 33rd International Geological Congress, Oslo, Norway
Tolkunova TL (1977) Lithosphere viscosity from data on recent vertical and isostatic movements of the earth’s crust. In: Mörner N-A (ed) Proceedings of earth rheology and late cenozoic movement. Wiley, Chichester, pp 135–141 (July 31–August 8)
Trap P, Faure M, Lin W et al (2011) Syn-collisional channel flow and exhumation of paleoproterozoic High Pressure rocks in the Trans-North China Orogen: the critical role of partial-melting and orogenic bending. Gond Res 20:498–515
Turcotte DL, Schubert G (2002) Geodynamics, 2nd edn. Cambridge University Press, Cambridge
USGS, internet reference. The earth’s crust, how thick is the earth’s crust? URL: http://earthquake.usgs.gov/research/structure/crust/index.php. Accessed on 29 June 2010
van der Beek P, Van Melle J, Guillot S et al (2009) Eocene Tibetan Plateau preserved in Northwest Himalaya. Nature Geosci 2:364–368
van der Straaten F, Schenk V, John T et al (2008) Blueschist-facies rehydration of eclogites (Tian Shan, NW-China): implications for fluid–rock interaction in the subduction channel. Chem Geol 255:195–219
Veniamin T, Natalia K (2008) Deformation as the cause of UHP-metamorphism of rocks in shear zones. In: Session: UHP-02 collisional orogeny, ultrahigh-pressure metamorphism and crustal melting. 33rd International Geological Congress, Oslo, Norway
von Huene R, Ranero CR, Scholl DW (2009) Convergent margin structure in high-quality geophysical images and current kinematic and dynamic models. In: Lallemand S, Funiciello F (eds) Subduction zone geodynamics. Springer, Berlin, pp 137–157
Wagnar BH III, Jackson MPA (2011) Viscous flow during salt welding. Tectonophysics 510:309–326
Warren CJ, Beaumont C, Jamieson RA (2008a) Deep subduction and rapid exhumation: role of crustal strength and strain weakening in continental subduction and ultrahigh-pressure rock exhumation. Tectonics 27:TC6002
Warren CJ, Beaumont C, Jamieson RA (2008b) Modelling tectonic styles and ultra-high pressure (UHP) rock exhumation during the transition from oceanic subduction to continental collision. Earth Planet Sci Lett 267:129–145
Warren CJ, Beaumont C, Jamieson RA (2008c) Formation and exhumation of ultra-high pressure rocks during continental collision: role of detachment in the subduction channel. Geochem Geophys Geosys 9:Q04019
Watts AB (2001) Isostasy and flexure of the lithosphere. Cambridge University Press, Cambridge
Weidner DJ, Chen J, Xu Y et al (2001) Subduction zone rheology. Phys Earth Planet Interior 127:67–81
Weinberger R, Lyakhovsky V, Baer G et al (2006) Mechanical modeling and InSAR measurements of Mount Sedom uplift, Dead Sea basin: Implications for effective viscosity of rock salt. Geophys Geochem Geosys 7:Q05014
Whitney DL, Teyssier C, Vanderhaeghe O (2004) Gneiss domes and crustal flow. In: Whitney DL, Teyssier C, Siddoway CS (eds) Gneiss domes in Orogeny. Geological Soc Am Special Publication 380:15–33
Whittington AG, Hofmeister AM, Nabelek PI (2009) Temperature-dependent thermal diffusivity of the Earth’s crust and implications for magmatism. Nature 458:319–321
Wynn TJ, Stewart SA (2005) Comparative testing of ellipse-fitting algorithms: implications for analysis of strain and curvature. J Struct Geol 27:1973–1985
Yamato P, Kaus BJP, Mouthereau F et al (2011) Dynamic constraints on the crustal-scale rheology of the Zagros fold belt, Iran. Geology 39:815–818
Yang H, Hu J, Li G et al (2011) Analysis of the crustal thickness and Poisson’s ratio in eastern Tibet from teleseismic receiver functions. Geophys J Int 186:1308–1388
Yin A (2004) Gneiss domes and gneiss dome systems. In: Whitney DL, Teyssier C, Siddoway CS (eds) Gneiss domes in Orogeny. Geol Soc Am Spec Publ 380:15–33
Yin A (2006) Cenozoic tectonic evolution of the Himalayan orogen as constrained by along-strike variation of structural geometry, extrusion history, and foreland sedimentation. Earth-Sci Rev 76:1–131
Zhang J, Green HW (2007a) Experimental investigation of eclogite rheology and its fabrics at high temperature and pressure. J Meta Geol 25:97–115
Zhang J, Green HW II (2007b) On the deformation of UHP eclogite: from laboratory to nature. Int Geol Rev 49:487–503
Zhang X-P, Wong LNY, Wang S-J et al (2011) Engineering Properties of quartz mica schist. Eng Geol 121:135–149
Zhao Z, Niu Y, Christensen NI et al (2011) Delamination and ultra-deep subduction of continental crust: constraints from elastic wave velocity and density measurement in ultrahigh-pressure metamorphic rocks. J Meta Geol 29:781–801
Zheng Y-F, Xia Q-X, Chen R-X et al (2011) Partial melting, fluid supercriticality and element mobility in ultrahigh-pressure metamorphic rocks during continental collision. Earth-Sci Rev 107:342–374
Acknowledgments
SM acknowledges IIT Bombay’s flexible ‘Seed Grant’ (Spons/GS/SM-1/2009) and Department of Science and Technology’s (New Delhi) SERC Fast Track Scheme: SR/FTP/ES-117/2009. IIT Bombay’s travel grant enables SM to make an oral presentation (Mukherjee and Mulchrone 2011) at the Tectonic Studies Group Meeting in Durham in January 2011. S. Guillot made two rounds of thorough constructive review that led us to rearrange and fine tune arguments. The work benefited significantly from C.J. Talbot’s (retired from Uppsala University) mentoring and his meticulous corrections in English and the scientific contents as an informal reviewer. Manendra (IIT Bombay) cross-checked the Appendix B. S Murthy, A. Bandyopadhyay and R. Ghosh (IIT Bombay), R. S. Sharma (Indian National Science Academy Fellow), B. Mukherjee and K. Sen (Wadia Institute of Himalayan Geology), and K.C. Sahu (IIT Hyderabad) are thanked for discussions. S. Bhattacharyya (Alabama University) continues to supply research papers to SM (for more than a decade). Comments by P. Leat (Editor, Geological Magazine) helped to clarify a number of points. W.-C. Dullo’s chief editorial handling is greatly appreciated.
Author information
Authors and Affiliations
Corresponding author
Electronic supplementary material
Below is the link to the electronic supplementary material.
Rights and permissions
About this article
Cite this article
Mukherjee, S., Mulchrone, K.F. Estimating the viscosity and Prandtl number of the Tso Morari crystalline gneiss dome, Indian western Himalaya. Int J Earth Sci (Geol Rundsch) 101, 1929–1947 (2012). https://doi.org/10.1007/s00531-012-0758-3
Received:
Accepted:
Published:
Issue Date:
DOI: https://doi.org/10.1007/s00531-012-0758-3