
Abstract
In the first part of this review, I defined the media filter and how it can operate to frame and blame the forecaster for losses incurred during an environmental disaster. In this second part, I explore the meaning and role of uncertainty when a forecast, and its basis, is communicated through the response and decision-making chain to the newspaper, especially during a rapidly evolving natural disaster which has far-reaching business, political, and societal impacts. Within the media-based communication system, there remains a fundamental disconnect of the definition of uncertainty and the interpretation of the delivered forecast between various stakeholders. The definition and use of uncertainty differs especially between scientific, media, business, and political stakeholders. This is a serious problem for the scientific community when delivering forecasts to the public though the press. As reviewed in Part 1, the media filter can result in a negative frame, which itself is a result of bias, slant, spin, and agenda setting introduced during passage of the forecast and its uncertainty through the media filter. The result is invariably one of anger and fury, which causes loss of credibility and blaming of the forecaster. Generation of a negative frame can be aided by opacity of the decision-making process that the forecast is used to support. The impact of the forecast will be determined during passage through the decision-making chain where the precautionary principle and cost-benefit analysis, for example, will likely be applied. Choice of forecast delivery format, vehicle of communication, syntax of delivery, and lack of follow-up measures can further contribute to causing the forecast and its role to be misrepresented. Follow-up measures to negative frames may include appropriately worded press releases and conferences that target forecast misrepresentation or misinterpretation in an attempt to swing the slant back in favor of the forecaster. Review of meteorological, public health, media studies, social science, and psychology literature opens up a vast and interesting library that is not obvious to the volcanologist at a first glance. It shows that forecasts and their uncertainty can be phrased and delivered, and followed-up upon, in a manner that reduces the chance of message distortion. The mass-media delivery vehicle requires careful tracking because the potential for forecast distortion can result in a frame that the scientific response is “absurd”, “confused”, “shambolic”, or “dysfunctional.” This can help set up a “frightened”, “frustrated”, “angry”, even “furious” reaction to the forecast and forecaster.
Introduction
Uncertainty and error are central to any scientific measurement, model-based projection or forecast (Taylor 1997; Grabe 2005). Because quantification of uncertainty is part of making any measurement, there are accepted standards for error assessment in measurement results (e.g., Taylor and Kuyatt 1994; JCGM 2008; Rougier 2013; Rougier and Beven 2013). Although the forecaster will strive to use the most complete and up-to-date measurements and models available to make the best possible forecast, error is inherent in any measurement or data set, and uncertainty will always be present in the final product. Statement of uncertainty is thus an unavoidable but essential, accepted, and standardized method of communication when passing measurements, model-based simulations, and forecasts between actors in the scientific community (e.g., Hall 1950; Gong and Forrest 2014), as well as upwards through the disaster-response chain to policy and decision-makers. Thus, as Brannigan (2011) states “one of the most important fundamental policy decisions is the treatment of uncertainty.” But, what happens when forecasts and uncertainty are communicated beyond the scientific and policy making community to be filtered by the media? According to Norton et al. (2006),
uncertainties may be framed by the presentation, sources, and social construction of information—this being a social science perspective—as well as the degrees and perceived quality of information available—this being a Bayesian, physical science perspective.
Eldridge and Reilly (2003) argued that the media now pay more attention to uncertainty and can either generate concern about particular threats or offer reassurance. Schwitzer (2011) backed this perspective up, arguing that (health care) news coverage can educate and inform, but also confuse. The ideal scientific treatment of uncertainty will also be balanced by the business perspective. This was stressed by Eoyang and Holladay (2013) who commented that the challenge in the business world is to work ethically and responsibly in circumstances where outcomes are unknowable.
Disconnects in the definition, interpretation, and use of uncertainty between scientific, media, business, political, and public stakeholders are thus bound to occur. These potential disconnects are explored here, mostly from the social science perspective and using four examples of newspaper responses to an environmental disaster. These are:
-
1.
The 2010 eruption of Eyjafjallajökull (Iceland);
-
2.
The passage of the storm “Dirk” though Brittany (France) in December 2013;
-
3.
The “great storm” of 16–17 October 1987 that impacted SE England (UK);
-
4.
The St. Jude’s day storm of 28 October 2013 that, again, impacted SE England.
Recourse to meteorological events, as well as the meteorological and health literature, is essential. This is because the meteorologist and health practitioner have a great deal of experience in, and a long experience of, delivering forecasts—in verbal, written, and graphic format—to the public. As regards the weather forecast, Stewart (1997) pointed out that “studies of the value of forecasts themselves necessarily consider the decisions made by users of the forecast.” Analysis of forecasts are then either descriptive, focusing on how the users actually decide (e.g., Johnson and Holt 1997; Wilks 1997), or prescriptive, focusing on how the users should decide (e.g., Davis and Nnaji 1982; Sonka et al. 1988). This study is prescriptive.
The volcanological perspective
There is a significant literature in volcanology on the importance of probabilistic forecasts and their communication. Indeed, this review compliments that of Doyle et al. (2014) by adding the complications posed by passing uncertainty and forecast through the decision-making and communication chain to the newspaper.
Probabilism is definedFootnote 1 as a theory that certainty is impossible in the sciences and that probability has to suffice when governing belief and action. Thus, probabilism and uncertainty are intimately linked. As Sparks (2003) pointed out,
Due to intrinsic uncertainties and the complexity of non-linear systems, precise prediction is usually not achievable. Forecasts of eruptions and hazards need to be expressed in probabilistic terms that take account of uncertainties.
In volcanology, many systems have been developed to aid in probabilistic risk assessments for volcanic eruption scenarios and for input into eruption forecast models (e.g., Gómez-Fernández 2000; Pareschi et al. 2000; Newhall and Hoblitt 2002; Marzocchi et al. 2004, 2008; Behncke et al. 2005; Felpeto et al. 2007; De la Cruz-Reyna and Tilling 2008; Jenkins et al. 2012a; Marzocchi and Bebbington 2012; Bebbington 2013; Garcia-Aristizabal et al. 2013; Gunn et al. 2014; Sobradelo et al. 2014). Long-term forecasts are mainly used for risk management and planning (Bebbington 2013), and tend to be based on historical and deposit data. Now-casting, however, needs to be applied during an ongoing event, in real-time, and relies heavily on live data feeds from operational geophysical arrays, satellite data, and observers in the field. This allows up-to-the-minute input into forecast models. All steps in this flow through the data-model-forecast system have their uncertainties, which inevitably stack up so that certainty in the final product is utterly impossible.
Hazards tend to scale risk numerically in terms of a percentage and/or by using colors. Words used are typically “high”, “medium”, and “low”, with colors being red, orange, yellow, green and/or white. In this context, lava flow models have been used to produce probabilistic maps for lava flow invasion of the city of Goma on the flanks of Nyiragongo (Chirico et al. 2009), the town of Zafferana on Etna (Bisson et al. 2009), as well as for all sectors of Etna (Forgione et al. 1989; Favalli et al. 2009), Vesuvius (Lirer and Vitelli 1998), Lanzarote (Felpeto et al. 2001), and Mount Cameroon (Bonne et al. 2008). Probabilistic risk mapping and assessments have also been completed for explosive events at Vesuvius (Carta et al. 1981; Cioni et al. 2003; Pesaresi et al. 2008; Sandri et al. 2009; Gurioli et al. 2010), Campi Flegrei (Marzocchi et al. 2010), Teide-Pico Viejo (Sobradelo and Martí 2010), and Cotopaxi (Biass et al. 2012), as well as vent opening in the Auckland volcanic field (Lindsay et al. 2010) and Campi Flegrei (Selva et al. 2012). In addition, probability-based assessments have been made for evacuation vulnerability in Campi Flegrei (Alberico et al. 2012), socio-economic vulnerability for eruptions in Valles Caldera (Alcorn et al. 2013), potential damage caused by a possible future eruption at the proposed radioactive waste repository of Yucca Mountain (Ho et al. 2006), hazard to aviation operations during ash-emitting events at Vesuvius (Folch and Sulpizio 2010; Sulpizio et al. 2012), and ash fall hazard in the Asia-Pacific region (Jenkins et al. 2012b). For the Auckland volcanic field, Sandri et al. (2012) combined probability-based hazard assessments with cost-benefit analysis to produce maps that assessed the probability of base surge impact and evacuation time.
There is also a growing literature on how such volcanic hazard information can be communicated, and trusted, on a local scale (e.g., Haynes et al. 2007, 2008). However, Alemanno (2011a) argued that,
The raison d’être of risk communication within the broader framework of risk regulation lies in the assumption that scientific results as well as risk management options cannot always be easily converted into simple guidelines and advice that non-scientists, like the public or media, can easily understand or follow. This seems especially true at a time when we learn about crises via new media tools such as Twitter, Facebook and YouTube. Moreover, with public opinion having become more skeptical about the neutrality and effectiveness of science, there is a growing call for transparency, especially in times of emergencies.
Pidgeon and Fischhoff (2011) backed this view up arguing, “communication failure makes future success less likely, by eroding both the public’s trust in the experts, who seem not to know their needs, and the experts’ trust in the public, which seems unable to understand the issues.” Pidgeon and Fischhoff (2011) concluded by arguing that a new model of science communication was needed. Also, there may be government-based campaigns to erode trust in science through a process which can be summarized as “abusing” science (Wright and Dunlap 2010), as well as lobbying (Eldridge and Reilly 2003). It is not surprising, then, that surveys by Davis et al. (2005) showed that confidence among the population of government officials’ levels of preparedness and ability to provide accurate information about an impending eruption was not high.
However, the decision as to whether and how to respond to an environmental disaster is not the responsibility of the forecaster. In the decision-making process, the forecaster is at the base of the triangle that tips out with government bodies, these being those agencies responsible for defining, implementing, and enforcing environmental hazard response policy (Fig. 1). For a volcanic disaster, information-flow protocols have been laid out in many documents (e.g., Tilling 1989; Heliker 1992; Bertolaso et al. 2009). Within this scheme, forecasters are charged with providing the best possible information to those bodies higher up in the decision-making chain so that the best-informed decision can be made on the basis of the best scientific information available (Bonfils et al. 2012). Application of this scheme involves not just the media filter (see Part 1 of this review), but also application of cost-benefit analysis and the precautionary principle by policy and decision-makers. Worse, although “we can make a good deal of progress in understanding why, and when, people fail to respond sensibly to worst-case scenarios, when probabilities cannot be assigned to the worst-case scenario, the analysis is harder” (Sunstein 2007). As Sunstein (2007) adds, “suppose that officials or scientists have no idea about a terrible outcome, or that they are able to specify only a wide range.”

Volcanic crisis response and decision-making pyramid as based on the original scheme of Tilling (1989) and adapted to cover the response to a volcanic event that impacts air space. I have divided the main stakeholders into three groups (science, governmental, and others—as divided by the dashed lines). The main role of each group is given in the yellow boxes. Forecasting and government bodies were those active during the 2010 Eyjafjallajökull eruption as taken from Alemanno (2011c) and Macrae (2011). I have added a second pyramid of influence to the original scheme of Tilling (1989) which enters from the right that contains the “other” stakeholder group
Cases and sources
With the exception of the Great Storm of 1987 for which I refer to a 1988 special issue of the journal Weather devoted to the storm, the UK press sources that I use for the Eyjafjallajökull and UK weather events are The Times, The Daily Telegraph, and The Sun, as well as The Daily Mail, The Daily Mirror, and The Independent. I have already reviewed these sources in Part 1 of this review. Thus, following a brief review of each event, I detail the new French press sources used here.
The 2010 eruption of Eyjafjallajökull
Beginning on 14 April 2010, an explosive eruption of Eyjafjallajökull volcano (Iceland) fed an ash cloud that drifted into transatlantic and European air routes prompting closure of the same air space during 15–20 April (Gudmundsson et al. 2010). The impact, especially on airline operations, has been well documented (e.g., Alemanno 2011b), as have methods used to measure, model, and track the ash cloud (e.g., Kristiansen et al. 2012; Newman et al. 2012; Turnbull et al. 2012; Woodhouse et al. 2013). The impact of the event on industries and individuals lead to extensive press coverage in the European and US press (Harris et al. 2012). Reports appeared in The Times on nine consecutive days beginning on 15 April, and on eight consecutive days beginning on 16 April in The Sun. Coverage in these two UK newspapers alone amounted to 6 m2 of paper space or 7500 cm2 of newspaper coverage per day.
Dirk and the flooding of Morlaix
The storm named “Dirk” crossed the French region of Brittany during 23–24 December 2013. Between 60 and 80 mm of rain fell on land already saturated by water, winds reached speeds of 100 km/h and around 18,500 households lost electricity (Ouest France, 26 December 2013, p. 3). Flooding was widespread, especially in western Brittany where the towns of Quimperlé, Quimper, and Châteaulin were flooded (Violette 2014). The town of Morlaix was particularly hard hit, where the “rising water surprised everyone” as the river that flows through the town center rapidly rose and overflowed to flood roads, houses, and shops to a depth of more than 1 m (Ouest France 2014).
The “great storm” of 16–17 October 1987
The “great storm” of 16–17 October 1987 was one of Britain’s most severe windstorm events since 1703 (Lamb 1988); the 1703 storm being argued by Daniel Dafoe to have been “the most violent tempest the world ever saw” (Clow 1988). The 1987 event thus became the “so-called hurricane” or the “great gale” (Stirling 1997), with peak wind-gust speeds of up to 325 km/h (Templeman et al. 1988). As a result, winds blew down around 15 million trees (Quine 1988) and caused extensive property damage (e.g., Lawes 1988), with 18 fatalities being recorded in Britain (Met. Office 2013). Total damage was assessed at 1.4 billion British pounds by RMS (2007).
The St. Jude’s Day storm of 28 October 2013
On 28 October 2013 a storm, named St. Jude, swept across southern England bringing winds of up to 160 km/h. Although details in newspaper reports were contradictory, initial losses were reported as:
-
5 dead, power cuts hit 500,000 (The Sun, 29 October 2014, p. 4);
-
4 dead, “thousands” without power (The Independent, 29 October 2014, p. 2);
-
5 killed, 500,000 “families” left without power (Daily Mail, 29 October 2014, p. 1);
-
5 dead, 600,000 homes without power (The Times, 29 October 2014, p. 1);
-
“100 mph hurricane force winds claim 6 lives” (Daily Express, 29 October 2014, p. 1).
The storm caused five deaths. It also felled thousands of trees, left hundreds of thousands of homes without power, blew down walls, scaffolding and cranes, and disrupted the railway network.
French press sources
For storm Dirk, I use four French newspapers: Ouest France, La Montagne, Le Figaro, and Le Monde. All newspapers published between 23 December 2013 and 9 January 2014 were examined. Ouest France, specifically the Morlaix edition, was selected as the primary target newspaper due to the location of Morlaix in one of the worst hit zones. Based in Rennes (Brittany), Ouest France was founded in 1944 following the collapse of the controlled press of the Second World War (Martin 2002). Ouest France currently has a circulation of 768,226, being the most read regional newspaper in France as of 2009 (Corroy and Roche 2010). La Montagne was selected as a control. Founded in 1919 in Clermont Ferrand (Martin 2002) it is, geographically, the most central newspaper in France and its circulation of 190,268 makes it the eighth most popular regional newspaper in France (Corroy and Roche 2010). Le Figaro and Le Monde were selected as being two of the main national “haut de gamme” (high standing) daily newspapers in France (Charon 2013).
As of 2006, there were 254 regional newspapers in France, with a total readership of 2,010,240 (from data in Béguier 2006). As of 2008–2009, the distribution of Le Figaro and Le Monde was 315,656 and 294,324, respectively (Corroy and Roche 2010). Where impacted populations are widely dispersed, and in the existence of a press system composed of multiple regional newspapers, Besley and Burgess (2002) argue that regional presses will have a greater incentive to cover local issues. They will also have a greater influence on the catchment populations, writing in the language, dialect or style of the reader, thus being accessible to (and preferred by) the local readership.
Forecast delivery by the newspaper during Eyjafjallajökull
During the Eyjafjallajökull eruption, forecasts, risks, and hazards, as well as uncertainty on projections, were well communicated by newspapers. For example, maps of (and projections for) cloud extent appeared in both The Times and The Sun on 16 April 2010, the model-based forecast for future cloud location being termed a “prediction” by The Times. The cloud extent was filled with a dark gray tone (The Times) or red color (The Sun), with The Times adding “when it erupts it produces a grey ash that has a high fluoride content.” The nature of the hazard was also well stated. For example, on 16 April, The Times published a double page spread illustrating ash impacts on aviation operations, including a correctly annotated schematic of an aircraft engine ingesting ash. On the same day, a report spread across pages 4 to 5 of The Sun stated that ash “can wreck jet engines, choke ventilation systems and sand-blast windscreens.”
Uncertainty was clearly stated. On 21 April, The Times, in a page 5 analysis entitled “flying into the unknown”, pointed out that “all weather models are based on probabilities rather than fact.” The article added that the model used by the UK Meteorological Office (hereafter the Met. Office) was called “Name” (Nuclear Accident Model), which had been developed out of the need to model dispersion of nuclear fallout after the 1986 Chernobyl disaster. The Times described how Name treated the volcanic cloud in the same way as Chernobyl’s radioactive cloud, using “an estimate of the volume of ash injected into the atmosphere” to produce “a best estimate for where ash will be found.” The report went on to state that “our knowledge of the nature of the plume and of atmospheric conditions being imperfect, the model will inevitably be unable to predict the position of the plume to the nearest inch.”
However, in spite of these statements, uncertainty was used to mean “cautious”, even “overcautious”; or “health and safety gone mad” (see Part 1 of this review). Words such as “absurd”, “chaos”, “confusing”, “crisis”, “havoc”, “mad”, “mayhem”, “pandemonium”, and “shambles” appeared in dictionaries created from all reports in The Times and The Sun during the event, with the volcano even being described as “mighty” or a “monster” (Harris et al. 2012). These are strong, evocative words that carry more weight than “uncertain” and “forecasting”.
An aircraft encounter during the Eyjafjallajökull eruption
On 22 April, a Sun Exclusive spread across pages 10 and 11 detailed a probable aircraft ash encounter that caused a commercial flight to abort due to loss of an engine-bleed after a “strong smell of ash” was encountered at 16,000 ft. The report gave the flight path information and the pilot communication transcript, with an expert statement commenting that it was “a very uncommon fault,” and that “for it to happen as the plane flew through the ash cloud is a worry.” The source added that, if it was really a minor technical fault, the pilot would not have taken the long detour over the sea, “he would simply have turned around.” The airline involved, however, claimed that the incident was due to a minor technical fault with the air-conditioning system. The report concluded with the line that “meanwhile travel firms claimed that Britain’s response to the ash crisis was a shambles,” with the UK Transport Secretary being quoted as admitting “it’s fair to say we’ve been too cautious.” These final lines appear to align with the slant apparent in The Times on 20 April that accused the Met. Office of “only making a weather report.” However, this aircraft encounter actually seems to have validated the Met. Office forecast for that day. Advisory maps issued by the Met. Office at 00:00 GMT on 22 April placed ash over the Manchester area, at flight level SFC/FL200 (that is, between sea level and 20,000 ft, i.e., up to 6000 m) for most of the day (see http://www.metoffice.gov.uk/aviation/vaac/data/VAG_1271892412.png). This apparently successful forecast was, though, not mentioned in the report.
Framing of the response during the Eyjafjallajökull eruption
Forecast, uncertainty, and their use was framed in such a way that implied the response agencies were in some way incompetent or, at best, confused; even somehow responsible for the crisis. For example, on 25 April an article appeared on page 19 of the Mail on Sunday under the banner headline “A natural disaster, but a man-made catastrophe.” Likewise, “Air crisis shambles” was the front page headline in The Times on 22 April. Irrespective of the content of the stories that followed, the messages transmitted by such eye-catching and evocative titles is not positive to those deemed responsible for the “catastrophe” or “shambles”. The subsequent distortion was summed up in the key words found in a page 5 report of the Daily Mirror on 22 April 2010. These were: “cautious”, “caved in”, “shambles”, “muddle”, “confusion”, “irritated”, and “furious.” The same report, entitled “We made an ash of flight ban”, contained the following quote regarding the Government response,
They underestimated the severity of the consequences of the decision.
These sentiments are borne out by the results of the Google trends analysis of Burgess (2011) who found 29 blame or responsibility stories in his search, including:
-
“airlines look for blame”;
-
“Met. Office got it wrong”;
-
“airline fury”;
-
“pandemic of panic”;
-
“Met. Office photos didn’t exist”;
-
“restrictions unnecessary”;
-
“our reaction a shambles.”
The effect of this frame was soon reflected in letters written to various newspapers. For example, on 20 April, a letter written by a “pilot with 15 years of experience” appeared in The Sun on page 19. The letter argued that tens of thousands of planes were likely to have flown through ash during the “last 50 years” and that, although thick ash was a huge risk, “thin ash had not proven to be a serious risk.” The writer argued that volcanic ash had not yet claimed a life due to the skill of crews. The writer would have “kept planes flying and gladly flown in them”, and demanded:
better facts, proper science and solid risk analysis.
The letter finished by claiming that, if the issue of risk is taken to its ultimate conclusion, then “placing 300 passengers in a metal tube 30 000 ft above ground would not happen.” Such sentiments even entered the scientific literature (see Appendix). The question is: why and how does such framing occur, and what can we do about it?
The uncertainty slant during the Eyjafjallajökull eruption
During the Eyjafjallajökull eruption, uncertainty was turned from a necessary consideration of error, or incomplete constraint of a scientific problem, into evidence that the responsible agencies were “too cautious” (The Times, 20 April, p. 3). This was exaggerated by the fact that the same agencies were dealing with apparently simple questions that would have been perceived as easy to answer, such as (The Times, 20 April, p. 3),
-
“where is the ash cloud?”,
-
“when will the eruption end?”,
-
“when will flights resume?”, or (Daily Mirror, 22 April, p. 5):
-
“why did it take 6 days (to reopen airspace)?”
The problem was exacerbated by the readership being faced with regular images of impressive ash plumes rising above Eyjafjallajökull and widespread use of evocative words such as “black”, “gigantic”, and “menacing” to describe the cloud (Harris et al. 2012). As a result, statements to the effect that the ash often seemed “not too bad” but, because it was caught in a high-pressure system, it was constantly “swirling around” (The Times, 22 April, p. 71) were likely difficult to comprehend by the readership. This simply did not match what they were seeing in the skies above them and on the front pages in front of them. Readers were instead familiar with the problems and loss faced by those viewed as “stranded”, this being the top word used by both The Sun and The Times with a total word count of 139 (Harris et al. 2012). To use the words published in the press examined here, they were stranded by an invisible but “black”, “menacing”, “swirling” mass.
Newspaper reporting of storm Dirk and flooding of Morlaix
Météo France has a four color warning system for severe weather and floods running from green (i.e., no warning in place), through yellow and orange, to red. Orange means “remain very vigilant” (Météo France 2011). On 23 December 2013, an article appeared on page 3 of Ouest France giving an orange weather warning and stating that strong winds, heavy rain, high waves and littoral flooding were likely. Although such a warning advises “caution … … … above all, next to the sea”, no inland flood warning was printed. During the night of 23–24 December, the Breton town of Morlaix was flooded up to a depth of 1.4 m, with flooding beginning around 03:30 am (all times are local, GMT+1) on 24 December (Ouest France, 26 December, p. 6). Due to confidence in the forecast, many businesses and households had not implemented flood protection measures that would otherwise have been installed (Figaro, 27 December, p. 8). As a result, on 25 December, La Montagne published a back page report entitled “Torrential flood surprises inhabitants of Morlaix in the heart of the night.” In the report, it was stated that the flood warning at 02:00 am on 24 December was still green. Thus, the report continued, the area had been alerted to the storm, but not to the possibility of flooding. Flooding was widespread across Brittany during the night of 23–24 December, but Ouest France (26 December 2010) reported that the town of Quimperlé was still at level yellow on the evening of 23 December, and only on the morning of 24 December was the level increased to orange, by which time the situation was “already at level red.” The alert was also “late” in Quimper. All of the problems were argued to result from the fact that the weather forecast was “too optimistic” in regards to rain fall (Ouest France, 26 December, p. 6).
On 27 December, Le Figaro ran a report entitled, “DIRK: state services called into question”. Placed on page 8, it stated that the Breton population was “angry” after being left without information during the storm. The report went on to point out that the flood warning map had been “erroneous.” On the same day, Ouest France carried a page 6 report with a similar title, “Floods: the alert system called into question.” The report pointed out that both Météo France and the regional flood monitoring agency (Vigicrue) had kept the warning level at green through 06:00 am on 24 December. The Minister for the Interior was quoted as saying that it was “necessary to work on better prevention measures” and to “review the alert system for floods.” These sentiments were echoed in Le Monde where it was claimed that the state services had committed an “error of appreciation” (Le Monde, 28 December, p. 10).
These are words, phrases, reactions, and expectations not too dissimilar to those printed during the Eyjafjallajökull eruption. In regard to expectations, there appears to be a belief that a failsafe warning can be provided in plenty of time, all of the time; and that if there is no warning—or a poor forecast occurs- then those who are part of the response system become responsible for the event and all losses incurred (see Part 1). This unquestioning faith in the certainty of the warning parallels the 1997 Grand Forks flood disaster (USA), when complete confidence in the ability of flood protection measures were “transferred into certainty in the National Weather Service forecast” (Morss 2010). In the case of Morlaix, uncertainty on the forecast was not given. The result, though, was the same as for Eyjafjallajökull event, forecasters (in this case Météo France) working with the natural phenomena were viewed as “dysfunctional” (Ouest France, 27 December, p. 7 & 9).
Michael Fish and the “great storm” of 1987
In many ways, the Morlaix example mimics the famous “Michael Fish case” of 1987. On 15 October 1987, Fish (a well-known British Broadcasting Company (BBC) weatherman) stated, during the BBC 1 lunchtime (12:55 GMT) weather forecast, that (http://www.youtube.com/watch?v=uqs1YXfdtGE):
earlier on today apparently a woman rang the BBC and said she’d heard there was a hurricane on the way. Well, if you are watching; don’t worry, there isn’t … … …
The next day, the deepest depression to hit the UK in at least 150 years swept across southern Britain (Burt and Mansfield 1988). Due to the forecast miscommunication and the resulting storm impact, on 17 October 1987 The Daily Mirror ran a front page headline:
Fury at weathermen as 17 people die, WHY DIDN’T THEY WARN US?
The report began with the line “What’s the point of having weathermen if they can’t even warn us a hurricane is on the way?” Subsequently, Houghton (1988) pointed out that warnings based on forecast models were given to the police, fire service, rail network, and airports (Morris and Gadd 1988). However, Houghton (1988) also wrote that,
by Sunday, the papers, still looking for a scapegoat to blame for all the damage, were looking for stories which concentrated on the personalities involved.
As a result, a well-attended press conference was held at the London weather center in which the reality of the forecasts, uncertainty, and how unusual the storm had been were pointed out. Subsequently, the “whole tone of the press” became “more favorable” (Houghton 1988).
Newspaper response to forecasts during St. Jude
In the case of St. Jude, a correct forecast was widely applauded, with The Sun printing (29 October 2013, p. 4) “The Met Office got this one right.” The response, which included a blanket train cancelation, was clearly necessary. More than 200 trees were removed from railway lines, with staff shortages meaning there was insufficient man power to clear the lines quickly, around 40 of which had been blocked (The Daily Express, 29 October 2013, p. 2–3). South West trains thus stated (The Times, 29 October 2013, p. 6), “If we had gone ahead with normal services, people would have been stuck on trains, and we would have (had) trains and crews stranded all over the place.” The chief executive of the rail customer watchdog added,
It’s too early to tell if the industry made the right call when cancelling so many services, but the fact that major incidents have been avoided is good news.
We even had the headline (The Times, 29 October 2013, p. 7), “Advance warnings kept storm bill down to estimated £1.5 bn.” However, spread across pages 6 and 7 of the Daily Mail we still have the banner headline, “Fury of the stranded commuters.” In this report, we find (Daily Mail, 29 October 2013, p. 6):
Millions suffer as trains and roads are hit by the storm
… … … Last night angry commuters said they had not been given enough warning about the cancellations. Forums and message boards were flooded with comments, with some people complaining that rail companies had been giving confusing and unreliable advice about the services they were running. Others accused rail bosses of overreacting by cancelling rail services in sunny parts of the country.
Note again the expectation that a precise “warning” will be made well in advance of the event. The report also contained several quotes from passengers including, “Sitting at the station in sunny Leicester and pretty much every train has been cancelled due to severe weather;” and “Opposite of the British Bulldog spirit. Flights on. Buses on, but trains all cancelled on Southern Railways lines. Overcautious!”
This example raises the problem that, during the event, responding actors may be too busy with their role in the chain of response to construct and deliver information to those impacted by the event. Unfortunately the result is again a newspaper frame of “confusion” and “unreliability” for the responding group. As a result, however good the forecast and response, we still see claims of “over-caution” and “overreaction”, to cause “anger”, “fury”, and “accusation.”
What is the popular press response?
In the cases of storm Dirk and Michael Fish, “anger” or “fury” was the immediate reaction to the two forecasts and the impact of the ensuing event. Such a reaction may be expected because incorrect forecasts for both events were delivered with an air of certainty. In contrast, forecasts made during the Eyjafjallajökull eruption were delivered with a degree of uncertainty. However, in the word dictionaries created for Eyjafjallajökull by Harris et al. (2012) from all reports appearing in The Times and The Sun we find the words “anger” or “angry” appearing 23 times, with “fury” and “furious” appearing 14 times: around three “angry” or “furious” responses per day over the 10 day study period. Such an “anger emotion family” has been found to be the reaction associated with an event whose outcome is judged as unfair or unjust in terms of the impacted stakeholder (Mikula et al. 1998). Unfortunately, it is an easy emotion to generate during widespread loss (see Part 1 of this review), and is a natural response among groups whose goals are blocked by an external force. The anger emotion family will thus not necessarily be triggered by reading about “anger” or “fury” in the newspapers, but, for those not involved in the event, generation of anger may be exactly what the press wants. As Curran (2010) argues, a tabloid-driven dynamic began in the 1970s, and prevailed throughout the 2000s, to make readers “angry”, “indignant”, or “cross”. This strategy was designed to win, and keep, readers (Curran 2010).
Uncertainty: filtering and communication
One problem lies in expectation. That is, we need to ask what each stakeholder expects from the forecast in regard to the risks each faces. Nelkin (2003) lays the problem out nicely,
People perceive risks through different ‘frames’ that reflect their values, world views, and concepts of social order. These frames can influence definitions of risk, allocations of responsibility and blame, evaluations of scientific evidence and ideas about appropriate decision-making authority. Is risk to be defined as a technical matter to be resolved by measuring the extent of harm? A bureaucratic issue of appropriate regulatory mechanisms and jurisdictions? An economic question of allocating costs and benefits? A political issue involving consumer choice and control? A moral issue involving questions of social responsibility, religious values, equity and rights?
A similar disconnect was found by Jardine and Hrude (1997) who suggested that terminologies used by risk practitioners have different technical and colloquial meanings that result in mixed “messages.” For example, risk may mean danger, venture or opportunity colloquially; but hazard, probability or consequence technically, and chance or uncertainty for the insurance business. Consequently, a risk forecast will be interpreted and used differently by each stakeholder. The result is what Jardine and Hrude (1997) termed “unnecessary confusion”.
Thus, we need to understand the language or syntax of forecast and uncertainty, and then meaning of that language as used by each stakeholder. There will be several stakeholders involved in the crisis or emergency, including scientists, forecasters, hazard managers, responsible government agencies, politicians, businesses, media, and the public. All will be interacting with each other and each will have their own expectations. This complex interaction will further influence the perception and application of uncertainty, potentially corrupting its use for political or business gain (Cornell and Jackson 2013). However, to begin to understand the communication of uncertainty during a crisis, we first need to understand the role of the forecast in the decision-making process. During emergencies, forecast and uncertainty will pass through, and be modified by, filters applied during the decision-making process, especially application of cost-benefit analysis and precaution.
Filtering the decision I: role of cost-benefit analysis
Cost-benefit analysis (CBA) allows regulators to “tally up the benefits of regulations and its costs, and choose the approach that maximizes the net benefits,” so that regulators should “proceed if the costs exceed the benefits, but not otherwise” (Sunstein 2005). Sunstein (2005) continues, “if poor people stand to gain from regulatory protection, such protection might be worthwhile even if rich people stand to lose somewhat more”, with CBA providing a clearer sense of the “stakes” involved in enforcing regulation. In terms of such a CBA-based approach, Arrow and Fisher (1974) pointed out that, “any discussion of public policy in the face of uncertainty must come to grips with the problem of determining an appropriate attitude toward risk on the part of the policy maker.” In their opinion, the expected benefits of an irreversible decision should be “adjusted to reflect the loss of options it entails” (Arrow and Fisher 1974). Arrow et al. (1996) followed up by arguing that CBA has “a potentially important role to play in helping inform regulatory decision-making”, while recognizing that “it should not be the sole basis for such decision-making.”
A classic approach applied in economics, as originally proposed by Dupuit (1844), Arrow et al. (1996) argued that the role of CBA is to compare favorable and unfavorable effects of policies and should be required for all major regulatory decisions. Their conclusion was that, “CBA analysis can play an important role in legislative and regulatory policy debates on protecting and improving health, safety, and the natural environment.” CBA has since been endorsed by the Commission of the European Communities who stated that, “the protection of health takes precedence over economic considerations” (European Community 2000). In this sense, CBA is proposed not on the basis of economic efficiency, but to assist in accounting for and thinking about risks (Mandel and Gathii 2006). While Woo (2008), for example, assessed the ability of CBA to set probabilistic criteria for evacuation decisions during volcanic crises, Marzocchi and Woo (2007) explored the potential of CBA in assessing the costs versus proposed mitigation measures and levels of “acceptable risk” during a volcanic eruption. Marzocchi and Woo (2009) concluded that their approach “enabled volcanologists to apply all of their scientific knowledge and observational information to assist authorities in quantifying the positive and negative risk implications of any decision.” Sunstein (2005) thus supported CBA for its ability to “produce useful information” and “increase the coherence of programs that would otherwise be a product of some combination of fear, neglect, and interest group power.”
However, for Mandel and Gathii (2006), consideration of future benefits and costs raises a temporal quagmire. How, for example, do we treat deaths? One way is to apply the willingness to pay (WTP) framework which estimates the value of statistical life (VOSL). This can be derived by taking into account individuals’ own WTP for a reduction in the risk of death (Covey 2001). Within this architecture, if an ash cloud encounter caused an Airbus A320-200 to go down, at maximum capacity, we could lose 180 passengers, plus four crew members. If we use a VOSL value of US$ 200,000, as used by Arrow et al. (1996), then this amounts to a WTP of US$ 37 million for one incident. If we use the VOSL value used by the US Environmental Protection Agency of US$ 6.1 million (Sunstein 2005) then this increases to US$ 1.1 billion. These estimates compare with the US$ 693 million cost estimated by Čavka and Čokorilo (2012) for catastrophic loss of an Airbus A320. The Čavka and Čokorilo (2012) estimate also includes costs of loss of aircraft, delay and closure, staff investment, baggage and increased insurance, as well as search and rescue, site clear-up, investigation costs, and loss of investment income. Brownbill (1984) estimated that the total cost of aircraft accidents in Australia in 1980 was approximately US$ 27 million. These values compare with the US$ 2.4 billion loss to the airline industry due to the airspace closures forced by Eyjafjallajökull’s eruption during April and May 2010, plus a US$ 4.1 billion loss in market value (Ragnao et al. 2011). We can add to this financial loss experienced by passengers which were likely between US$ 0.3 and 8 billion (Harris et al. 2012). Then there is the US$ 640 million per day of economic losses due to reduced productivity because of stranded workforce (Harris et al. 2012), which over the 6 days of airspace closure amounts to US$ 3.8 billion. Such financial losses by airlines were covered at length on a daily basis in the newspapers, as were human interest stories of individual personal financial loss (Harris et al. 2012). However, the cost of a single airliner loss was not. The question is thus, was the role of CBA appropriately communicated during the events reviewed here?
As Arrow et al. (1996) suggested that “benefits and costs of proposed policies should be quantified wherever possible—best estimates should be presented along with a description of the uncertainty.” They added that favorable and unfavorable effects of policies must be considered. However, during Eyjafjallajökull and Dirk, costs were covered by the press in terms of financial loss to businesses and individuals. Only for St. Jude were benefits covered. One of the few statements of benefit I could find during Eyjafjallajökull was in a letter that appeared in The Sun on 21 April 2010 (p. 47) in which the writer argued that people should not complain because if a plane went down “they’d all be dead,” so for once we should applaud the Government for “doing their job right”. A communication blueprint that ensures that the costs and benefits of the action are clearly stated, ideally in numeric terms, thus seems a logical action during an environmental disaster.
Filtering the decision II: the precautionary principle
The precautionary principle (PP) has a long history in influencing policy and decision-making in the UK and Europe, having entered the language of environmental policy in Britain in the mid-1980s (Haigh 1994). Sunstein (2005) opens his book with the following definition of PP:
All over the world, there is increasing interest in a simple idea for the regulation of risk: In case of doubt, follow the Precautionary Principle. Avoid steps that will create a risk of harm. Until safety is established, be cautious … … … In a catchphrase: Better safe than sorry.
Thus Sachs (2011) argues that PP “can provide a valuable framework for preventing harm to human health and the environment.” As such, PP can be used in many domains including business, health, and hazard (e.g., Raffensperger and Jackson 1999; Faunce et al. 2008). It requires any precautionary action to be “cost effective” and is applied to risks where there is a “lack of full scientific certainty” (Marchant et al. 2013). However, there is much ambiguity over the definition of PP, there being dozens of different definitions and differences in the understanding of the intended purpose and status of PP (Marchant et al. 2013). Adams (2002) concurs that PP is “vague and ill-defined”, but suggests that there are six main ingredients to its application; where PP should be applied if:
-
1.
A causal link to effects is unclear;
-
2.
Scientific evidence does not yet exist;
-
3.
There is no scientific evidence;
-
4.
Cost is a factor;
-
5.
The scale of the threat is a factor;
-
6.
There are a diversity of situations to be accounted for.
Adams (2002) adds that “the unifying factor is that the handling of inconclusive knowledge, i.e. uncertainty, is central to PP.” Peel (2005) adds that, at the heart of PP is a concern whether uncertain scientific knowledge can be to “describe comprehensively, and predict accurately, threats to human health and the environment.” Van den Belt (2003) and Ricci et al (2003) attempt to clarify PP in the context of dealing with environmental hazards by taking the text from the Rio Declaration on environment and development of 1992 (Article 15):
The precautionary approach shall be widely applied by states according to their capabilities. Where there are threats of serious or irreversible damage, lack of full scientific certainty shall not be used as a reason for postponing cost-effective measures to prevent environmental degradation (http://www.unep.org/Documents.multilingual/Default.asp?DocumentID=78&ArticleID=1163).
Andorno (2004) went on to argue that,
The greatest merit of the precautionary principle is that it has succeeded to reflect the current public concern about the need to favor the protection of the public health and the environment over short term commercial interests.
Judging what is an “acceptable” level of threat to society is an eminently political responsibility (Graham and Hsia 2002). As a result, in 2000, the Commission of the European Communities issued a communication to clarify its approach in using PP and to establish guidelines for its application (European Community 2000). The document, applauded by Foster et al. (2000) because it stated how science rests in the decision-making process, argued that PP should be applied if preliminary objective scientific evaluation indicates reasonable grounds for concern over potentially dangerous effects on human health. Relevantly, the document stated,
The precautionary principle, which is essentially used by decision-makers in the management of risk, should not be confused with the element of caution that scientists apply in their assessment of scientific data;
but,
Recourse to the precautionary principle presupposes that potentially dangerous effects deriving from a phenomenon, product or process have been identified, and that scientific evaluation does not allow the risk to be determined with sufficient certainty.
The European Community (2000) thus argued that,
when there are reasonable grounds for concern that potential hazards may affect the environment or human, animal and plant health, and when at the same time the available data preclude a detailed risk evaluation, the precautionary principle has been politically accepted as a risk management strategy.
Similar sentiments have been laid out by, for example, the Intergovernmental Panel on Climate Change (Pachauri et al. 2000), the UK Government (ILGRA 2002) and UNESCO (COMSET 2005). As modified from circulars from European Community (2000) and Foster et al. (2000), the PP guidelines reduce to:
-
1.
Proportionality: measures must not be disproportionate to the desired level of protection, but cannot aim at zero risk;
-
2.
Nondiscrimination: comparable situations cannot be treated differently and different situations cannot be treated in the same way;
-
3.
Consistency: measures should be comparable in nature and scope with measures already taken in equivalent areas in which all the scientific data are available
-
4.
CBA: examination of the benefits or cost of action, or lack of action, should include a cost-benefit analysis;
-
5.
Scientific developments: initial assessments must be viewed as provisional in nature, pending availability of more reliable data, instrument deployment, analysis, interpretation, and reporting so as to obtain a more complete and updated assessment.
Clearly, within this approach, the scientist and forecaster has no responsibility for making any decision. Their role is purely supportive and advisory in the decision-making process. As Andorno (2004) writes:
Although the precautionary principle operates in the context of scientific uncertainty, it should be applied only when, on the basis of the best scientific advice available, there is good reason to believe that harmful effects might occur to public health or to the environment.
Within this framework, Gollier et al. (2000) argued that greater levels of uncertainty should induce the decision-maker to favor more conservative measures today, but to then reconsider options in the future. Thus, decisions made even in the recent past should not influence the current response.
PP is not without its detractors (Sandin et al. 2002). Sunstein (2002) argued that the “problem with PP is not that it leads in the wrong direction, but that—if taken for all it is worth—it leads in no direction at all.” Van den Belt (2003) also argued that, because the “slightest indication that a particular product or activity might possibly produce some harm to human health or the environment will suffice to invoke the principle”, the principle reduces to an “absurdity”. Mandel and Gathii (2006) pointed out that forms of PP range from relatively “weak” constructions (e.g., a lack of decisive evidence of harm should not be grounds for “refusing to regulate”) to “strong” (e.g., action should be taken to correct a problem as soon as there is evidence that harm may occur). Sunstein (2005) concluded that both forms are useless. While weak forms simply state a truism where governments cannot require absolute certainty that harm will occur, the strong form prohibits all actions and so is totally paralyzing. Hahn and Sunstien (2005) added to these sentiments, writing, “taken seriously, it can be paralyzing, providing no direction at all.” At the same time, Andorno (2004) pointed out that, “the line between a reasonable precaution and an excessive precaution is very thin and allows a wide margin of appreciation to decision makers.”
Ricci et al. (2003) added a question regarding legal, scientific, and probabilistic implications of updating past information when the state of information increases “because a failure to update can result in regretting past choices.” Goldstein and Carruth (2004) went further, arguing that PP can inherently restrict obtaining and using science so that, if we are to maximize the value of PP, “it is crucial that its impact does not adversely affect the potent preventive role of science and technology.” Thus, Cameron (2006) listed the seven most frequent criticisms of PP as being:
-
1.
Excessive discretion;
-
2.
Reversal of the burden of proof;
-
3.
Distortion of regulatory priorities;
-
4.
Stifling of technological innovation and paralysis of development;
-
5.
Costs of precautionary measures, while discounting the benefits;
-
6.
Misuse as a protectionist barrier;
-
7.
Perverse consequences from precautionary measures;
To sum up, PP causes governments to err on the side of caution in decision-making, especially when uncertainties are large (Goldstein and Carruth 2004). Chakraborty (2011) argued that during the Eyjafjallajökull eruption “the Civil Aviation Authority applied a zero-tolerance policy in regards to aircraft operations through volcanic ash.” Indeed, PP has emerged as one of the main regulatory tools of European Union environmental and health policy with important ramifications for member state policies (Löfstedt 2002; Wiener and Rogers 2002; Balzano and Sheppard 2002).
CBA and PP: operational constraints
CBA and PP are the frameworks and constraints within which scientists and forecasters have to operate and communicate during times of crisis. There is an immense amount of uncertainty on any forecast, so that PP—being uncertainty driven—will always be applied. This explains the widespread use of the words “cautious”, “overcautious”, and “too cautious” in the word dictionaries created for The Times and The Sun during Eyjafjallajökull’s eruption by Harris et al. (2012), in which the word “cautious” appears at least 20 times. In contrast, the word “uncertainty” appears just once (in The Sun dictionary). Even the report of an aircraft ash encounter in The Sun, as cited above, ended with the quote “it’s fair to say we’ve been too cautious.” The conclusion of Viens (2011) here seems appropriate,
given the level and extent of normative uncertainty during times of emergency, risk regulation should devote more attention to the question: what one ought to do when one does not know what to do?
Because there will always be uncertainty, more flexible approaches in forecast provision and communication of the risks involved with the associated hazard have been advocated. In terms of uncertainty and application of PP, Funtowicz and Ravetz (1990) set up the problem by stating that “the traditional assumption of the certainty of all quantitative information” needs to be recognized as “unrealistic and counterproductive.” They argued that the problem originates from an inappropriate conception and meaning of numbers in relation to the natural and social worlds, where “an uncertain quantity” can be conceived as an “incorrect fact”. However, care needs to be taken because data expressed as a string of digits presents a spurious appearance of accuracy (Funtowicz and Ravetz 1990). Ruckelshaus (1984) added that risk calculations must be expressed as distributions of estimates or ranges of probability. But, results also need to be put into perspective, and provision of “magic numbers” that can be “manipulated without regard to what they really mean” (Ruckelshaus 1984) needs to be avoided. This is a well-recognized problem, where the “red book” produced by the Committee on the Institutional Means for Assessment of Risks to Public Health (CIMARPH 1983) stated that “when scientific uncertainty is encountered in the risk assessment process, inferential bridges are needed to allow the process to continue.”
Meaning and language of uncertainty during emergencies
To the scientist, uncertainty on a measurement stems from many components which Taylor and Kuyatt (1994) group into “those which (can be) evaluated by statistical methods” and “those which (can be) evaluated by other means”, so as to cause random and systematic errors. Taylor and Kuyatt (1994) go on to state that “the nature of an uncertainty component is conditioned by the use made of the corresponding quantity.” Taylor and Kuyatt (1994) argue that uncertainty is also conditioned by “how the quantity appears in the mathematical process that describes the measurement process.” Thus, in science, uncertainty is a quantitative error statement which may be expressed using statistical assessments of variation in a measurement (e.g., Grabe 2001). Consequently, the measurement, result, projection, or forecast can be expressed in terms of (Grabe 2005):
This defines “the result of a measurement” which is “required to localize the true value” of the quantity being measured (Grabe 2005). In support of this definition, Taylor (1997) writes, “error analysis is the study and evaluation of uncertainty in measurement. Experience has shown that no measurement, however carefully made, can be completely free of uncertainties.” However, such simple definitions of uncertainty can only apply to a single measurement made in isolation and then interpreted by the scientist who made them. Uncertainty on model results and forecasts supplied to decision-making chains are more complex (Fig. 2).

The uncertainty cascade: an attempt to define the processing chain between event occurrence and forecast delivery. While the top row gives the objects of the chain, the second lists some of the uncertainties impinging on each object [following Wynne (1992) and Spiegelhalter and Riesch (2011)]. An external (to the official response chain) feedback into the uncertainty process is indeterminacy. This may be introduced by the press and other actors impacted by the forecast. There will also be those involved in the uncertainty trough, these being alienated parties (Shackley and Wynne 1995). These two effects may not always apply, so are linked with dashed lines. At the bottom, I qualitatively assess the integrated uncertainty on the forecast in terms of multiplication of the uncertainty objects defined in the top row, these being: (i) unpredictability of the event (UCO 1); (ii) model input limits (UCO 2a), and the result of feeding unreliable results from one model to the next (UCO 2b); (iii) inadequacy in knowledge and ability to make basic measurements (UCO 3); and (iv) the impact of unexpected events (UCO 4). The latter effect may not always come into play, so is depicted as a top row detour. The press and industrial or business influences (UCO A), as well as maverick and rival scientific influences (UCO B), may also contribute to the uncertainty of the forecast. The result is a complex and hard to quantify uncertainty value on the forecast
Definition and application of uncertainty during the decision-making process
Walker et al. (2003) defined uncertainty as “any deviation from the unachievable ideal of completely deterministic knowledge of the relevant system.” Moss and Schneider (2000) argued,
The term ‘uncertainty’ can range in implication from a lack of absolute sureness to such vagueness as to preclude anything more than informed guesses or speculation. Sometimes uncertainty results from a lack of information, and on other occasions it is caused by disagreement about what is known or even knowable. Some categories of uncertainty are amenable to quantification, while other kinds cannot be sensibly expressed in terms of probabilities.
In terms of the decision-making process for a population at risk, the European Community (2000) is more specific, stating:
Scientific uncertainty results usually from five characteristics of the scientific method: (i) the variable chosen, (ii) the measurements made, (iii) the samples drawn, (iv) the models used and (v) the causal relationship employed.
The same document also points out that scientific uncertainty may also arise from controversy. Uncertainty may thus relate to both qualitative and quantitative elements of the analysis. Within this system, Wynne (1992) defined four different kinds of uncertainty, which increase in scale as we move down the list:
-
1.
RISK—where we know the odds;
-
2.
UNCERTAINTY—where we do not know the odds, but may know the main parameters which can be used to reduce uncertainty;
-
3.
IGNORANCE—complete ignorance—where we just “don’t know what we don’t know”, and
-
4.
INDETERMINACY—which are causal chains and open networks that produce results and feed backs that cannot be predicted.
In terms of forecasting, Shubik (1954) made the pertinent point that “the more and the better are one’s data on the past, the more chance one has of picking a good law for predicting the future.” Following Shubik (1954), we may add that the amount of information regarding the future state of factors influencing event progression will decrease as the time period separating the forecast from the event becomes more distant, meaning that ignorance, and hence also, uncertainty will increase with forecast time period. Epstein (1980) makes this point well stating that “typically a decision must be made in period 1 subject to uncertainty about the environment that will prevail in period 2.” At the start of period 2, the state of the environment becomes known. Epstein (1980) argues that such a logical temporal progression appropriate for a situation where n > 1 decisions have to be made simultaneously during an event when the decisions actually need to be made sequentially subject to improving information is impossible. The same problem will be true for events for which we have little past experience. Stirling (2007) sums up well, pointing out that, due to ignorance, “neither probabilities nor outcomes can be fully characterized”, especially for events that are new and have no precedent. This was very much the case for Eyjafjallajökull.
In terms of indeterminacy, actors in the chain may intercede in an attempt to change the forecast or its basis. Shubik (1954) provides another good example,
stock market prediction published in the newspaper may influence many people to change their intended actions and thus help to make the forecast a reality.
Indeterminacy may also result from the choice of words used to present uncertainty, subjective judgments and scientific disagreement in public (Moss and Schneider 2000), plus detrimental comments, and actions, of impacted stakeholders. This then reduces confidence in the forecast, thereby introducing a form of “qualitative uncertainty.” An example of such an instance can be found during the Eyjafjallajökull eruption when a report in The Times on 20 April 2010 cited the International Air Transport Association as criticizing a “reliance” on “theoretical modeling”. There were many other such comments from airline industry stakeholders which contributed to qualitative indeterminacy.
These multiple and complex components of uncertainty involved when communicating modeling and forecasting results during environmental disasters will all be overlain on each other. The range of uncertainty will span small, if just risk is involved, through large if we have complete ignorance and high degrees of indeterminacy (Wynne 1992; Funtowicz and Ravetz 1990). Forecasting involves all of the uncertainty types listed above. Thus, uncertainty on a cloud forecast—whether it be volcanic or meteorological—is, by definition, as large as it possibly can be. Spiegelhalter and Riesch (2011) add to the problem. They identified five objects on which there will be uncertainty when conducting a model-based risk analysis:
-
1.
The event, which is essentially unpredictable;
-
2.
Parameters within models, which suffer from limitations in terms of input information, availability of real-time data and ability to physically parameterize the natural process;
-
3.
Alternative model structures, that may reveal limitations in the formalized, accepted or mandated knowledge, or which may provide contradictory or conflicting information;
-
4.
Model inadequacy due to known limitations in understanding of the modeled system, counter-lobbies (i.e., other ideas and approaches), and other sources of indeterminacy;
-
5.
Effects of model inadequacy due to unspecified sources, ignorance of anomalies and unexpected events, and other unknown limitations to our knowledge when modeling a highly dynamic and chaotic natural system.
There is also the issue of ambiguity whereby a claim or forecast cannot be definitively resolved or proved. When there is ambiguity Stirling (2007) argues that reduction to a single “sound scientific” picture is neither rigorous nor rational. During the Eyjafjallajökull eruption this was a particularly pressing problem, which was set against airline industry claims that there was no ash where it had been predicted to be. For example, on 19 April 2010, The Times lead with a dominant page 1 report. Occupying 78 % of the front page and entitled “Brown under pressure to get Britain flying”, the caption to the picture accompanying the report read “A test flight carrying the BA chief executive, Willie Walsh, leaves Heathrow yesterday.” The report also stated that test flights had been carried out and no damage was reported so that airline authorities were calling for restrictions to be lifted.
Within the uncertainty system, there will be cascading uncertainty (e.g., Pappenberger et al. 2005). In such a cascade, uncertainties will multiply rapidly as we move through the chain from measurement, through data processing to modeling, to forecast production and delivery (Fig. 2). The complex uncertainty cascade associated with the resulting forecast will be almost impossible to describe in a clear and succinct way. Some of these uncertainties may also not be easy to quantify. Take, for example, the problem of the “uncertainty trough” (e.g., Shackley and Wynne 1995). This is the situation where perceived uncertainty is high among those directly involved in knowledge production, low among users and managers, and then high again by those alienated from the source research program or institute. Lobbying by “alienated” parties may result in further uncertainty in the official forecast. A good example of this problem can be found on The Independent on 20 April 2010 in which the following line was printed,
The main criticism is that European watchdogs are using computer models of theoretical volcanic output and local wind speeds to estimate affected area, and then banning all flights.
In other words, a qualitative criticism of the forecast process added uncertainty to the result. Such indeterminacy will then feedback to reduce confidence in the forecasting process. Within the framework of Fig. 2, such qualitative uncertainty appraisals cannot be quantified, and are not helpful from the scientific perspective.
Donovan et al. (2012a) and Stirling (2007) collapsed these ideas into diagrams that charted the ways in which different types of knowledge regarding risk, ambiguity and ignorance can be combined in an attempt to at least understand the complex interplay of the uncertainty components that feed into the newspaper-published forecast. I have attempted to combine and build on these frameworks in Fig. 3. During a volcanic crisis, there will be many sources of uncertainty to add to the cascade, including “instrument error, model error, choice of models, processing error, interpretative error, population behavior, unknown unknowns and language issues” (Donovan et al. 2012a). Uncertainty thus not only results from error on measurement but also from ignorance—especially if there is no past experience to go on. Uncertainty is then multiplied by subjective judgments, model choice and parameterization, data collection limits, lack of validation opportunities, publication of results from rival models, presentation format of the forecast itself and randomness of the event, as well as criticism, public debate and argument. The end product that arrives in the newspaper is a highly complex derivation of all precedent steps (Fig. 3). This is the product that the readership is subject to.

Attempt to place the heritage of, and complexity behind, newspaper-published event forecasts within the information-flow frameworks of Stirling (2007) and Donovan et al. (2012a). The basis of the flow is a square whose corners are defined by the four main components of uncertainty that impinge on the forecast. These uncertainty sources become less problematic toward the top left-hand corner of the uncertainty square. While thin lines link the components of the scientific preparation of a forecast, thick lines link the uncertainty chain. Unfortunately, the popular perception resulting from viewing the forecast as presented by the newspaper finds itself toward the bottom right corner of this scheme. That is, close to the ignorance component of uncertainty and thus in the most problematic corner of the scheme
These complexities make clear communication of the forecast and its uncertainty to, and through, the newspaper a complicated issue. As Kasperson and Palmlund (1989) pointed out, “the simple fact of the matter is that we know relatively little about how best to communicate complex risk issues.” Risk communication being, itself, a “highly uncertain activity with high visibility and political stakes” (Kasperson and Palmlund 1989). Communication thus requires carefully constructed syntax. Information contained in a report appearing on page 5 of The Times on 21 April 2010, entitled “Flying into the unknown”, was the best blueprint for such a statement that I could find. The article considered the model used by the Met. Office to help forecast the cloud, stating that the model used was called ‘Name’ (Nuclear Accident Model). The report descried how estimates of ash volume being ejected into atmosphere were fed into the model to be coupled with wind speed and structure forecasts to give the best estimate of ash location. The report pointed out that all weather models were based on probabilities rather than “fact” and added that imperfect knowledge of the plume nature and atmospheric conditions meant that predictions inevitably would not be “to the nearest inch”, but that physical measurements suggested that the Met. Office predictions were “pretty close.” However, the same report was careful to point out that airlines thought that scientists made “overcautious interpretations based on probabilistic models and very limited empirical evidence.” This actually seems to be an instance of a recognized component of the uncertainty cascade being used as evidence against the forecast. In such situations, we need more statements that clarify the forecasting process and uncertainty problem, even if we cannot avoid statements from other stakeholders that frame uncertainty in a negative way.
Uncertainty in the business world
In the business world, uncertainty is defined in a similar, but less quantitative, way. The BusinessDictionary.com defines uncertainty as,
a situation where the current state of knowledge is such that (1) the order or nature of things is unknown, (2) the consequences, extent, or magnitude of circumstances, conditions, or events is unpredictable, and (3) credible probabilities to possible outcomes cannot be assigned. (http://www.businessdictionary.com/definition/uncertainty.html, downloaded 01/02/2014 20:56:22)
BusinessDictionary.com adds that, “too much uncertainty is undesirable; (but) manageable uncertainty provides the freedom to make creative decisions.” As a result, in business, uncertainty can be used to the advantage of certain business interests to frame arguments in favor of self-interest. For an individualist market system, Douglas and Wildavsky (1982) wrote that, in terms of an entrepreneur seeking to “optimize at the margins of all his transactions”, the behavior that works best in this environment “does not ignore or regret uncertainties; on the contrary, uncertainties are opportunities.” This business definition of uncertainty thus means that scientific statements of uncertainty can be converted into creative statements to the advantage of the corporate strategist. This appears to have been the case with the “no-risk” argument constructed by the airlines in the press during the Eyjafjallajökull eruption. One, of many, statements printed to support this premise was summed up in a widely cited statement from one airline actor that read (The Independent, 20 April 2010, p. 42–43),
The analysis we have done so far, alongside that from other airlines’ trial flights, provides fresh evidence that the current blanket restrictions on airspace are unnecessary. We believe airlines are best positioned to assess all available information and determine what, if any, risk exists to aircraft, crew and passengers.
This is consistent with Zehr’s (1999) warning that uncertainty can be managed by a spokesperson to achieve a specific goal. Using a series of case studies from environmental debates, Zehr (1999) argued that,
if non-scientists fail to become aware of how uncertainty works, they open themselves to manipulation by scientists and other groups and organizations that use science (and uncertainty) to their own benefit.
Although Stocking (1999) found that the newspaper typically gives equal weight to scientists and nonscientists when handling scientific issues involving uncertainty, in the case of Eyjafjallajökull far more weight was given to nonscientists (see Part 1 of this review). Such a factor enhances corporate use of uncertainty to frame a situation to their advantage. This runs into the problem presented by Kasper (1980) who argued that disparity between objective (real) and subjective (imaginary) risks creates difficulties for decision-makers and regulators due to:
-
1.
Potential presentation by government, industry and technical experts that certain estimates are valid, to result in,
-
2.
Erosion of trust between scientific experts and the public, which is complicated by,
-
3.
The process of setting priorities by governmental and corporate actors, to result in
-
4.
A challenge for the decision-makers to explain uncertainties about the effects of their actions.
Such issues seem to have helped fuel the framing of a “crisis” situation during the Eyjafjallajökull eruption. In Part 1 of this review, I used the word “crisis” 25 times. However, Macrae (2011) argued that, during the Eyjafjallajökull eruption, “one of the most amazing aspects of this crisis was that there was a crisis at all” because “there was already regulation in place with an emphasis on safety throughout the aviation industry.” Macrae (2011) went on to argue that airlines “recognized that the first carrier to send up an airliner that then crashed would go the way of Pan Am after the Lockerbie bombing: the market would kill the company as passengers shifted to “safer” airlines.” The problem was, “the image of catastrophic engine failure that captured the imaginations in the first two days soon faded as millions of lesser disasters and conveniences surfaced,” these being the stories of suffering among the stranded (see Part 1 of this review). Thus, the Eyjafjallajökull event “was a remarkable instance of the possibility of a severe loss being set against the certainty of multiple lesser losses, a risk equation that is always difficult to manage” (Macrae 2011). As argued in Part 1, individual blame logic, as commonly applied in business, can then result in the forecasts and their uncertainty being blamed for all losses associated with the event.
Uncertainty: the popular view
For the colloquial meaning of uncertainty the problem is well stated by Gigerenzer (2002). The second chapter of his book, “The illusion of certainty”, opens with the statement (p. 9),
The creation of certainty seems to be a fundamental tendency of human minds. The perception of simple visual objects reflects this tendency. At an unconscious level, our perceptual systems automatically transform uncertainty into certainty.
Peel (2005) adds:
For a generation growing up with television programs like ‘CSI: Crime Scene Investigation’, ‘scientific certainty’ may well seem an achievable reality, rather than an elusive fiction. Claims of scientific ‘proof’ in the media suggest that knowledge about a particular phenomenon is indisputable and universally accepted by scientists.
That the uncertainty versus certainty problem is commonly transformed into a black and white decision—unknown versus known; “yes” or “no”—is borne out in various online definitions of uncertainty. For example, the British English Dictionary and Thesaurus defines uncertainty as (http://dictionary.cambridge.org/dictionary/british/uncertainty, downloaded 01/02/2014 21:02:43),
a situation in which something is not known, or something that is not known or certain: Nothing is ever decided, and … … … uncertainty is very bad for staff morale.
The last part of this definition is of extreme concern. Such a meaning is implicit in the following line published during the second air space closure due to continued activity at Eyjafjallajökull in May 2010 (The Daily Telegraph, 10 May 2010, p. 14):
Thousands of travellers are facing uncertainty after another cloud of volcanic ash crippled services to parts of Europe and America over the weekend
This colloquial—not decided—association with uncertainty, and expectation of a black or white answer, explains the multiple calls for “fact” found in the press during the Eyjafjallajökull eruption. Indeed, journalists themselves have been found to transform provisional findings into certain findings, so as to present science as more solid and certain than it really is, dropping many of the caveats used in scientific writing (Stocking 1999).
Dictionary definitions of uncertainty
The Concise Oxford Dictionary includes a definition of uncertainty that reads “not to be depended on.” This popular perception of uncertainty is further revealed by an analysis of Roget’s Thesaurus (Dutch 1966). Results are collated in Table 1 and begin with word roots such as “doubtful”, “vague”, and “obscure” and move through “distrust” and “mistrust” to end with “nothing to go on” and “anybody’s guess”, before re-referencing “uncertainty.” These dictionary associations with uncertainty are implicit in the following line taken from a report that appeared on the front page of the Daily Mail on 20 April 2010,
An estimated 150,000 Britons stranded abroad by the aviation shutdown could face two more weeks of chaos and uncertainty.
Given these definitions, scientifically rigorous attempts to quantify and communicate uncertainty can be viewed, by the public, as “guesswork” based on “no science” (see Table 1). Take the following headline appearing at the head of page 2 of The Daily Telegraph on 20 April 2010:
Flights grounded by guesswork.
This may explain why the newspaper readership perception of uncertainty can result in the scientist being labeled “mad” or a “nerd” (Gregory and Miller 1998). The definition of uncertainty thus has different meanings for different recipient groups and may trigger several different responses. These responses include “suffering” (see, for example, Fields 2011, p. 29) and feelings of “fright”, “frustration”, or being “overwhelmed” (see, for example, Eoyang and Holladay 2013, p. 8–9).
Dictionary definitions of forecast
The semantic disconnect between uncertainty and forecast is exacerbated by the dictionary definition of the forecast itself. As a verb, to forecast can be defined as to “predict or estimate a future event or trend” (http://www.oxforddictionaries.com). With this definition we already begin to run into a problem in that to predict is also defined as to “say or estimate that (a specified thing) will happen in the future.” Here, the proviso “will” adds an element of certainty to the delivery. In effect, the use of “will” expresses, “a strong intention or assertion about the future” and suggests that we await “inevitable events.” Thereby, forecasting becomes (http://en.wikipedia.org/wiki/Forecasting):
the process of making statements about events whose actual outcomes have not yet been observed. A commonplace example might be estimation of some variable of interest at some specified future date.
In turn, prediction becomes “a statement about the way things will happen in the future.” In this regard, examine the title to the newspaper-printed forecast of Fig. 4d.

Maps for the 2010 Eyjafjallajökull cloud and no-fly zone location given in a The Times on 16 April 2010 (© The Times 16 Apr 2010), b The Times on 19 April 2010 (© The Times 19 Apr 2010), and c The Mail Online 17 May 2010. This final map was published during the second period of air space closure in May 2010. Note how, in c the forecast, attributed to the Met. Office, is termed a “prediction” and has the title “where the cloud will go”, thus conveying an element of certainty in the forecast. In a we have “how the ash cloud spread”
Uncertain, inaccurate, or vague?
Within such a popular definition, error may connote inaccurate (Morris and Peng 1994) rather than uncertain. Following a national questionnaire survey of US National Weather service forecasters, Murphy and Winkler (1974) found that,
the fact the forecasters perceive some confusion on the part of the public with regards to (the forecast) … … … suggests that some confusion undoubtedly exists among members of the general public.
There are other unfortunate disconnects in the popular perception of words used in the uncertainty cascade. For example, colloquial word associations with the word “ignorance” include “bewilderment”, “blindness”, “dumbness”, “empty-headedness”, “lack of education”, “mental incapacity”, “unscholarliness”, and “vagueness” (Kipfer 1993). In addition, the word “ambiguity” can be associated with vagueness, doubtfulness, and dubiousness (Kipfer 1993), which may result in the scientific communication of ignorance and ambiguity not being received as intended. Miles and Frewer (2003) highlight this disconnect. Encouragingly, they found that people responded uniformly to different types of uncertainty. However, under circumstances where people feel they have little personal control over their exposure to a particular hazard, and when institutions that are perceived to be in control of protecting the public from the hazard indicate that there is uncertainty associated with risk estimates, the hazard may appear to be ‘out of control’ (Miles and Frewer 2003).
Sources of confusion in forecast interpretation by a newspaper readership can be related to disconnect between the delivery of a forecast that contains uncertainty and the newspaper need for, and public expectation, of “better facts” and “solid risk analysis” (The Sun, 20 April 2010, p. 19). How many times do we look in the newspaper on Wednesday and see sunny weather forecast for Saturday; and then are disappointed when it rains all weekend?
The newspaper need for fact
News stories require six facts (Gregory and Miller 1998; Harcup 2009): (i) who, (ii) what, (iii) where, (iv) when, (v) why, and (vi) how. The journalistic need-for-fact problem is inherent in the following lines that appeared on the front page of The Daily Telegraph on 20 April 2010,
The government agency (the Met Office) was accused of using a scientific model based on ‘probability’ rather than fact to forecast the spread of the volcanic ash cloud that made Europe a no-fly zone and ruined the plans of more than 2.5 million travellers in and out of Britain.
Burgess (2011) backs this view up by concluding that the media failed “to engage with, let alone explain, the uncertainty at the heart” of the problem in hand, remaining “firmly wedded to making a story from conflict and certainty.” During the Eyjafjallajökull eruption, clarification was thus required as to what, scientifically, was meant by “understanding of facts” (The Sun, 20 April 2010, p. 19), while emphasizing that there was no clear “boundary somewhere between clear skies and cloud” (Macrae 2011). In this regard, although Macrae (2011) argued that “this graduated approach was adopted”, it was never really adopted by, or successfully delivered to, the newspaper (see Fig. 4).
The disconnect
The gulf between forecaster and popular expectations of uncertainty is summed up by the following statement that appeared on page 2 of The Daily Telegraph on 20 April 2010,
Air traffic authorities should not have relied on a single source of scientific evidence … … … (it is based on) a mathematical model that runs on mathematical projections. It is probability rather than actual things happening.
Walker and Marchau (2003) pointed out that the fact that uncertainties exist in practically all policy making situations is generally understood by policy makers. However, they argued that there is “little appreciation for the fact that there are many different types of uncertainty, and there is a lack of understanding about their relative magnitudes and the different tools that are appropriate to use for dealing with the different (uncertainty) types.” As Walker and Marchau (2003) stated, “most uncertainties cannot be eliminated; but they must be accepted, understood, and managed.”
Spiegelhalter and Riesch (2011) argued that, when working with policy makers and policy communicators, “it is important to avoid the attrition of uncertainty in the face of an inappropriate demand for certainty.” However, our problem is the way this uncertainty is then framed and communicated by the press, to then be received, interpreted, and used by other actors in the chain. The scientific forecast process offers a powerful suite of methods to assess environmental risk. However, following the argument of Stirling (2007), precise “black and white” projections are not applicable under conditions of uncertainty, ambiguity, and ignorance, so that expectation of provision of an idealistic, error-free, science-based forecast is “irrational, unscientific and potentially misleading”. Thus, Marchau and Walker (2003) argue that, when large uncertainties exist, a flexible or adaptive policy needs to be adopted that “takes some actions right away and creates a framework for future actions that allow for adaptations over time” as knowledge accumulates and critical events take place. This view is supported by Harremoës (2003) who argued that,
uncertainty has to be accounted for in order to prevent surprises. In cases of recognized ignorance, solutions have to be flexible and robust, especially in situations involving irreversibility of the consequences of the decision. When recognizing uncertainty and ignorance, the empirical iterative approach has its virtue as adaptive management.
It is possible that the “real options” approach proposed by de Neufville (2003) may help with such an adaptive and flexible approach to forecasting whereby the response system is consciously designed so that it can easily change from one input to another or from one product to another.
Same language, different language
Disconnects between scientists and media were documented by Peterson (1988) who tabulated the main sources of friction between scientists and journalists during the 1980 eruption of Mount Saint Helens. While the table revealed that scientists complained that “we get misquoted in news stories” and that “reporters are too poorly prepared; they know nothing about the subject”; journalists commented that “scientists talk in jargon that no one else can understand” and that “scientists expect us to be experts in their subject.” Peterson (1988) also pointed out that journalists found that
scientists are too long-winded; they talk all around the subject and never get to the point; they do not understand that we need to use straightforward, simple statements; we have to convert the complicated discourses to words that people can read.
As argued above, we may also be using two different languages. Thirty-five years later, the language disconnects between scientists and the public seems in no way resolved. One source of confusion lies in the different words used by different groups to convey, or define, forecast and uncertainty. In examining public understanding of forecasts in rural areas of Brazil, Pennesi (2007) concluded that,
forecasts should be presented in the language commonly used by the target audience, but with attention given to potential conceptual differences between scientific and lay audiences.
But, Pennesi (2007) also warned that “good communication does not necessarily lead to use of the information in the way the forecaster intended.” These conclusions were echoed by Demuth et al. (2012) who quoted one member of the media as explaining,
sometimes scientists speak like scientists and not like people … … … you know, some people don’t know what low pressure means, what high pressure means, and some people don’t know and don’t care what millibars are.
Stocking (1999) argued that the problem is compounded by the variety of expressions used to communicate uncertainty to the scientific journalist, including variation in usage of:
-
Words and phrases.
-
Caveats specifying limits to the knowledge at hand.
-
Simple ascertains or claims that knowledge is preliminary or uncertain.
She concluded that we need to systematically examine the content of both scientific and public discourse to see how various actors characterize uncertainty and how they perceive and act on such characterizations.
How best to communicate uncertainty in forecasts?
Hopkins (2010) argued that,
platitudes and generalities roll off the human understanding like water from a duck. They leave no impression whatever. To say, ‘Best in the world,’ ‘Lowest prices in existence,’ etc., are at best simply claiming the expected. But superlatives of that sort are usually damaging. They suggest looseness of expression, a tendency to exaggerate, a careless truth. They lead readers to discount all the statements that you make.
Instead,
a definite statement is usually accepted. Actual figures are generally not discounted.
So that,
A dealer may say, ‘Our prices have been reduced’ without creating a marked impression. But when he says, ‘Our prices have been reduced 25%’ he gets full value of his announcement.
Hopkins (2010) concludes,
No generality has any weight whatever. It is like saying, ‘How do you do?’ when you have no intention of inquiring about one’s health. But specific claims when made in print are taken at their value.
In other words, plainly worded value terms have the greatest impact.
Forecast terminology: semantic
Qualitative uncertainty descriptors for uncertainty that appeared in the review by Politi et al. (2007) included “substantial”, “moderate”, “poor”, “zero/negative”, “good”, “fair” and “poor.” The words “unlikely”, “possible”, “almost certain” and “rare”, with modifiers such as “very”, “somewhat”, “equally” and “very” being those appearing in the review of health risk communication formats by Lipkus (2007). Based on such studies, Gill (2008) argued that an effective way to convey uncertainty was to use objective numerical measures (such as probabilities) coupled with “plain language that is clearly defined.” The use of such qualitative statements of uncertainty has a number of advantages. Politi et al. (2007) argued that,
words such as ‘highly uncertain’ have the advantage that people think they understand what is being said … … … use of numbers to depict uncertainty and ambiguity potentially allows for more precision and avoids variable interpretation.
There are other advantages to probabilistic statements. For example, because no probabilistic forecast can be wrong, we will always be right (Ayton 1988). But, some degree of coherence between numerical and verbal association of probability needs to be defined and made widely known to both scientists, decision-makers, the media and the public.
Differences between word usage for uncertainty terms between scientists and the public will occur (Table 2). When testing the meanings of probability phrases between individuals Dhami and Wallsten (2005) found that “individual differences in linguistic probabilities may simply be explained by the phrases people use at each rank.” As Karelitz and Budescu (2004) pointed out, “when forecasters and decision-makers describe uncertain events using verbal probability terms there is a risk of miscommunication because people use different probability phrases and interpret them in different ways.” There are, in fact, considerable differences between actors in the relative meaning of qualitative descriptions of value terms such as “a good chance”, “a fair chance”, “a slight chance”, “probable”, or “doubtful” (Ayton 1988) and the range of probabilities associated with each value term (Table 3). Thus, Lipkus (2007) wrote,
a potential weakness of probability phrases, especially if the goal is to achieve precision in risk estimates, is the high degree of variability in interpretation. A term used by one individual to represent risk may not be interpreted similarly by another, e.g., although some may interpret the term likely as representing 60 %, other people may view it as meaning 80 %.
Doyle et al (2011) cited the work of Brun and Teigen (1988) to illustrate the same disconnects between verbal and numeric communications of uncertainty, writing:
The term ‘likely’ can be translated to a numerical probability of p = 0.67 with a standard deviation of 0.16, and this mean value can change to 0.71 or 0.59 depending on the experimental context. Thus, one person may view ‘likely’ to represent a probability as low as 51 % and another as high as 83 %.
The studies conducted by Doyle et al. (2011) bore this out showing wide ranges in numeric associations with verbal statements of uncertainty, as collated in Table 2. Risbey and Kandlikar (2007) reviewed the Intergovernmental Panel on Climate Change fourth assessment’s (AR4) guidance on representation of uncertainty. For likelihood, that is, a probabilistic assessment of the occurrence of some well-defined outcome, Risbey and Kandlikar (2007) recommended seven terms each of which can be linked to a likelihood of occurrence. These were: virtually certain (>99 % chance); very likely (>90 % chance); likely (>66 % chance); about as likely as not (33–66 % chance); unlikely (>33 % chance); very unlikely (<10 % chance); exceptionally unlikely (<1 % chance). In terms of level of confidence, that is, a measure of the degree of understanding in the expert community, AR4 recommended usage of five terms: very high confidence (9 out of 10 chance of being correct); high confidence (8 out of 10 chance of being correct); medium confidence (5 out of 10 chance of being correct); low confidence (2 out of 10 chance of being correct); very low confidence (1 out of 10 chance of being correct). But, Dhami and Wallsten (2005) found extreme heterogeneity in such linguistic probability terms used by individuals. This finding is supported by tests of Karelitz and Budescu (2004) who gave 18 participants a lexicon of words and semantic operators (modifiers, quantifiers, negators, intensifiers, etc.) and asked for creation of a list of 6–11 phrases that spanned the whole probability range. The result was 71 different phrases. Forty were chosen by only one participant and 28 were shared by two. “Very unlikely” was chosen five times and then, a long way ahead, was “certain”, “even odds” and “impossible”. Each of these phrases was chosen 18 times. These results indicate consensus only for phrases to be used to describe the ends, and the middle, of the quantitative probability scale, with extreme divergence in between. However, in spite of this language heterogeneity, Dhami and Wallsten (2005) found that there was agreement between phrase meaning and the associated numeric probability associated with that phrase between people.
Rowe and Wright (2001) argued that there is currently not enough information to draw any conclusions as to whether, and how, experts view risk judgments and their quality differently from members of the general public. Thus, following experiments which indicated that interpretation of non-numerical probability or frequency expressions generally depended on perceived base rate, or perceived prior probability, Wallsten et al. (1986a) argued in favor of creating a “base line” mentality of the event being described. This would involve training audiences in the interpretation of uncertainty syntax and the exact quantitative meaning of each qualitative phrase, so that the recipient knows that “a 75 % chance of ash in the air” means that ash presence is “likely”, but we cannot be sure. Forecasts then need to be delivered and explained in a format and language that the host audience will correctly understand. In this regard, Windschitl and Weber (1999) argued that interpretation of a probabilistic statement depends on the context within which they are presented:
imagine a doctor who informs the patient that there is a 70 % chance of a full recovery from a knee surgery. Although the patient may accept that numeric probability as an appropriate forecast, the doctor might have also communicated information that could affect the patient’s more associatively based thoughts and feelings about the possibility of recovery. If the doctor mentioned positive reasons for why there is a 70 % chance of a full recovery, the patient might have a greater feeling of optimism about the surgery than if the doctor mentioned negative reasons for the 70 % estimate.
The experiments of Teigen and Brun (1999) revealed that individuals who had their chances of achieving successful outcomes communicated in positive terms made different decisions compared with individuals who received equivalent but negatively formulated phrases. Teigen and Brun (1999) also found that negative phrases led to fewer conjunction errors in probabilistic reasoning than did positive phrases. They found that expressions such as “occasionally” resulted in a positive reaction, it being a word that points to the fact that the target event could indeed happen from time to time. Instead, negative expressions such as “seldom” and “rarely” suggests that the target event occurred less frequently than might have been expected. Thus, Teigen and Brun (1999) concluded that “verbal probabilistic phrases differ from numerical probabilities not primarily by being more “vague” but by also suggesting more clearly the kind of inferences that should be drawn.” In essence, further and appropriately worded information must be provided to allow the audience to understand the quantitative and/or qualitative assessment of the “chance” that something may, or may not, happen. Ambiguity must thus be minimized. To aid with this, we can begin to categorize words that should, and should not, be used in the delivery of forecasts and uncertainty (e.g., Table 4).
Forecast terminology: numeric
Means of expressing weather forecast uncertainty in terms of probabilities or odds have been under development for at least 200 years (Murphy 1998). Adoption of probabilistic forecasting approaches was supported by the surveys of Morss et al. (2008) who showed that “a significant majority of respondents” preferred uncertainty forecasts as opposed to deterministic (black or white) forecasts. According to Morgan et al. (2009), when trying to communicate uncertainty to non-technical audiences, “the real issue is to frame things in familiar and understandable terms.” Granger Morgan (2003) argued that,
the standard way to describe uncertainty is with a probability density function or its integral, the cumulative distribution function. This can be done using a frequentist approach when adequate data are available … … … More typically, data are incomplete, and it is necessary to seek the considered judgment of experts using a subjectivist approach in which probability distributions become statements of ‘degree of belief’.
Other studies have found there to be less confusion in forecast uncertainty among the audience when just a quantitative statement is given, such as “there is a 70 % chance of …” (Ayton 1988; Joslyn et al. 2007). Joslyn and Nichols (2009) showed that recipients better understood wind forecasts when they were presented in probability format (i.e., 90 %) rather than frequency format (i.e., nine times out of ten). Joslyn and Nichols (2009) suggested that the frequency expression of uncertainty was difficult for people to understand, arguing that “perhaps when participants are given a frequency expression it … … … requires a specific explanation to make sense, otherwise, people may be left wondering: 1 in 10 what?” Le Blancq (2012) further developed the notion of delivery of uncertainty using well-known quantities arguing that,
perhaps the problem lies with using the word ‘uncertainty’ … … … would ‘risk’ be more appropriate for the general user, or ‘odds’ as in the betting world and more generally understood by the public?
Morss et al. (2008) also found that “respondents liked forecasts that included a concise explanation of the weather situation creating the forecast uncertainty.” Murphy et al. (1980) found that probabilistic forecasts were well understood and preferred, but that ambiguity in the definition of the event to which the probabilities related was a frequent source of confusion.
Problems with the numeric format
The difficulty of providing value statements of uncertainty when delivering a forecast is apparent in a quote appearing in a La Montagne article reviewing Météo-France weather forecasting operations at the Aulnat (Clermont Ferrand) bureau. The quote, from the bureau director, read (La Montagne, 2 May 2014, p. 9),
To give you an idea, he (the forecaster) must not be wrong in predicting 30 mm of water (rain) in the Sancy, but he will not be able to say whether it will be as much as 50 on one side or as little as 10 on the other.
Bruine de Bruin et al. (2000) found that respondents more frequently assigned a 50 % chance to events with lower perceived control, so that assignment of “50” was used as an “escape” strategy in order to avoid contemplating negative and uncontrollable events. Bruine de Bruin et al. (2000) concluded that “phrasing probability questions in a distributional format (asking about risks as a percentage in a population) rather than in a singular format (asking about risks to an individual) reduced the use of 50.” In addition, Kunreuther (1992) pointed out that while motorists often exhibit an optimism bias by taking the attitude “it can’t happen to me”, individuals also ignore low-probability events by assuming that they are below a threshold worth worrying about. To avoid such escapism, the nature of the hazard also needs to be well stated and concisely explained in a language that is accessible by the audience, a contention supported by Morgan et al. (2009). On the basis of their studies, Morgan et al. (2009) provided the following advice,
-
1.
Use of odds and probabilities can work, if they are used consistently across many presentations;
-
2.
If you want people to understand one fact, in isolation, present the result both in terms of odds and probabilities;
-
3.
In many cases, there is probably more confusion about what is meant by the specific events being discussed than about the numbers attached to them.
All of these studies were completed in the USA where audiences are more used to quantitative and probabilistic forecasts. When comparing responses among pedestrians in Amsterdam, Athens, Berlin, Milan, and New York, Gigerenzer et al. (2005) found that only in New York could the audience provide the true meteorological interpretation of “there is a 30 % chance of rain tomorrow.” Such unfamiliarity with quantitative forecasts in Europe was supported by the findings of Rowe et al. (2000) who, in examining newspaper reporting of hazards in UK and Sweden, found that “reports about hazards tended to be alarmist rather than reassuring and rarely used statistics to express degrees of risk.” This problem seems to be at the root of the results of experiments carried out by Joslyn et al. (2009) whereby students read sentences expressing the likelihood that wind speeds or temperatures would cross a given threshold. Participants were asked to rate the likelihood of the event on an unmarked linear analogue scale and then decide whether to post a warning based on the information in the sentence. Findings revealed a mismatch between the uncertainty phrase and the relevant numeric threshold. Summing up, Joslyn et al. (2009) suggested that participants may have posted too many advisories in the low wind situation because they were unsure that they understood the uncertainty phrase and decided to err on the side of caution.
In the medical community, probabilities frequently have to be used when communicating health problems between the practitioner and the patient where, again, the problem can be expressed numerically, verbally or both. Take Spiegelhalter’s (2008) example,
Is my 8 % risk epistemological (i.e., it is essentially already decided whether I am going to have a stroke, I just don’t know the answer), or aleatory (the situation is analogous to drawing an ace from a pack of cards)?
The situation in medicine is usually different to a cloud forecast because the practitioner is typically in a one-on-one situation with the recipient, allowing extended and detailed explanation, discussion, clarification, and question-and-answer. But there are still some useful conclusions that can apply to delivery of a forecast. Spiegelhalter (2008), for example, concluded:
It should be no wonder that clear recommendations for risk communication are not forthcoming, as every representation carries its own connotations and biases that may vary according to the individual’s perspective concerning the way the world works. A consequence is that the message can be varied to maximize the impact on behavior. My personal feeling is to acknowledge there is no correct answer and pursue multiple representations, telling multiple stories, each with their own capacity to influence. The aim should be to communicate what are reasonable betting odds for this individual, using current available knowledge, and possibly making appropriate analogies with games of chance.
Application of prospect theory and the problem of adjustment
A forecast model based on prospect theory involves (Tversky and Kahneman 1992)
-
(1)
Value functions are concave for gains and convex for losses;
-
(2)
The function is steeper for losses than for gains, and
-
(3)
There is a nonlinear probability scale which exaggerates small probabilities and underweights moderate and high probabilities. This is because, there is a temptation to dismiss numbers close to zero are as representing no risk (Lipkus 2007).
In support of such a forecast delivery approach, Tversky and Kahneman (1992) gave two arguments. First, the outcome of a risky prospect is NOT linear in respect to outcome probabilities. Allais (1953), for example, showed that “the difference between probabilities of 0.99 and 1.00 has more impact on preferences than the difference between 0.10 and 0.11.” Second, willingness to bet on an uncertain event depends not only on the degree of uncertainty but also on its source. Ellsberg (1961), for example, observed that people preferred “to bet on an urn containing equal numbers of red and green balls, rather than on an urn that contained red and green balls in unknown proportions.”
Adjustment and anchoring
Tversky and Kahneman (1974) highlighted the issue of adjustment. In many situations people may make estimates by starting from an initial value that is then adjusted to yield a final answer. This a problem which applies to perceptions of numeric probability when the value is poorly known or imprecisely defined upon first communication. Different starting points will yield different recipient estimates that are biased toward the initial value received. This is anchoring. Tversky and Kahneman (1974) demonstrated this effect by showing a sample group a number between 0 and 100. The subject was then asked to estimate the percentage of African countries in the United Nations. The numbers shown to the subject before the question had a marked effect on resulting estimates, the median estimates being 25 % for those who had ten as a starting point and 65 % for those who had 45 as the starting point. Thus, if the initial value of uncertainty is set too high a readership can be anchored to a preference to over-estimate probability. If set too low, an underestimate may occur. Care thus needs to be taken when communicating the first, or initial, uncertainty statement.
Terminology: linking syntax, numeric probability, and prospect theory
The challenge is to align syntax, numeric probability, and perceived probability so as to attain an understanding of uncertainty among the audience tallies with that delivered by the forecaster. In the light of all of the above evidence I have tried, in Table 5, to express uncertainty in a system whereby: (1) there is a chance that the forecast is wrong, (2) more thought is put into the syntax of statements at the higher end of the probability scale, while stressing that “chance” still means not impossible, and (3) phrases are constructed in a language that is accessible to the recipient.
Colors, pictures, and uncertainty
Imagery plays a powerful framing role. In a study by Smith and Joffe (2012), 56 members of a London-based 2008 public were asked to draw or write four spontaneous first feelings about global warming. Results mirrored images used by the British press to depict global warming visually, focusing on ice melting. Imagery can also influence the picture of the forecast and uncertainty creator. For example, Christidou and Kouvatas (2011) analyzed 971 photos of Greek scientists appearing in the relevant institutions’ website. They found that Greek scientists tend to be depicted wearing glasses and surrounded by knowledge symbols, concluding that “Greek scientists still have much improvement to do in their popular self-images and the images of the disciplines they promote to the public in order to counterbalance the overwhelmingly stereotypic and conservative popular image of science” (Christidou and Kouvatas 2011). In terms of delivering the forecast and uncertainty product visually Le Blancq (2012) argued in favor of using appropriate, natural, actually-observed colors for meteorological clouds on forecast maps. In criticizing the weather forecasts televised by BBC news, Le Blancq (2012) wrote,
clouds, white or shades of grey on satellite images, are cowpat brown on land … … … on leaving the coast clouds—I think they are clouds—turn dark blue, a color that depicts deep water in an atlas.
A similar problem was found when depicting the spread of the 1987 radioactivity cloud from Chernobyl. When Naples school children were asked to draw a radioactive cloud a few days after the event, it was invariably colored gray or pink, pink being the color used to track the spread of the cloud using cartoon maps on Italian television news (Galli and Nigro 1987). In the case of a distal volcanic cloud, which may be an extremely dilute mixture of particles, aerosols and gas, use of nuances of blue would be better in designing maps intended to forecast cloud extent, as opposed to the red or gray colors used by all newspapers during Eyjafjallajökull’s eruption (Harris et al. 2012).
Pictures, schematics, and maps are eye-catching and evocative ways to deliver a frame, usually being the first item to which the eye is drawn (e.g., Fig. 4). It is interesting to compare the newspaper-printed maps of cloud extent during Eyjafjallajökull with those actually issued by the London Volcanic Ash Advisory Centre (VAAC), as based at the Met. Office in Exeter (UK). A selection of these are given in Fig. 5. During the Eyjafjallajökull eruption, the London VAAC issued four forecasts per day. On 19 April, these were posted on http://www.metoffice.gov.uk/aviation/vaac/vaacuk_vag.html at 00:52 (for the 00:00 update), 06:37 (for the 06:00 update), 12:33 (for the 12:00 update), and 18:28 (for the 18:00 update). Updated every 6 h, the maps showed the likely extent of the cloud in four 6 h steps throughout each day. Forecasts were made for three flight levels, using red, green, and blue boundaries with no fill (Fig. 5). Compare these with those appearing in the press as given in Fig. 4, in which the flight level advisory zones forecast by the VAAC have been turned into areas of “ash cloud” and “no-fly zone”. There are also discrepancies between the limits of zones marked on the newspaper maps and those provided by the London VAAC (c.f. Figs. 4 and 5).

Forecasts for cloud location at three flight levels on a 15–16 April, b 16 April, c 19 April and d 17 May 2010 (as downloaded from the London Volcanic Ash Advisory (VAAC)—“issued graphics site”: http://www.metoffice.gov.uk/aviation/vaac/vaacuk_vag.html). These are the VAAC equivalents of the maps published in the newspapers of Fig. 4 and are given to allow comparison (note—no fill to the boundaries is used)
Pictorial reporting of an event in the newspaper, when placed with negatively worded captions, can be used as a powerful and evocative means to frame an event against the forecaster; or to even change the meaning and intent of an advisory so as to create stigma (Ferreira et al. 2001). Thus, much care needs to be put into this element of forecast delivery. But, the potential that the newspaper may then change, for example, the interpretative legend, colors and limits of the delivered cloud forecast map, needs also to be borne in mind.
An aggressive, reactive solution?
During the Eyjafjallajökull eruption, the day after a page 11 headline reading,
We won’t pay compensation, Ryanair boss says,
appeared in The Daily Telegraph (22 April 2010), Ryan Air placed a full-page advert on page 9 of the same newspaper (The Daily Telegraph, 23 April 2010) reading:
THE DUST HAS SETTLED…
EXPLOSIVE RYANAIR SALE
3 MILLION SEATS
£3 ONE WAY
BOOK TIL MIDNIGHT MONDAY
TRAVEL MAY–JUNE
On the following page, the reader was presented with the headline (The Daily Telegraph, 23 April 2010, p. 10), “Ash cloud passengers face delay in claiming back costs.” On 24 April 2010, a quarter of the back page of The Daily Telegraph was devoted to a Brittany Ferries advert with the title,
Spain without the plane (cruise overnight from Portsmouth with your car).
It is of note here that many British travelers became stuck in Spain, some being brought back by the Royal Navy and cruise ships. The advert also appeared just before the travel supplement which had a front page photo montage including a tired boy slumped over a bag on an airport floor, a bored lady leaning over her baggage trolley, and a picture of the plume rising above Eyjafjallajökull.
Possibly, the first company to place an appropriately placed advert during the Eyjafjallajökull eruption was East Coast rail (UK). On 20 April 2010 they placed a quarter page advert on page 3 of The Daily Telegraph. Facing a page of Eyjafjallajökull-related news and entitled “Until the dust settles,” the advert read:
At this difficult time for travellers, we’re doing our best to lift the cloud. We’ve added more trains and increased capacity on our existing services. And as always we’re offering fully refundable, flexible fares to give you even more peace of mind when travelling.
The last sentence plays well on the frame of the compensation row and financial loss among passengers that developed during the air space closure (see Part 1 of this review).
This is a classic market research and advertising approach (e.g., Hopkins 2010; Sissors and Baron 2010; Sylvian 2011); but could it be of use to the misrepresented scientist? Such a reactive response would follow the basic rules of market research and advertising, and would involve:
-
1.
Tracking the press to identify any negative or damaging frames, to then
-
2.
Deliver an appropriately headlined, worded, timed and targeted press release that responds to, or uses, any developing frame.
-
3.
Lobbying is then required to ensure that the release is placed in the appropriate section of the appropriate newspaper, this being the newspaper that had generated the frame on the previous day.
-
4.
Finally, the statement needs to be placed in an appropriate page position within a newspaper with the desired coverage and audience (Sissors and Baron 2010), and next to news to which the target audience will be drawn.
In regard to the last point, placement depends on the best page location deemed necessary to obtain maximum impact and to reach the readership profile with which we wish to communicate. The question is thus, do we need to read the statement after, during, or before the report to which our target audience is drawn? What, for example, would industrial and commercial stakeholders have done in response to the headline (The Daily Telegraph, 20 April 2010, p. 1) “Met Office got it wrong over ban on flights”? The Ryanair advert was preemptive, appearing before a negative headline, but in response to an extremely damaging headline of the previous day. Placement of the Brittany Ferries advert used all of the bad press generated in regards to air travel in all precedent reports within the newspaper to maximize the impact of their back page argument to travel by boat. Finally, appearing at the top of the front page of La Montagne (24 August 2014), next to a front page flag to an internal report entitled “air traffic forbidden above an Icelandic volcano (Bárðarbunga)”, was an advert for Vulcania. This is volcano theme park, located in the French Chaîne des Puys, thus placed their advert at the same time and page location as the relevant report to reach the relevant readership.
Preparation and timing of the response statement
Perception that there is no adequate emergency response plan has an extremely powerful impact in decreasing trust (Slovic 2001). Thus, Viehrig (2008) recommended preparation of statements in, and responses to, media content before the event or emergency takes place. However, Viehrig (2008) warned,
There is no such thing as a secure ‘media strategy’. An emergency means that things are out of control, whereas a ‘strategy’ suggests that an institution can maintain control of events.
In this regard, Viehrig (2008) stressed that media operations should be prepared in “good” times, i.e., before the event occurs. Viehrig (2008) also recommended training all members of an organization, not just a single spokesperson, in delivering such information, so that all are able to reply and deliver the same information in the same way. Such a “one voice” advocacy is generally recognized as being the best medium of communication during a volcanic crisis (Fiske 1984; Peterson 1988; Tilling and Punongbayan 1989; IAVCEI 1999).
In cases where framing goes against the forecaster, carefully worded press releases and/or press conferences should be implemented as part of the follow-up when damage is done by a developing blame frame (see Part 1 of this review). Fast and Tiedens (2010) suggested that a blame contagion could be moderated by self-affirmation—that is, implementation of actions that protect the image of the actors in terms of morality and adequacy. This may involve issuing of appropriately worded press releases or holding of press conferences to respond to a developing blame frame (e.g., Houghton 1988). In terms of negative political advertising, Sonner (1998) found that negative advertisements generated a backlash against the sponsor when the target of the attack responded quickly and forcefully, but were very successful when the target did not respond. The success of the Met. Office Press conference after the Great Storm of 1987 has already been described. Such a response has since been condoned by the Better Regulation Commission (Cabinet Office, London). During the outbreak of avian flu in the UK the Better Regulation Commission (2006) noted how various scientific stakeholders held a series of meetings with the editors of national newspapers “to inform a reasonably calm approach to the issue of avian flu”, adding that “we need to see many more successful initiatives like these.” In the context of a more reactive stance, the statement from the rail customer watchdog during the St. Jude storm is one that should have been delivered during the Eyjafjallajökull eruption. It is one that deserves repetition:
It’s too early to tell if the industry made the right call when cancelling so many services, but the fact that major incidents have been avoided is good news.
Manheim (1994), however, warns that such an approach should be implemented carefully, distinguishing two dimensions of media coverage: visibility and valence. Both of which should be applied. If an actor faces high visibility coupled with negative reporting, the actor should not immediately “spin” the media coverage into positive reporting. That might well be perceived as propaganda and rejected by the public. Instead, Manheim (1994) recommended lowering media visibility of the actor, so as to remove the actor from the focus of attention. Once the point of low visibility is reached, then positive messages should be sent out which attempt to elevate positive media visibility little by little (Viehrig 2008).
Take the following example. On 15 February 2014 Ouest France reported that 100,000 households were without electricity due to the passage of a storm (named Ulla). By 17 February, 30,000 households were still affected and a picture appeared on page 5 showing teams from the French electricity company (EDF) repairing electricity lines. On 20 February an advert was placed, of the same size and page position as the 17 February report, by a Brittany-based electric generator company. Set against a picture of huge waves crashing against the sea front of a Breton village, similar to those images that had appeared in the 15 February issue, the advert read: “You can do nothing against the weather. But you can protect yourself in case of an Electricity failure”.
Communications with the media during emergencies
Johnson and Jeunemaitre (2011) concluded that, during the Eyjafjallajökull eruption, “scientific uncertainty, opaque decision-making process and poor communication mechanisms impaired a coordinated response”, to result in undermining of “public and political confidence in the decision to close many European airspace.” Thus, my focus here has been on how best to achieve clear(er) communication of forecast and uncertainty between scientists and journalists. All observations collated next are based on both parts of this review, but many have already been stated in a number of key texts that provide recommendations regarding communication during crises:
-
1.
Recognize that words and phrases may be changed and rephrased, even fabricated. We need to use appropriate language that “help the media to understand the message” (Bonfils and Bosi 2012) and which allow minimal scope for misinterpretation or misrepresentation.
-
2.
Avoid jargon and overly technical terms. Instead, we need to use straightforward and simply worded statements that can be understood by the journalist and newspaper readership (Peterson 1988; De la Cruz-Reyna and Tilling 2008).
-
3.
Remember that the journalist is not an expert in the subject (Peterson 1988).
-
4.
Be familiar with, and sensitive to the needs, methods and time limits of the journalist, as well as the work pressure the reporter is under (see Part 1 of this review).
-
5.
Understand that maps and schematics will be redrawn, recolored, and dumbed down.
-
6.
Percent-based probability statements seem preferable to odds or frequency based statements.
-
7.
Do not just give a probabilistic statement but also explain the reasons behind the conclusion reached, and the nature and potential impact of the event to which the probability and forecast relates. We need to explain the concept of probability and uncertainty, because forecasting “always includes probabilities” (Bonfils and Bosi 2012), and to avoid giving “magic numbers” (Ruckelshaus 1984).
-
8.
Track the press for developing frames against the forecast and its uncertainty.
-
9.
Track the press for opportunities to support the forecast: The 21 April 2010 ash cloud encounter by a commercial aircraft as reported in The Sun would have been a perfect opportunity for such affirmative action.
-
10.
Time, target, and place the press release appropriately. Press office-led packages, conferences, and releases can also be organized when appropriate or even made on a daily basis during a rapidly evolving crisis. Release can also be timed opportunistically to attain maximum effect.
-
11.
Identify problematic issues raised by business and political interests, as well as “scientists from other fields”, “volcanologists working in isolation, either on-site or far from the volcano in question” and “pseudo-scientists” (IAVCEI 1999).
-
12.
Exaggeration and false, but more spectacular-than-reality pictures and descriptions, may be used to illustrate the event to result in increased readership stress (Cardona 1997). These should be identified and responded to.
-
13.
Avoid sloppy argument, off-the-cuff comments and casual errors (Aspinall 2011), as well as "off-the-record" remarks (see Part 1 of this review).
-
14.
Avoid exaggerated statements or overly reassuring statements about safety when significant risk exists (IAVCEI 1999).
-
15.
Make a record, written or recorded, of the information provided (Aspinall 2011).
-
16.
Provide evidence in writing that remains within your domain of expertise (Tilling and Punongbayan 1989) while “citing evidence that is robust under peer review and law” (Aspinall 2011)
-
17.
Avoid emphasis on the part of the story that is the specialty of the interviewee (Fiske 1984).
-
18.
Do not refuse to work with the news media or hesitate to release “worrisome information” (IAVCEI 1999); cooperate and tell the “whole story” (Peterson 1988). Never hide information, and if information is not available explain why this is the case and when it may be available (Bonfils and Bosi 2012), and if it cannot be obtained—explain why not. As Cardona (1997) pointed out, situations can be created by silence from those responsible for tracking the volcanic event, which can result in “doubt and speculation that something has been hidden from the population.”
-
19.
Establish a permanent and collaborative agreement with the media. This may involve, for example, regular updates as to the activity and operational aspects (Bonfils and Bosi 2012).
-
20.
Share and discuss communication strategy with the entire group (Bonfils and Bosi 2012), so that if any member is contacted they speak with the same voice. Use a single voice for all media statements that gives a simple, consistent, agreed, and pre-prepared message (Fiske 1984; Peterson 1988; Tilling and Punongbayan 1989; IAVCEI 1999).
-
21.
Do not allow journalists to attend meetings or field trips which involve free scientific discussion, debate, and disagreement among those charged with the forecast (Fiske 1984). Instead, give journalists well-prepared press briefs, presentations and demonstrations, and let them know that these will be delivered well before their “to press” deadline. Public conflict makes for a good news story ... ... ... from the perspective of the jounalist.
For the aftermath of the 1976 Guadeloupe debacle, the final point is particularly pertinent. Fiske (1984) pointed out that there was no harm in debate between those responsible for monitoring and forecasting Guadeloupe’s volcanic activity, but when communication between the conflicting groups broke down they offered differing opinions to the press so that disjointed, conflicting, and negatively framed media coverage resulted. Such heated debate and argument among scientists engaged in tracking ongoing crisis is great news … … … for the press. In terms of the “one voice” approach, Bertolaso et al. (2009) sums up well in terms of the Italian Department of Civil Protection (CDP) response to Stromboli’s 2007 eruption crisis:
Civil protection information was delivered with a single “official voice” coordinated by CDP. Following well-established protocol, TV interviews were first officially requested and then authorized by the DPCs “Press Office” which also coordinated the content related to civil protection and DPC personnel. During the interviews simple and unequivocal terminology was used to reduce misunderstanding, especially in the sense of exaggerating scenarios, which unnecessarily raise anxiety in the local population.
Peterson (1988) added, “when a crisis reaches major proportions, an information scientist should be designated to interact with the news media with the full concurrence of the chief scientist” and the group as a whole. In terms of risk communication in general, Fischhoff (1995) sums up stating “all of the following” should be borne in mind:
-
(a)
Get the numbers right;
-
(b)
Tell the public the numbers;
-
(c)
Explain what we mean by the numbers;
-
(d)
Show that the public has accepted (and experienced) similar risks in the past;
-
(e)
Show the public that it is a “good deal” for them;
-
(f)
“Treat them nice”;
-
(g)
Make them partners.
A note on education
As Peterson and Tilling (1993) pointed out, “scientists can help their cause by preparing general-interest publications, films, videotapes and by giving public lectures on the nature of volcanic hazards.” Bonfils et al. (2012) added that,
scientists, civil protection authorities and more generally authorities responsible for public education, should disseminate the concept of ‘probability/uncertainty’, to make people aware about it.
For response plans, Walker et al. (1999) added that there should be “public consultation and testing of emergency plans.” This further helps with the public education process. Such initiatives help educate the audience so as to improve understanding of the nature of the forecasted event, the basis—and need for—the forecast itself and the underlying uncertainty. Making well-produced, concise, well-illustrated and widely available hand-outs that describe the nature of the hazard in plain words (e.g., Heliker 1992; Johnson et al. 2000), and then referring enquiring parties to them, can only help.
Conclusions
As discussed in Part 1 of this review, media framing is the key problem when communicating forecast and uncertainty for a far-reacing environmental disaster, and there is no failsafe way to communicate such issues through the newspaper. The media and other stakeholders will always have motives that will frame the forecast and its results in the way they need. Although this issue cannot be avoided, it can definitely be anticipated, identified, tracked, understood, and responded to. On paper, the task seems simple. First, quantify the uncertainty in future outcomes. Then, communicate the quantified uncertainties. However, both of these steps entail overcoming significant challenges (Webster 2003). The public ingestion of a forecast can be the net result of a complex, convoluted and opaque process (see Figs. 2 and 3). Thus, ILGRA (2002) pointed out that,
Intuitively, precaution should be easy—the proverbial ‘better safe than sorry’. However, for regulators precaution is often controversial, with no simple answers.
The role of forecast and uncertainty during an emergency is just one small part of the decision-making and communication chain, each step of which is subject to various paradigms and influences. In Fig. 6, I attempt to link together all stakeholders, and the key influences impinging upon each during an environmental emergency. By the time the forecast has been communicated through to the media, it is a long way from that initially put together by the forecaster as part of their formal response duties. Thus, however well the forecast and its uncertainty is delivered, this initial communication will be subject to extreme modification, even complete distortion. Thus, as Donovan et al. (2012b) pointed out, “it is imperative that extensive and clear explanation be given of the scientific reasoning behind a result.” Donovan et al. (2012b) added that experiences on Montserrat and elsewhere have showed that scientific advice is often blamed for the decisions made by political leaders. This added filter makes the language and format in which forecasts and uncertainties are delivered by the scientist extremely important.

Attempt to group and link all stakeholders in the information flow to the newspaper and its readership during an environmental crisis. The key influences impinging upon each stakeholder group is given in capital letters and the main products of each group are given in yellow boxes. Given my focus (forecast communication through the newspaper), the communication flow progresses through the system to the press and then to its readership, by which time the scientific forecast handed on has been modified by several powerful influences, including the press itself
In terms of communication etiquette, bias can be introduced into the delivery of probability through language choice of the deliverer and the actual understanding of the words ingested by the recipient (Patt and Schrag 2003). Word meanings will vary between science, government, business, media and public stakeholders (e.g., Manning 2003) so that the final message may be perceived and interpreted in an entirely different way to which the broadcaster intended. For example, while a student asked in an exam to define conditional probability answered “maybe, maybe not?” (Benson 2011), some stakeholders may expect the answer to be “yes” or “no”, others may interpret the result to favor their preconditioned expectations (Tversky and Kahneman 1974). The language that should be used will thus depend on whether the audience has been trained to work with qualitative or quantitative forecasts (Patt and Schrag 2003), what audience is being reached (Jardine and Hrude 1997), and many other factors, including audience education (Eden 2011). Delivery syntax must thus square the quantitative meaning of uncertainty used by the forecaster with the qualitative syntax recognized and used by the audience. Table 5 is thus intended as a first step toward adopting “formal numerical and verbal probability translation tables that are specific to volcanology,” as called for by Doyle et al. (2011). For each probability case, strict links between numerical and verbal terminology must be defined and kept consistent. Then, to aid with the education problem, the reason for uncertainly must be clearly explained (Morss et al. 2008), as must be the nature of the hazard and measurement problems. We cannot assume that the audience will understand that the forecast is the best that can be made within the limits of our ability to parameterize or model complex natural processes whose physics are poorly constrained and whose properties are inherently difficult to measure. Risbey and Kandlikar (2007) thus concluded that, “one has to defend the choice of level of precision” by “explaining reasoning (behind the choice), outlining assumptions, and evaluating the robustness of the choice.” Statements also need to be correctly timed, and delivered to the appropriate source. During the St. Jude storm, which was well forecasted, rail companies became overwhelmed by line blockages due to tree blow-down. Immediate delivery of a series of preconstructed and appropriated worded warnings and announcements to the media (as well as passengers stranded on platforms) could have avoided a negative frame.
Summation
Statements of uncertainty need to be delivered in such a way that they cannot be used to generate a perception of “confusion” or “ignorance.” The media and the public expect black and white answers. They need “facts.” Errors on quantities that are apparently obvious, such as time and location, are simply not comprehensible. As a letter writer to The Sun on 20 April 2010 pointed out, “facts” and “solid analysis” are expected. Such a popular reaction to uncertainty is implicit in the words of Taylor (1997),
In science, the word error does not carry the usual connotations of the terms mistake or blunder. Error in a scientific measurement means the inevitable uncertainty that attends all measurements. As such, errors are not mistakes; you cannot eliminate them by being very careful. The best you can hope to ensure is that errors are as small as reasonably possible and to have a reliable estimate of how large they are.
By scientific definition, uncertainty implies ignorance. However, dislocation between the scientific and popular views as to what uncertainty, ignorance, and forecasting really are means that descriptions of forecasts must be made with the various definitions of “uncertainty” in mind. Given the skew that these definitions can have on the interpretation and abuse of uncertainty and forecast, it is too easy for a forecast to be framed in a negative way. In Fig. 7a, I have attempted to provide a framework to assess the media-based communication of forecast and response in terms of event magnitude and impact. In Fig. 7b, I have placed each of the events considered here into the framework of Fig. 7a. Of the events considered here, only the St. Jude’s Day storm received a positive newspaper frame in terms of forecast and response, but was one of the smaller events in terms of magnitude and impact.

Precaution in the context of an environmental disaster (after O’Riordan and Cameron 1994). a The left-hand y-axis represents increasing magnitude of impact and geographical extent of the disaster. The right-hand y-axis represents increasing impact of the disaster on society and economic activities. Along the x-axis we have the newspaper frame of the event, which ranges from negative to positive. Placed within this framework is an assessment of (i) the need for forecast, (ii) the need for intervention, and (iii) the need for action from the decision-making system of Fig. 1. b Placement of (i) the impact of each event considered here (red ellipses), (ii) level of response and intervention (orange ellipses), and (iii) the newspaper frame (green bars) for each event within the framework of a. The four events are (i) for the 2010 Eyjafjallajökull eruption (E), (ii) Storm Dirk (D), (iii) the “great storm” of 1987 (87), and (iv) the St. Jude’s Day storm (SJ). Only the St. Jude’s Day storm received a positive newspaper frame, due to the success of the forecast and response. The great storm of 1987 received an extremely negative newspaper frame due to the paucity of the forecast delivery coupled with the extent of the damage; likewise storm Dirk. The Eyjafjallajökull eruption frame was broader, but weighted toward negative (see part 1 of this review)
It is easy for the ignorance associated with uncertainty to result in loss of credibility (Zehr 1999). It is equally easy for uncertainty to become ammunition for counter arguments by stakeholders impacted by fall out from our forecasts. Morgan et al (2009) argued that an environment exists “in which there is high probability that the many statements a scientist makes about uncertainties will immediately be seized upon by advocates in an ongoing public debate.” Ramifications of this environment are profound, and can result in the forecast being viewed as “absurd”, “confused”, “shambolic”, and “dysfunctional” to result in a “frightened”, “frustrated”, and “angry” audience. In delivering uncertainty, we must be careful to frame our ignorance in a positive way that cannot be used to engender a perception that allows the recipient to become “bewildered”, “hesitant”, or “mystified.” Uncertainty may then associate the forecaster with being “on thin ice” or “undecided”, or that science the science behind the forecast is “up in the air” (Princeton Language Institute 1993).
References
Adams MD (2002) The precautionary principle and the rhetoric behind it. J Risk Res 5(4):301–316
Alberico I, Petrosino P, Maglione G, Bruno L, Capaldo FS, Dal Piaz A, Lirer L, Mazzola S (2012) Mapping the vulnerability for evacuation of the Cami Flegrei territorial system in case of a volcanic unrest. Nat Hazards 64:1823–1854
Alcorn R, Panter KS, Gorsevski PC (2013) A GIS-based volcani hazard and risk assessment of eruptions sourced within Valles Caldera, New Mexico. J Volcanol Geotherm Res 267:1–14
Alemanno A (2011a) Introduction. In: Alemanno A (ed) Governing disasters: the challenges of emergency risk regulation. Edward Elgar, Cheltenham, pp xix–xxxiv
Alemanno A (2011b) What happened and lessons: learned: a European and international perspective. In: Alemanno A (ed) Governing disasters: the challenges of emergency risk regulation. Edward Elgar, Cheltenham, pp 3–12
Alemanno A (2011c) Governing disasters: the challenges of emergency risk regulation. Edward Elgar, Cheltenham, p 273
Allais M (1953) Le comportement de I’homme rationel devant le risqué, critique des postulates et axioms de I’ecole americane. Econometrica 21:503–546
Andorno R (2004) The precautionary principle: a new legal standard for a technological age. J Int Bus Law 1:11–19
Arrow KJ, Fisher AC (1974) Environmental preservation, uncertainty, and irreversibility. Q J Econ 88(2):312–319
Arrow KJ, Cropper ML, Eads GC, Hahn RW, Lave LB, Noll RG, Portney PR, Russell M, Schmalensee R, Kerry Smith V, StavinsIs RN (1996) Is there a role for benefit-cost analysis in environmental, health, and safety regulation? Science 272(5259):221–222
Aspinall W (2011) Check your legal position before advising others. Nature 477:251
Ayton P (1988) Perceptions of broadcast weather forecasts. Weather 43(5):193–197
Balzano Q, Sheppard AR (2002) The influence of the precautionary principle on science-based decision-making: questionable applications to risks of radiofrequency fields. J Risk Res 5(4):351–369
Bebbington MS (2013) Assessing probabilistic forecasts of volcanic eruption onsets. Bull Volcanol 75:783–796
Béguier P (2006) Localement vôtre: Le guide du journaliste en presse départementale et régionale. CFPJ Éditions, Paris, 215 p
Behncke B, Neri M, Nagay A (2005) Lava flow hazard at Mount Etna (Italy): new data from a GIS-based study. Geol Soc Am Spec Pap 369:189–208
Benson R (2011) F in exams. Chronicle Books, San Francisco, 124 p
Bertolaso G, De Bernardinis B, Bosi V, Cardaci V, Ciolli S, Colozza R, Cridtiani C, Mangione D, Ricciardi A, Rosi M, Scalzo A, Soddu P (2009) Civil protection preparedness and response to the 2007 eruptive crisis of Stromboli volcano, Italy. J Volcanol Geotherm Res 182:269–277
Besley T, Burgess R (2002) The political economy of government responsiveness: theory and evidence from India. Q J Econ 117(4):1415–1451
Better Regulation Commission (2006) Risk, responsibility and regulation—whose risk is it anyway? Better Regulation Commission, Whitehall, 55 p
Biass S, Frischknecht C, Bonadonna C (2012) A fast GIS-based risk assessment for tephra fallout: the example of Cotopaxi volcano, Ecuador-Part II: vulnerability and risk assessment. Nat Hazards 64:615–639
Bisson M, Behncke B, Fornaciai A, Neri M (2009) LiDAR-based digital terrain analysis of an area exposed to the risk of lava flow invasion: the Zafferana Etnea territory, Mt. Etna (Italy). Nat Hazards 50:321–334
Bonfils L, Bosi V (2012) Means and methods for crisis management. In: Handbook for volcanic risk management. MIAVITA, Orleans, pp 159–171
Bonfils L, Bosi V, Costantini L, Fontaine M, Hidayati S, Le Cozannet G, Sumarti S, Surono, Thierry P, Vaccari P, Vagner A (2012) Living with a volcano: increasing preparedness. In: Handbook for volcanic risk management. MIAVITA, Orleans, pp 91–128
Bonne K, Kervyn M, Cascone L, Njome S, Van Ranst E, Suh E, Ayonghe S, Jacobs P, Ernst G (2008) A new approach to assess long-term lava flow hazard and risk using GIS and low-cost remote sensing: the case of Mount Cameroon, West Africa. Int J Remote Sens 29(22):6539–6564
Brannigan V (2011) Paradigms lost: emergency safety regulation under scientific and technical uncertainty. In: Alemanno A (ed) Governing disasters: the challenges of emergency risk regulation. Edward Elgar, Cheltenham, pp 101–114
Brownbill A (1984) The costs of aircraft accidents in Australia: with preliminary estimates for 1980. Bureau of Air Safety Investigation (Department of Aviation, Australia) Report 83–85. 50 p
Bruine de Bruin W, Fischhoff B, Millstein SG, Halpern-Felsher BL (2000) Verbal and numerical expressions of probability: “it’s a fifty–fifty chance”. Organ Behav Hum Decis Process 81(1):115–131. doi:10.1006/obhd.1999.2868
Brun W, Teigen KH (1988) Verbal probabilities: ambiguous, context-dependent, or both? Organ Behav Hum Decis Process 41:390–404
Burgess A (2011) Representing emergency risks: media, risk and ‘acts of God’ in the volcanic ash cloud. In: Alemanno A (ed) Governing disasters: the challenges of emergency risk regulation. Edward Elgar, Cheltenham, pp 65–79
Burt SD, Mansfield DA (1988) The Great Storm of 15–16 October 1987. Weather 43(3):90–108
Cameron L (2006) Environmental risk management in New Zealand—Is there scope to apply a more generic framework? New Zealand Treasury Policy Perspectives Paper 06/06. 37 p
Cardona OD (1997) Management of the volcanic crises of Galeras volcano: social, economic and institutional aspects. J Volcanol Geotherm Res 77:313–324
Carta S, Figari R, Saroris G, Sassi E, Scandone R (1981) A statistical model for Vesuvius and its volcanological implications. Bull Volcanol 44(2):129–151
Čavka I, Čokorilo O (2012) Cost–benefit assessment of aircraft safety. Int J Traffic Transp Eng 2(4):359–371
Chakraborty S (2011) The challenge of emergency risk communication: lessons learned in trust and risk communication from the volcanic ash crisis. In: Alemanno A (ed) Governing disasters: the challenges of emergency risk regulation. Edward Elgar, Cheltenham, pp 80–97
Charon J-M (2013) La presse quotidienne, 3rd edn. Le Découverte, Paris, 126 p
Christidou V, Kouvatas A (2011) Visual self-images of scientists and science in Greece. Public Underst Sci 22(1):91–109
Chirico G, Favalli M, Papale P, Boschi E, Pareschi MT, Mamou-Mani A (2009) Lava flow hazard at Nyiragongo Volcano, DRC. Bull Volcanol 71:375–387
CIMARPH - Committee on the Institutional Means for Assessment of Risks to Public Health (1983) Risk assessment in the federal government: managing the process. National Research Council, Washington DC, 191 p
Cioni R, Longo A, Macedonio G, Santacroce R, Sbrana A, Sulpizio R, Andronico D (2003) Assessing pyroclastic fall hazard through field data and numerical simulations: example from Vesuvius. J Geophys Res 108(B2):2063. doi:10.1029/2001JB000642
Clow DG (1988) Daniel Defoe’s account of the storm of 1703. Weather 43(3):140–141
COMSET - World Commission on the Ethics of Scientific Knowledge and Technology (2005) The precautionary principle. United Nations Educational, Scientific and Cultural Organization (Paris) SHS-2005/WS/21. 54 p
Cooke WE (1906) Forecasts and verifications in Western Australia. Mon Weather Rev 34:23–24
Cornell SE, Jackson MS (2013) Social science perspectives on natural hazards risk and uncertainty. In: Rougier J, Sparks S, Hill L (eds) Risk and uncertainty assessment for natural hazards. Cambridge University Press, Cambridge, pp 502–547
Corroy L, Roche E (2010) La presse en France depuis 1945. Ellipses, Paris, 144 p
Covey JA (2001) People’s preferences for safety control: why does baseline risk matter? Risk Anal 21(2):331–340
Curran J (2010) Fable of market democracy. In: Curran J, Seaton J (eds) Power without responsibility: press, broadcasting and the internet in Britain, 7th edn. Routledge, London, pp 66–99
Davis DR, Nnaji S (1982) The information needed to evaluate the worth of uncertain information, predictions and forecasts. J Appl Meteorol 21:461–470
Davis MS, Ricci T, Mitchell LM (2005) Perceptions of risk for volcanic hazards at Vesuvio and Etna, Italy. Australas J Disaster Trauma Stud 2005(1):1–20
De la Cruz-Reyna S, Tilling RI (2008) Scientific and public responses to the ongoing volcanic crisis at Popocatépetl Volcano, Mexico: importance of an effective hazards-warning system. J Volcanol Geotherm Res 170:121–134
Demuth JL, Morss RE, Morrow BH, Lazo JK (2012) Creation and communication of hurricane risk information. Bull Am Met Soc 1133–1145. doi:10.1175/BAMS-D-11-00150.1
Dhami MK, Wallsten TS (2005) Interpersonal comparison of subjective probabilities: toward translating linguistic probabilities. Mem Cogn 33(6):1057–1068
Donovan A, Oppenheimer C, Bravo M (2012a) Science at the policy interface: volcano-monitoring technologies and volcanic hazard management. Bull Volcanol 74(5):1005–1022
Donovan A, Oppenheimer C, Bravo M (2012b) The use of belief-based probabilistic methods in volcanology: scientists’ views and implications for risk assessments. J Volcanol Geotherm Res 247–248:168–180
Douglas M, Wildavsky A (1982) Risk and culture. University of California Press, Berkeley, 221 p
Doyle EEH, Johnston DM, McClure J, Paton D (2011) The communication of uncertain scientific advice during natural hazard events. N Z J Psychol 40(4):39–50
Doyle EEH, McClure J, Johnston DM, Paton D (2014) Communicating likelihoods and probabilities in forecasts of volcanic eruptions. J Volcanol Geotherm Res 272:1–15
Dupuit, AJEJ (1844) De la mesure de l’utilité des travaux publics. Annales des ponts et chaussées 8
Eden P (2011) From observations to forecasts – part 14: communicating forecasts. Weather 66(12):325–327
Eldridge J, Reilly J (2003) Risk and relativity: BSE and the British media. In: Pidgeon N, Kasperson RE, Slovic P (eds) The social amplification of risk. Cambridge University Press, Cambridge, pp 138–155
Ellsberg D (1961) Risk, ambiquity, and the savage axioms. Q J Econ 75:643–669
Eoyang GH, Holladay RJ (2013) Adaptive action: leveraging uncertainty in your organization. Stanford Business Books, Stanford, 253 p
Epstein LG (1980) Decision making and the temporal resolution of uncertainty. Int Econ Rev 21(2):269–283
European Community (2000) Communication from the commission on the precautionary principle. Commission of the European Communities (Brussels) 2.2.2000 COM(2000) 1 final. 28 p
Fast NJ, Tiedens LZ (2010) Blame cognition: the automatic transmission of self-serving attributions. J Exp Psychol 46:97–106
Faunce T, Murray K, Nasu H, Bowman D (2008) Sunscreen safety: the precautionary principle, the Australian therapeutic goods administration and nanoparticles in sunscreens. NanoEthics 2:231–240
Favalli M, Mazzarini F, Pareschi MT, Boschi E (2009) Topographic control on lava flow paths at Mount Etna: implications for hazard assessment. J Geophys Res 114(F01017). doi:10.1029/2007JF000918
Felpeto A, Arana V, Ortiz R, Astiz M, Garcia A (2001) Assessment and modeling of lava flow hazard on Lanzarote (Canary Islands). Nat Hazards 23:247–257
Felpeto A, Martí J, Orttiz R (2007) Automatic GIS-based system for volcanic hazard assessment. J Volcanol Geotherm Res 166:106–116
Ferreira C, Boholm A, Löfstedt R (2001) From vision to catastrophe: a risk event in search of images. In: Flynn J, Slovic P, Kunreuther (eds) Risk, media and stigma: understanding public challenges to modern science and technology. Earthscan, London, pp 3–8
Fields J (2011) Uncertainty: turning fear and doubt into fuel for brilliance. Portofilio|Penguin, London, 228 p
Fischhoff B (1995) Risk perception and communication unplugged: twenty years of process. Risk Anal 15(2):137–145
Fiske RS (1984) Volcanologists, journalists, and the concerned local public: a tale of two crises in the Eastern Caribbean. In: Explosive volcanism: inception, evolution, and hazards. National Academy Press, Washington DC, pp 170–176
Folch A, Sulpizio R (2010) Evaluating long-range volcanic ash hazard using supercomputing facilities: application to Somma-Vesuvius (Italy), and consequences for civil aviation over the Central Mediterranean Area. Bull Volcanol 72:1039–1059
Forgione G, Luongo G, Romano R (1989) Mt. Etna (Sicily): volcanic hazard assessment. In: Latter JH (ed) IAVCEI Proceedings in Volcanology I. Springer, Berlin, pp 137–150
Foster KR, Vecchia P, Repacholi MH (2000) Source science and the precautionary principle. Science 288(5468):979–981
Funtowicz S, Ravetz JR (1990) Uncertainty and quality in science for policy. Theory and Decision Library A: Book 15 (Springer). 231 p
Galli I, Nigro G (1987) The social representation of radioactivity among Italian children. Soc Sci Inf 26(3):535–549
Garcia-Aristizabal A, Selva J, Fujita E (2013) Integration of stochastic models for long-term eruption forecasting into a Bayesian event tree scheme: a basis method to estimate the probability of volcanic unrest. Bull Volcanol 75:689–711
Gigerenzer G (2002) Reckoning with risk. Penguin, London, 310 p
Gigerenzer G, Hertwig R, van den Broek E, Fasolo B, Konstantinos V (2005) “A 30% chance of rain tomorrow”: how does the public understand probabilistic weather forecasts? Risk Anal 25(3):623–629
Gill J (2008) Communicating forecast uncertainty for service providers. WMO Bull 57(4):237–243
Goldstein BD, Carruth RS (2004) Implications of the precautionary principle: is it a threat to science? Int J Occup Med Environ Health 17(1):153–161
Gollier G, Jullien B, Treich N (2000) Scientific progress and irreversibility: an economic interpretation of the ‘precautionary principle’. J Public Econ 75:229–253
Gómez-Fernández F (2000) Contribution of geographical information systems to the management of volcanic crises. Nat Hazards 21:347–360
Gong Z, Forrest Y-LJ (2014) Special issue on meteorological disaster risk and assessment: on basis of grey systems theory. Nat Hazards 71:995–1000
Grabe M (2001) Estimation of measurement uncertainties—an alternative to the ISO Guide. Metrologia 38:97–106
Grabe M (2005) Measurement uncertainties in science and technology. Springer, Berlin, 269 p
Graham JD, Hsia S (2002) Europe’s precautionary principle: promise and pitfalls. J Risk Res 5(4):371–390
Granger Morgan M (2003) Characterizing and dealing with uncertainty: insights from the integrated assessment of climate change. Integr Assess 4(1):46–55
Gregory J, Miller S (1998) Science in public: communication, culture, and credibility. Basic, Cambridge, 294 p
Gudmundsson MT, Pedersen R, Vogfjord K, Thorbjarnardottir B, Jakobsdottir S, Roberts MJ (2010) Eruptions of Eyjafjallajökull Volcano, Iceland. Eos Trans AGU 91(21):190–191
Gunn LS, Blake S, Jones MC, Rymer H (2014) Forecasting the duration of volcanic eruptions: an empirical probabilistic model. Bull Volcanol 76:780–798
Gurioli L, Sulpizio R, Cioni R, Sbrana A, Santacroce R, Luperini W, Andronico D (2010) Pyroclastic flow assessment at Somma-Vesuvius based on the geological record. Bull Volcanol 72:1021–1038
Hahn WH, Sunstein CR (2005) The precautionary principle as a basis for decision making. The Economists’ Voice 2(2): Article 8
Haigh N (1994) The introduction of the precautionary principle into the UK. In: O’Riordan T, Cameron J (eds) Interpreting the precautionary principle. Earthscan, London, pp 229–251
Hall F (1950) Communication theory applied to meteorological measurements. J Meteorology 7:121–129
Harcup T (2009) Journalism: principles and practice, 2nd edn. Sage, Los Angeles, 244 p
Harremoës P (2003) The need to account for uncertainty in public decision making related to technological change. Integr Assess 4(1):18–25
Harris AJL, Gurioli L, Hughes EE, Lagreulet S (2012) Impact of the Eyjafjallajökull ash cloud: a newspaper perspective. J Geophys Res 117(B00C08). doi:10.1029/2011JB008735
Haynes K, Barclay J, Pidgeon N (2007) Volcanic hazard communication using maps: an evaluation of their effectiveness. Bull Volcanol 70:123–138
Haynes K, Barclay J, Pidgeon N (2008) The issue of trust and its influence on risk communication during a volcanic crisis. Bull Volcanol 70:605–621
Heliker C (1992) Volcanic and seismic hazards on the island of Hawaii. U.S. Department of the Interior, Washington D.C., 48 p
Ho C-H, Smith EI, Keenan DL (2006) Hazard area and probability of volcanic disruption of the proposed high-level radioactive waste repository at Yucca Mountain, Nevada, USA. Bull Volcanol 69:117–123
Hopkins CC (2010) Scientific advertising. Cosimo, New York, 95 p
Houghton JT (1988) The storm, the media and the enquiry. Weather 43(3):67–70
IAVCEI - Subcommittee for Crisis Protocols (1999) Professional conduct of scientists during volcanic crises. Bull Volcanol 60:323–334
ILGRA - Inter-Departmental Liaison Group on Risk Assessment (2002) The precautionary principle: policy and application. ILGRA, London, 18 p
Jardine CG, Hrude SE (1997) Mixed messages in risk communication. Risk Anal 17(4):489–498
JCGM (2008) Evaluation of measurement data—Guide to the expression of uncertainty in measurement. Joint Committee for Guides in Metrology, JCGM 100:2008 (GUM 1995 with minor corrections). 120 p
Jenkins S, Magill C, McAneney J, Blong R (2012a) Regional ash fall hazard I: a probabilistic assessment methodology. Bull Volcanol 74:1699–1712
Jenkins S, Magill C, McAneney J, Blong R (2012b) Regional ash fall hazard II: Asia-Pacific modelling results and implications. Bull Volcanol 74:1713–1727
Johnson SR, Holt MT (1997) The value of weather information. In: Katz RW, Murphy AH (eds) Economic value of weather and climate forecasts. Cambridge University Press, Cambridge, pp 75–107
Johnson C, Jeunemaitre A (2011) Risk and the role of scientific input for contingency planning: a response to the April 2010 Eyjafjallajökull volcano eruption. In: Alemanno A (ed) Governing disasters: the challenges of emergency risk regulation. Edward Elgar, Cheltenham, pp 51–64
Johnson J, Brantley SR, Swanson DA, Stauffer PH, Hendley JW II (2000) Viewing Hawaii’s lava safely—common sense is not enough. USGS Fact Sheet 152-00. 4 p
Joslyn SL, Nichols RM (2009) Probability or frequency? Expressing forecast uncertainty in public weather forecasts. Meteorol Appl 16:309–314
Joslyn S, Pak K, Jones D, Pyles J, Hunt E (2007) The effect of probabilistic information on threshold forecasts. Weather Forecast 22:804–812
Joslyn SL, Nadav-Greenberg NL, Taing MU, Nichols RM (2009) The effects of wording on the understanding and use of uncertainty information in a threshold forecasting decision. Appl Cogn Psychol 23:55–72
Karelitz TM, Budescu DV (2004) You say “probable” and I say “likely”: improving interpersonal communication with verbal probability phrases. J Exp Psychol Appl 10(1):25–41
Kasper RG (1980) Perceptions of risk and their effects on decision making. In: Schwing RC, Albers WA Jr (eds) Societal risk: how safe is safe enough? Plenum, New York, pp 71–84
Kasperson RE, Palmlund I (1989) Evaluating risk communication. In: Covello V, McCallum D, Pavmova M (eds) Evaluating risk communication. Plenum, New York, pp 143–160
Kipfer BA (1993) Roget’s 21st century thesaurus in dictionary form. Philip Lief, New York, 859 p
Kristiansen NI, Stohl A, Prata AJ, Bukowiecki N, Dacre H, Eckhardt S, Henne S, Hort MC, Johnson BT, Marenco F, Neininger B, Reitebuch O, Seibert P, Thomson DJ, Webster HN, Weinzierl B (2012) Performance assessment of a volcanic ash transport model mini-ensemble used for inverse modeling of the 2010 Eyjafallajökull eruption. J Geophys Res 117(D00U11). doi:10.1029/2011JD016844
Kunreuther H (1992) A conceptual framework for managing low-probability events. In: Krimsky S, Golding D (eds) Social theories of risk. Praeger Publishers, Westport, pp 301–320
Lamb HH (1988) The storm of 15–16 October 1987: historical perspective. Weather 43(3):136–139
Lawes HD (19887) The storm of 15–16 October 1987: a personal experience. Weather 43(3):142
Le Blancq F (2012) Communicating forecasts, or the art of the weather report. Weather 67(3):68–69
Lindsay J, Marzocchi W, Jolly G, Constantinescu R, Selva J, Sandri L (2010) Towards real-time eruption forecasting in the Auckland Volcanic Field: application of BET_EF during the New Zealand National Disaster Exercise ‘Ruaumoko’. Bull Volcanol 72:185–204
Lipkus IM (2007) Numeric, verbal, and visual formats of conveying health risks: suggested best practices and future recommendations. Med Decis Making 27:696–713
Lirer L, Vitelli L (1998) Volcanic risk assessment and mapping in the Vesuvian area using GIS. Nat Hazards 17:1–15
Löfstedt RE (2002) Editorial. J Risk Res 5(4):285–286
Macrae D (2011) Which risk and who decides when there are so many players? In: Alemanno A (ed) Governing disasters: the challenges of emergency risk regulation. Edward Elgar, Cheltenham, pp 13–26
Mandel GN, Gathii GT (2006) Cost-benefit analysis versus the precautionary principle: beyond Cass Sunstein’s Laws of Fear. Univ Ill Law Rev 2006:1037–1080
Manheim JB (1994) Strategic public diplomacy and American foreign policy: the evolution of influence. Oxford University Press, Oxford
Manning MR (2003) The difficulty of communicating uncertainty. Clim Chang 61:9–16
Marchant G, Abbott L, Felsot A, Griffin RL (2013) Impact of the precautionary principle on feeding current and future generations. CAST Issue Pap 52:1–20
Marchau VAWJ, Walker WE (2003) Dealing with uncertainty in implementing advanced driver assistance systems: an adaptive approach. Integr Assess 4(1):35–45
Marley J (2010) Volcanic ash: lessons from the cloud of unknowing? Urol Nurs 4(2):51–52
Martin M (2002) La presse régionale: des affiches aux grands quotidiens. Fayard, Paris, 501 p
Marzocchi W, Bebbington MS (2012) Probabilistic eruption forecasting at short and long time scales. Bull Volcanol 74:1777–1805
Marzocchi W, Woo G (2007) Probabilistic eruption forecasting and the call for an evacuation. Geophys Res Lett 34(L22310). doi:10.1029/2007GL031922
Marzocchi W, Woo G (2009) Principles of volcanic risk metrics: theory and the case study of Mount Vesuvius and Campi Flegrei, Italy. J Geophys Res 114(B03213). doi:10.1029/2008JB005908
Marzocchi W, Sandri L, Gasparini P, Newhall C, Boschi E (2004) Quantifying probabilities of volcanic events: the example of volcanic hazard at Mount Vesuvius. J Geophys Res 109(B11201). doi:10.1029/2004JB003155
Marzocchi W, Sandri L, Selva J (2008) BET_EF: a probabilistic tool for long- and short-term eruption forecasting. Bull Volcanol 70:623–632
Marzocchi W, Sandri L, Selva J (2010) BET_VH: a probabilistic tool for long-term volcanic hazard assessment. Bull Volcanol 72:705–716
Met. Office (2013) The 1987 Great Storm. UK Meteorological Office Factfile, http://www.metoffice.gov.uk/
Météo France (2011) Vigilance. Les Guides Pratiques Météo France, Météo France (Saint Mandé). 19 p
Mikula G, Scherer KR, Athensteadt U (1998) The role of injustice in the elicitation of differential emotional reactions. Personal Soc Psychol Bull 24:769–783
Miles S, Frewer LJ (2003) Public perception of scientific uncertainty in relation to food hazards. J Risk Res 6(3):267–283
Morgan MG, Dowlatabadi H, Henrion M, Keith D, Lempert R, McBride S, Small M, Wilbanks T (2009) Communicating uncertainty. In: Best practice approaches for characterizing, communicating, and incorporating scientific uncertainty in climate decision making, U.S. Climate Change Science Program: 67–70
Morris RM, Gadd AJ (1988) Forecasting the storm of 15–16 October 1987. Weather 43(3):70–90
Morris MW, Peng K (1994) Culture and cause: American and Chinese attributions for social and physical events. Attitudes Soc Cogn 67(6):949–971
Morss RE (2010) Interactions among flood predictions, decisions, and outcomes: synthesis of three cases. Nat Hazards Rev 11:83–96
Morss RE, Demuth JL, Lazo JK (2008) Communicating uncertainty in weather forecasts: a survey of the U.S. public. Weather Forecast 23:974–991
Moss RH, Schneider SH (2000) Uncertainties in the IPCC TAR: Recommendations to lead authors for more consistent assessment and reporting. In: Pachauri R, Taniguchi T, Tanaka K (eds) Guideline papers on the cross cutting issues of the third assessment report of the IPCC. Intergovernmental Panel on Climate Change, Geneva, pp 33–51
Murphy AH (1998) The early history of probability forecasts: some extensions and clarifications. Weather Forecast 13:5–15
Murphy AH, Winkler RL (1974) Probability forecasts: a survey of National Weather Service forecasters. Bull Am Meteorol Soc 55(12):1449–1452
Murphy AH, Lichtenstein S, Fischhoff B, Winkler RL (1980) Misinterpretations of precipitation probability forecasts. Bull Am Meteorol Soc 61(7):695–701
Nelkin D (2003) Foreword: the social meanings of risk. In: Herr Harthorn B, Nelkin D (eds) Risk, culture and health inequality. Praeger, Westport, pp vii–xii
Neufville D (2003) Real options: dealing with uncertainty in systems planning and design. Integr Assess 4(1):26–34
Newhall CG, Hoblitt RP (2002) Constructing event trees for volcanic crises. Bull Volcanol 64:3–20
Newman SM, Clarisse L, Hurtmans D, Marenco F, Johnson B, Turnbull K, Havemann S, Baran AJ, O’Sullivan, Haywood J (2012) A case study of observations of volcanic ash from the Eyjafjallajökull eruption: 2. Airborne and satellite radiative measurements. J Geophys Res 117(D00U13). doi:10.1029/2011JD016780
Norton JP, Brown JD, Mysiak J (2006) To what extent, and how, might uncertainty be defined? Integr Assess J 6(1):83–88
O’Riordan T, Cameron J (1994) The history and contemporary significance of the precautionary principle. In: O’Riordan T, Cameron J (eds) Interpreting the precautionary principle. Earthscan, London, pp 12–30
Ouest France (2014) Le Bretagne épuisée. Ouest France Édition Spécial, Rennes, 48 p
Pachauri R, Taniguchi T, Tanaka K (2000) Guideline papers on the cross cutting issues of the third assessment report of the IPCC. Intergovernmental Panel on Climate Change, Geneva, 138 p
Pappenberger F, Beven KJ, Hunter NM, Bates PD, Gouweleeuw BT, Thielen J, de Roo APJ (2005) Cascading model uncertainty from medium range weather forecasts (10 days) through a rainfall-runoff model to flood inundation predictions within the European Flood Forecasting System (EFFS). Hydrol Earth Syst Sci 9(4):381–393
Pareschi MT, Cavarra L, Favalli M, Giannini F, Meriggi A (2000) GIS and risk management. Nat Hazards 21:361–379
Patt AG, Schrag DP (2003) Using specific language to describe risk and probability. Clim Chang 61:17–30
Peel J (2005) The precautionary principle in practice: environmental decision-making and scientific uncertainty. The Federation Press, Annandale, 244 p
Pennesi K (2007) Improving forecast communication: linguistic and cultural considerations. Bull Am Meteorol Soc 88:1033–1044. doi:10.1175/BAMS-88-7-1033
Pesaresi C, Marta M, Palagiano C, Scandone R (2008) The evaluation of “social risk” due to volcanic eruptions of Vesuvius. Nat Hazards 47:229–243
Peterson DW (1988) Volcanic hazards and public response. J Geophys Res 93(B5):4161–4170
Peterson DW, Tilling RI (1993) Interactions between scientists, civil authorities and the public at hazardous volcanoes. In: Kilburn CR, Luongo G (eds) Active lavas. UCL, London, pp 339–365
Pidgeon N, Fischhoff B (2011) The role of social and decision sciences in communicating uncertain climate risks. Nat Clim Chang 1:35–41
Politi MC, Han PKJ, Col NF (2007) Communicating the uncertainty of harms and benefits of medical interventions. Med Decis Making 27:681–695
Princeton Language Institute (1993) Roget’s 21st century thesaurus. Laurel, New York, 859 p
Quine CP (1988) Damage to trees and woodlands in the storm of 15–16 October 1897. Weather 43(3):114–118
Raffensperger C, Jackson W (1999) Protecting public health and the environment: implementing the precautionary principle. Island, Washington DC, 385 p
Ragnao M, Hansstein F, Mazzocchi M (2011) The financial impact of the volcanic ash crisis on the European airline industry. In: Alemanno A (ed) Governing disasters: the challenges of emergency risk regulation. Edward Elgar, Cheltenham, pp 27–47
Risbey JS, Kandlikar M (2007) Expressions of likelihood and confidence in IPCC uncertainty assessment process. Clim chang 85:19–31
Ricci PF, Rice D, Ziagos J, Cox LA Jr (2003) Precaution, uncertainty and causation in environmental decisions. Environ Int 29:1–19
Risbey JS, Kandlikar M (2007) Expressions of likelihood and confidence in the IPCC uncertainty assessment process. Clim Chang 85:19–31
RMS (2007) The Great Strom of 1987: 20-year retrospective. Risk Management Solutions Inc., Special Report. 18 p
Rougier JC (2013) Quantifying hazard losses. In: Rougier J, Sparks S, Hill L (eds) Risk and uncertainty assessment for natural hazards. Cambridge University Press, Cambridge, pp 19–39
Rougier JC, Beven KJ (2013) Model and data limitations: the sources and implications of epistemic uncertainty. In: Rougier J, Sparks S, Hill L (eds) Risk and uncertainty assessment for natural hazards. Cambridge University Press, Cambridge, pp 40–63
Rowe G, Wright G (2001) Differences in expert and lay judgments of risk: myth or reality? Risk Anal 21(2):341–356
Rowe GR, Frewer L, Sjöberg L (2000) Newspaper reporting of hazards in the UK and Sweden. Public Underst Sci 9:59–78
Ruckelshaus WD (1984) Risk in a free society. Risk Anal 4(3):157–162
Sachs NM (2011) Rescuing the strong precautionary principle from its critics. Univ Ill Law Rev 2011:1285–1338
Sandin P, Peterson M, Hansson SO, Rudén C, Juthe A (2002) Five charges against the precautionary principle. J Risk Res 5(4):287–299
Sandri L, Guidoboni E, Marzocchi W, Selva J (2009) Bayesian event tree for eruption forecasting (BET_EF) at Vesuvius, Italy: a retrospective forward application to the 1631 eruption. Bull Volcanol 71:729–745
Sandri L, Jolly G, Lindsay J, Howe T, Marzocchi W (2012) Combining long- and short-term probabilistic volcanic hazard assessment with cost-benefit analysis to support decision making in a volcanic crisis from the Auckland Volcanic Field, New Zealand
Schwitzer G (2011) News coverage. In: Brewer NT, Downs JS (eds) Communication risks and benefits: an evidence-based user’s guide. FDA, Silver Spring, pp 185–193
Selva J, Orsi G, Di Vito MA, Marzocchi W, Sandri L (2012) Probability hazard map for future vent opening at the Campi Flegrei caldera, Italy. Bull Volcanol 74:497–510
Shackley S, Wynne B (1995) Integrating knowledge for climate change: pyramids, nets and uncertainties. Glob Environ Chang 5(2):113–126
Shubik M (1954) Information, risk, ignorance, and indeterminacy. Q J Econ 68(4):629–640
Sink SA (1995) Determining the public’s understanding of precipitation forecasts: results of a survey. Nat Weather Dig 19(3):9–15
Sissors JZ, Baron RB (2010) Advertising media planning, 7th edn. McGraw-Hill, New York, 480 p
Slovic P (2001) Perceived risk, trust and democracy. In: Slovic P (ed) The perception of risk. Earthscan, Trowbridge, pp 316–326
Smith N, Joffe H (2012) How the public engages with global warming: A social representations approach. Public Underst Sci 22(1):16–32
Sobradelo R, Martí J (2010) Bayesian event tree for long-term volcanic hazard assessment: application to Teide-Pico Viejo stratovolcanoes, Tenerife, Canary Islands. J Geophys Res 115(B05206). doi:10.1029/2009JB006566
Sobradelo R, Bartolini S, Martí J (2014) HASSET: a probability event tree tool to evaluate future volcanic scenarios using Bayesian inference—presented as a plug-in for QGIS. Bull Volcanol 76:770–785
Sonka ST, Changnon SA, Hofing S (1988) Assessing climate information use in Agribusiness. Part II: decision experiments to estimate economic value. J Clim 1:766–774
Sonner BS (1998) The effectiveness of negative political advertising: A case study. J Advert Res 1986: 37–42
Sparks RSJ (2003) Forecasting volcanic eruptions. Earth Planet Sci Lett 210:1–15
Spiegelhalter DJ (2008) Understanding uncertainty. Ann Fam Med 6(3):196–197
Spiegelhalter DJ, Riesch H (2011) Don’t know, can’t know: embracing deeper uncertainties when analysing risks. Philos Trans R Soc A Math Phys Eng Sci 369(1956):4730–4750
Stewart TR (1997) Forecast value: descriptive decision studies. In: Katz RW, Murphy AH (eds) Economic value of weather and climate forecasts. Cambridge University Press, Cambridge, pp 147–181
Stirling R (1997) The weather of Britain. Giles de la Mare Publishers Limited, London, 306 p
Stirling A (2007) Risk, precaution and science: towards a more constructive policy debate. EMBO Rep 8(4):309–315
Stocking SH (1999) How journalists deal with scientific uncertainty. In: Friedman SM, Dunwoody S, Rogers CL (eds) Communicating uncertainty: media coverage of new and controversial science. Erlbaum, Mahwah, New Jersey, pp 23–41
Sulpizio R, Folch A, Costa A, Scaini C, Dellino P (2012) Hazard assessment of far-range volcanic ash dispersal from a violent Strombolian eruption at Somma-Vesuvius volcano, Naples, Italy: implications on civil aviation. Bull Volcanol 74:2205–2218
Sunstein CR (2002) The paralyzing principle. Regulation 2002–2003:32–37
Sunstein CR (2005) Laws of fear: beyond the precautionary principle. Cambridge University Press, Cambridge, 234 p
Sunstein CR (2007) Worst-case scenarios. Harvard University Press, Cambridge, 340 p
Sylvian J (2011) Newspaper and magazine advertising that works: a step by step guide. Digital Media Publishing, 35 p
Taylor JR (1997) An introduction to error analysis: the study of uncertainties in physical measurements. University Science, Sausalito, 327 p
Taylor BN and Kuyatt CE (1994) Guidelines for evaluating and expressing the uncertainty of NIST measurement results. United States Department of Commerce Technology Administration, National Institute of Standards and Technology, Technical Note 1297, U.S. Government Printing Office (Washington DC). 20 p
Teigen TH, Brun W (1999) The directionality of verbal probability expressions: effects on decisions, predictions, and probabilistic reasoning. Organ Behav Hum Decis Process 80(2):155–190
Templeman RF, Oliver HR, Stroud MR, Walker ME, Altay T, Pike SL (1988) Some wind speed and temperature observations during the storm of 15–16 October 1987. Weather 43(3):118–122
Tilling RI (1989) Volcanic hazards and their mitigation: progress and problems. Rev Geophys 27(2):237–269
Tilling RI, Punongbayan RS (1989) Scientific and public response. In: Short courses in Geology (AGU) 1:103–106
Turnbull K, Johnson B, Marenco F, Haywood J, Minikin A, Weinzierl B, Schlager H, Schumann U, Leadbetter S, Woolley A (2012) J Geophys Res 117(D00U12). doi:10.1029/2011JD016688
Tversky A, Kahneman D (1974) Judgment under uncertainty: heuristics and biases. Science 185(4157):1124–1131
Tversky A, Kahneman D (1992) Advances in prospect theory: cumulative representation of uncertainty. J Risk Uncertain 5:297–323
van den Belt H (2003) Debating the precautionary principle: “guilty until proven innocent” or “innocent until proven guilty”? Plant Physiol 132:1122–1126
Viehrig H (2008) Mass media and catastrophe prevention: how to avoid the crisis after the crisis. In: Apostol I et al (eds) Risk assessment as a basis for the forecast and prevention of catastrophes. Ios Press, Amsterdam, pp 258–267
Viens AM (2011) Normative uncertainty and ethics in emergency risk regulation. In: Alemanno A (ed) Governing disasters: the challenges of emergency risk regulation. Edward Elgar, Cheltenham, pp 137–146
Violette C (2014) Deux mois de pluies et tempêtes. In: Ouest France Édition Spécial (Rennes): 3
Walker WE, Marchau VAWJ (2003) Dealing with uncertainty in policy analysis and policymaking. Integr Assess 4(1):5–17
Walker G, Simmons P, Irwin A, Wynee B (1999) Risk communication, public participation and the Seveso II directive. J Hazard Mater 65:179–190
Walker WE, Harremoës P, Rotmans J, Van Der Sluijs JP, Van Asselt MBA, Janssen P, Krayer Von Krauss MP (2003) Defining uncertainty: a conceptual basis for uncertainty management in model-based decision support. Integr Assess 4(1):1–4
Wallsten TS, Fillenbaum S, Cox JA (1986a) Base rate effects on the interpretations of probability and frequency expressions. J Mem Lang 25:571–587
Wallsten TS, Budescu DV, Rapoport A, Zwick R, Forsyth B (1986b) Measuring the vague meanings of probability terms. J Exp Psychol Gen 115(4):348–365
Webster M (2003) Communicating climate change uncertainty to policy-makers and the public. Climate Change 61:1–8
Wiener JB, Rogers MD (2002) Comparing precaution in the United States and Europe. J Risk Res 5(4):317–349
Wilks DS (1997) Forecast value: prescriptive value. In: Katz RW, Murphy AH (eds) Economic value of weather and climate forecasts. Cambridge University Press, Cambridge, pp 75–107
Windschitl PD, Weber EU (1999) The interpretation of “likely” depends on the context, but “70%” is 70%—right? The influence of associative processes on perceived certainty. J Exp Psychol Learn Mem Cogn 25(6):1514–1533
Woo G (2008) Probabilistic criteria for volcano evacuation decisions. Nat Hazards 45:87–97
Woodhouse MJ, Hogg AJ, Phillips JC, Sparks RSJ (2013) Interaction between volcanic plumes and wind during the 2010 Eyjafjallajökull eruption, Iceland. J Geophys Res 118:1–18. doi:10.1029/2012JB009592
Wright AM, Dunlap RE (2010) Anti-reflexivity: the American conservative movement’s success in undermining climate science and policy. Theory Cult Soc 27:100–133
Wynne B (1992) Uncertainty and environmental learning: reconceiving science and policy in the preventive paradigm. Glob Environ Chang 2(2):111–127
Zehr SC (1999) Scientists’ representation of uncertainty. In: Friedman SM, Dunwoody S, Rogers CL (eds) Communicating uncertainty: media coverage of new and controversial science. Erlbaum, Mahwah, New Jersey, pp 3–21
Acknowledgments
Reviews by Tim Orr and Amy Donovan, whose notes, comments, advice, and insight, greatly improved the content and delivery of this contribution.
Author information
Authors and Affiliations
Corresponding author
Additional information
Editorial responsibility: S. Self
Appendix
Appendix
A negative frame that sides with an industrial stakeholder
The following is transcribed from the opening paragraph of Marley (2010). It aptly sums up the situation as regards popular perception of the Eyjafjallajökull ash cloud problem as of May 2010.
“With the benefit of hindsight we might ask—what was it that initially paralyzed the aviation system of North-West Europe for a number of days in April this year? Volcanic ash? Not at all—it was evidence, or rather lack of it. For days on end aircraft were grounded all because of a prevailing and unquestioning paradigm view regarding safety. Until April it had been widely assumed that aircraft should never fly through ash, yet the actual evidence supporting such a view (which may or may not be true) was found to be inadequate, if not absent. Inadequate or not, the assumed view prevailed and aircraft were grounded. Hundreds of thousands of people can testify to confusion, dashed hopes, missed opportunity and sheer misery all because they were unable to reach their destination. People reported being grounded without adequate support and in many cases became frightened and vulnerable, increasingly unable to help themselves from their dwindling personal resources. Motivated by a complex mixture of ‘need to know’, evaporating finances, increasing liability for stranded passengers and a desperation to get flying, airlines carried out tests, the results of which were sufficient to persuade authorities (to) open the skies once again. When faced with loss and a threat to their survival, the airline pursued evidence with single-minded determination, proving that when a strong social and commercial will exists then heaven and earth can literally be moved to ensure change. Of course it remains to be seen if the test results are valid, reliable or capable of safe generalization.”
Rights and permissions
About this article

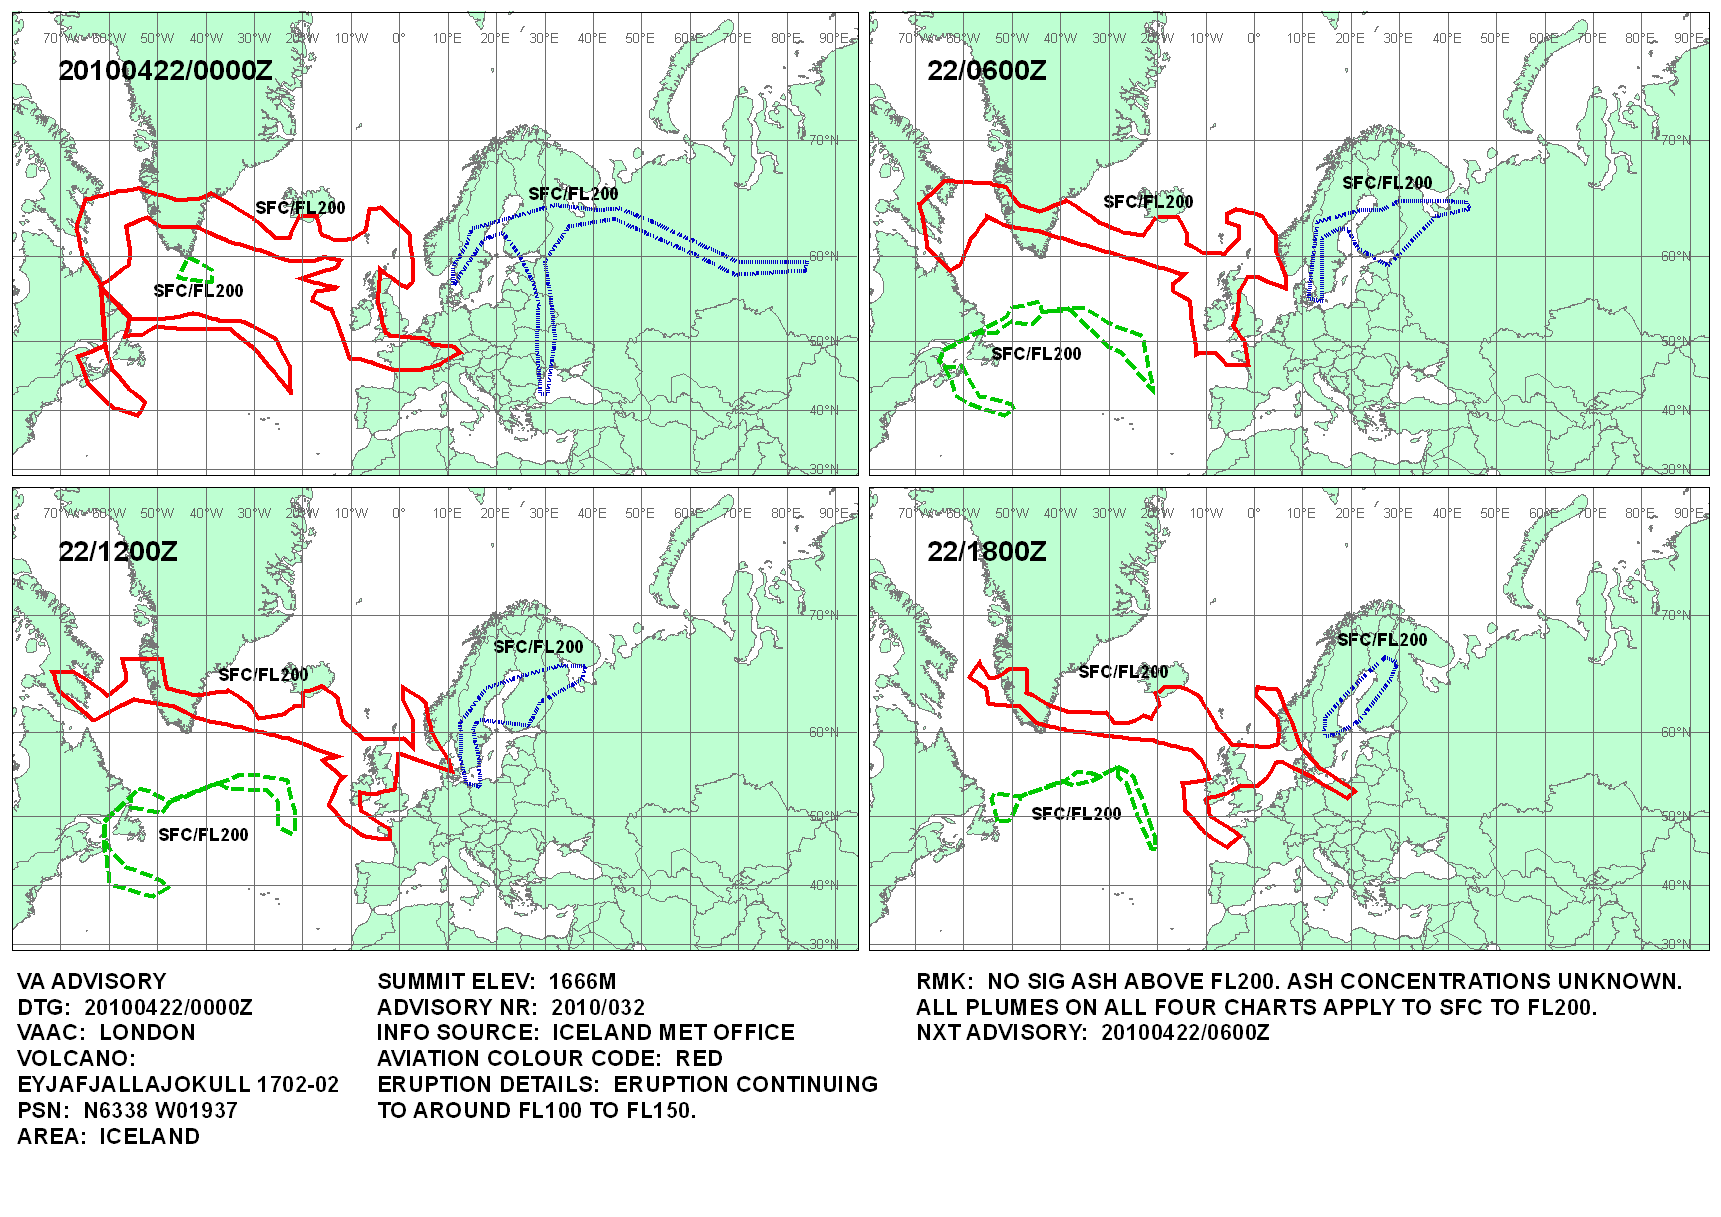
Cite this article
Harris, A.J.L. Forecast communication through the newspaper Part 2: perceptions of uncertainty. Bull Volcanol 77, 30 (2015). https://doi.org/10.1007/s00445-015-0902-6
Received:
Accepted:
Published:
DOI: https://doi.org/10.1007/s00445-015-0902-6