
Abstract
An experimental study of flow and heat transfer downstream of a surface-mounted rib with a slit is reported. The open area ratios of the slit rib considered are 10, 20, 30, 40 and 50% with respect to the total projected rib area. Experiments were conducted in a wind tunnel, mostly at a hydraulic diameter based Reynolds number of 32,100. The surface Nusselt number distribution was determined by liquid crystal thermography. Results show that the slit inside the rib enhances heat transfer and reduces pressure penalty, with an optimum performance seen at an open area ratio of 20%. To explain this result, a qualitative picture of the flow field behind the rib was obtained by smoke visualization. Time averages and turbulent statistics of the velocity and temperature fluctuations were measured in detail, using hotwire anemometry and cold wire anemometry respectively. For open area ratios less than 30%, measurements show that the flow through the slit modifies the reattaching shear layer from the top of the rib. The resulting reattachment length is smaller, the peak in Nusselt number is higher, and the average heat transfer from the heated surface is enhanced. For the rib with an open area ratio greater than 40%, the lower portion behaves as an independent small rib with its own reattachment region. Simultaneously, the flow downstream of the upper rectangular part shows characteristics of vortex shedding. Thus, the size of the slit is seen to be an additional parameter that can be used to control heat transfer from the solid surface, in comparison to the solid rib.
1 Introduction
Rib turbulators are used to improve the convective heat transfer coefficient in many industrial applications. Examples are gas turbine blade cooling passages, heat exchanger surfaces, gas-cooled reactor fuel elements and ventilation equipment of micro-electronic systems. Geometric parameters such as the channel aspect ratio, blockage ratio, the angle of attack, the manner in which the ribs are positioned relative to one another, and the pitch-to-height ratio of the rib have a pronounced effect on both the local and overall heat transfer coefficients. The present work is an investigation of flow mechanisms that result in heat transfer enhancement from a single rib placed on a solid surface, when the rib carries a centrally placed slit.
Han and Zhang (1992) investigated the effect of broken rib orientations on the local heat transfer distributions and pressure drop in a square channel. They showed that the 60° V-shaped broken rib gives higher heat transfer augmentation than other broken rib configurations, while the 90° broken rib produces the largest pressure drop. Acharya et al. (1993) presented the average Nusselt number and overall pressure drop in a ribbed duct with circular rods as vortex generators placed immediately above or just downstream of select rib elements. The authors observed that best performance was obtained when the largest diameter vortex generator was placed directly over every rib. Kukreja et al. (1993) studied the turbulent heat/mass transfer characteristics by the naphthalene sublimation technique in a square channel with arrays of full ribs and V-shaped ribs. They noted that secondary flows caused by oblique ribs interact with the main flow and affect flow reattachment and the recirculation pattern. Chyu and Natarajan (1993) investigated heat transfer rates for inline-slit ribs and staggered-slit ribs mounted on the bottom wall using a naphthalene sublimation technique. They found superior performance of slit ribs in comparison to the full ribs. Aliaga et al. (1994) investigated the distribution of heat transfer coefficient over plates with square ribs using infrared thermography. The authors demonstrated its capabilities in capturing the variations in heat transfer rate due to the occurrence of reattachment, recirculation and separation. Torii et al. (1994) experimentally studied the mechanism of heat transfer augmentation due to longitudinal vortices behind a single half-delta wing vortex generator placed in a laminar boundary layer on a flat plate. Liou et al. (1995) compared attached and detached ribs in a duct using laser holographic interferometry. The detached ribbed geometry was found to have an advantage of eliminating hot spots behind the attached ribs. Ekkad and Han (1997) presented the Nusselt number distributions in a two-pass square channel with one ribbed wall using transient liquid crystal thermography and showed the effect of secondary flows induced by the 180° turn. Hwang (1998) investigated the effect of interrupted slits in a rib on heat transfer in a rectangular channel using laser holographic interferometry and observed superior heat transfer performance of the slit-ribbed channel. Mochizuki et al. (1999) investigated the fluid flow and heat transfer in two straight rectangular channels with a 180° sharp bend and observed that the heat transfer characteristics downstream are controlled by secondary flows generated in the bend. Cavallero and Tanda (2002) studied continuous and broken rib configurations using liquid crystal thermography. A large enhancement in heat transfer coefficient was seen for interrupted ribs. Panigrahi and Acharya (2004) showed the effectiveness of interaction between the natural instability mode and imposed acoustic excitation in regularizing and manipulating the flow behind a solid rib. In a later work, Panigrahi and Tariq (2003) proposed a rib geometry with a continuous slit inside and established its superiority from the entropy generation principle applied to experimental data.
The present study addresses the question of how ribs with continuous slits alter the local velocity and temperature fields in the wake, and lead to heat transfer enhancement. To reveal the mechanisms of momentum and energy transport processes, detailed measurements of flow and temperature fields are required and form the basis of the present work. The surface Nusselt number distribution was determined from LCT data, velocity and temperature measurements from hot wire and cold wire anemometry, and flow visualization were conducted in a smoke tunnel. Experiments were carried out in a wind tunnel, in the context of a long rib of square cross-section, with a built-in centrally located slit. The Reynolds number range considered is such as to make the near-wake unsteady, and the overall flow turbulent.
2 Apparatus and instrumentation
The schematic drawing of the experimental setup with instrumentation used in the present work is shown in Fig. 1. The facility comprises a flow circuit, an image processing system, the traverse mechanism, and the heating section. Experiments were performed in an open-loop airflow arrangement. Air is sucked into the test section through a honeycomb section, five anti-turbulence screens, and a 3:1 contraction cone. The test section is followed by a flow straightener that minimizes the influence of blower noise in the test section. The airflow rate delivered by the blower is varied by a frequency-based speed controller (Victor G1000, Kirloskar Electric). The test channel is 3,300 mm long, and is 298 mm×160 mm in cross-section. It is made of Plexiglas sheet, 12 mm thickness. Free stream turbulence was found to be less than 0.5% at the entrance of the test cell for the velocity range used in this work, while the flow parallelism was better than 98% over 95% of the tunnel height.
The rib considered in the present study is prismatic in shape with a square cross-section. The slit rib geometry used in the present work is shown in Fig. 1. The slit is characterized by the open area ratio, defined as the ratio of the projected area of the slit to the total projected area of the rib. Open area ratios of 10, 20, 30, 40 and 50% were investigated, and compared with the performance of a solid rib.
The surface carrying the rib is an aluminum plate (680 mm×298 mm×3 mm) heated by six stainless steel foil heaters that are connected in series from below. To minimize conduction heat losses, the lower surface of the Bakelite sheet is insulated using a 13 mm thick plate of Bakelite with a 3 mm air gap in-between. The heat transfer surface is instrumented with thirteen calibrated chromel-alumel thermocouples (type K, 26 gage) along the centerline and in the spanwise directions. The thermocouples are connected to a temperature acquisition card (National Instruments, NI-4351) for data logging. Conduction losses to the lower surface of the heating section are estimated by thermocouples embedded in the Bakelite plate at several depth locations. At steady state, the aluminum test surface attained a practically isothermal boundary condition of 40°C, the maximum temperature difference being about 1°C over the entire length of the heated section. Over the region analyzed in the present work, the temperature variation was considerably smaller.
2.1 Liquid crystal thermography
A transient cooling approach has been adopted in the present work for determining the distribution of the local heat transfer coefficient, and hence the Nusselt number. The transient technique is based on the earlier work of Ekkad and Han (1997), and has also been described elsewhere by Panigrahi and Tariq (2003) and Tariq and Panigrahi (2003). The time-dependent temperature distribution over the aluminum surface was recorded using liquid crystal thermography (LCT).
The transient cooling technique uses a 1-D semi-infinite solid heat transfer model in the test surface made of Bakelite. The aluminum plate mounted on the top surface of the Bakelite plate ensures the smoothening of local temperature non-uniformity in the second direction. The low thermal diffusivity of Bakelite ensures that the one-dimensional approximation is good, since the plate response is limited to a thin layer near the surface. The Bakelite sheet thus behaves as a semi-infinite solid, with its other side remaining at the ambient temperature. This requirement has been experimentally confirmed in the present work. For the boundary conditions realized in the experiment (heating from one side, thermally insulated conditions on the other), lateral conduction can be shown to be small. This assumption has been verified both numerically and experimentally by various investigators in the literature (Baughn 1995). The criterion for the validity of semi-infinite solid assumption is that the minimum thickness of the material should be greater than \(4{\sqrt {\alpha t} },\) where α is thermal diffusivity of Bakelite and t is the total duration of transient experiment. The maximum duration of a typical transient experiment in our case is 80 s. A calculation with the physical properties of Bakelite reveals that the substrate thickness should be ≥13 mm to satisfy the assumptions of the 1-D conduction model. A sheet of thickness of 40 mm was used in the present work.
The transient non-dimensional temperature variation of the test surface is curve-fitted using a least squares procedure. In this respect, the following temperature profile is made use of:
Here, Tw(t) is the surface temperature at time t, Tb is the bulk mean temperature, Tw,i is the initial surface temperature, h is the convective heat transfer coefficient, α is thermal diffusivity and k is thermal conductivity of the Bakelite plate. A least squares program was developed for this purpose, wherein the data input is time and dimensionless temperature, while the output is the best-fit value of h, at the point under consideration.
At the start of the experiment, the plate is at a uniform temperature. The corresponding color of the sheet does not contain information about the heat transfer coefficient. This information comes into picture only when the plate is cooled. Different portions of the plate cool at their own rates depending on the local values of the heat transfer coefficient. The color profiles now contain information of the local heat transfer coefficient. The transient experiment is performed as follows: The test plate is preheated to a constant temperature and then cooled by starting cold flow in the test cell. The transient LCT images of the test surface are recorded in the form of 45 sequential images. Transverse streaks of uniform color were seen in the LCT images (Panigrahi and Tariq 2003), confirming that the thermal field is nominally two-dimensional. Hence span-wise temperature gradients are quite small in the present experiments. The temperatures recorded from LCT are averaged in this direction and combined with Eq. 1 to yield a local distribution of the heat transfer coefficient.
2.2 Hotwire anemometry
Two components of velocity and velocity fluctuations, including their cross-correlation were measured using an X-probe (DANTEC 55P63). The probe was mounted on a computer-controlled traversing mechanism that has a least count of 0.1 mm. The probes were connected to DANTEC 56C17 constant temperature hot-wire bridge circuits. Voltage signals from the CTA were low-pass filtered at 1.0 kHz and high-pass filtered at 0.1 Hz using a DANTEC 56N20 amplifier/filter unit. The instantaneous velocity signals were acquired for a period of 15 s by using an A/D card (NI-PCI-MIO-16E-1) at a sampling rate of 2,000 Hz and an amplification of 100. The filter settings were determined by examining the complete power spectrum of the velocity components. The mean voltage signals were obtained from the 4.5 digits mean value unit of the anemometer after averaging for a period of 100 s. The LabVIEW software was used to acquire the anemometer data. For hot-wire calibration, a pitot static tube, connected to a 19.99 mm H2O digital micro-manometer (FC012 Furness Controls), was placed on the duct centerline. Small changes in room temperature (±0.5°C) were compensated through the use of a correction formula that assumes the heat transfer coefficient to be independent of temperature. For larger changes, the wire was re-calibrated. Both wires of the X-probe were operated at 150°C, and their calibration curves fitted by a fourth-order polynomial were observed to be practically identical. This result is useful for data reduction of hot-wire signals (Bruun 1994).
The error in urms measurements from hot wire anemometry as a function of turbulence intensity (Tu) has been discussed in the literature. It is observed that the error in urms values will increase with an increase in turbulence intensity (Bruun 1994). The error in urms remains relatively small for Tu<10% if time-mean and RMS voltages are measured and subsequently converted to velocity. If velocity fluctuations are determined from a velocity signal that is obtained from voltages for every instant of time, errors can be expected to be smaller. This result was confirmed in Swaminathan et al. (1986) from measurements of velocity fluctuations as large as 45% in the near-wake of a square cylinder (but outside the base region). It is this approach of data acquisition analysis that was adopted in the present work. In the present investigation, a maximum 25% turbulence intensity was observed in the experiments. Therefore, the hotwire measurements can be taken to be reliable and meaningful.
The hot-wire data reduction technique was validated by measuring distributions of velocity fluctuations and turbulent shear stress for a fully developed turbulent boundary layer over a flat plate (Schlichting 1979). The LCT technique was validated against flat plate correlations for local Nusselt number distribution in turbulent flow. The average exponent of Rex was experimentally determined to be 0.795, as against a value of 0.8 quoted in the literature (Kays and Crawford 1993).
Friction factor was determined in the present study by direct pressure drop measurements in the test section, normalized by the corresponding value for a smooth flat plate.
3 Uncertainty estimates
The uncertainty levels in the measured data have been assessed by repeating the experiments with nominally similar flow conditions. The uncertainty of the local Nusselt number estimated using the standard deviation from repeated measurements is about ±4%. Velocity profiles in wall coordinates and Strouhal number were equally insensitive to Reynolds number over the range of interest. In turn, factors such as minor changes in the room temperature had negligible influence in the results presented in dimensionless form. They responded quite significantly to the size of the slit within the rib. The heat transfer data reported in the following sections have been cross-checked for steady state thermal energy balance by mapping the velocity and temperature profiles at the boundaries of a selected control volume. The energy balance was consistently found to be better than 98% indicating the accuracy of the velocity and temperature measurements. As discussed in Sect. 2.2, the exponent of the Reynolds number in the flat plate-Nusselt number correlation matched with that of the smooth channel experiment from LCT within 1% indicating the accuracy of the LCT technique.
The error in measuring the surface temperature from liquid crystal was estimated to be ±0.2 C, based on a large number of calibration experiments. Thus, the error in the initial surface temperature measurement at the start of the transient run is ±0.2 C. The error in measuring time, t is estimated to be about ±70 ms and the error in room temperature is ±0.06 C. Room temperature plays only an indirect role in the determination of the Nusselt number. Thus, errors in the experimental data, due to a limited least count of the measurement systems are negligible.
The location of velocity and temperature probes were precisely controlled by using a computer-controlled automated traverse mechanism with a least count of ±0.1 mm. The voltage measurement during the hotwire calibration and the actual velocity measurement were carried out by a 12-bit data acquisition card and the LabVIEW platform in a computer. The hotwire calibration error due to curve-fitting is within ±0.5%. Once again, the greatest uncertainty in the measurement was not from calibration, but due to the reproducibility of the flow field itself. The uncertainty from the standard deviation of the mean velocity (u and v) and temperature (T) was estimated from repeated experiments (under similar conditions, as well as at nearby Reynolds numbers) to be ±2% and ±3% respectively. The uncertainty of normal stresses (urms, vrms) and shear stress \( - \overline{{{u}\ifmmode{'}\else$'$\fi{v}\ifmmode{'}\else$'$\fi}} \) were estimated to be ±5% and ±7% respectively. The uncertainty in Trms is estimated to be ±6%.
3.1 Energy balance
The quality of the experiments was ascertained by performing an energy balance check as follows. The first term of the energy balance equation employs the control volume that consists of the inflow-plane, the outflow-plane and the heated surface of the test section. The net heat transfer rate from the heated surface to air (Qnet) is calculated as the difference in enthalpy (ρuCpT) between the inlet and exit of the control volume. Energy lost from the top surface of the control volume is accounted for in the calculation. The second term of the energy balance equation comprises the test surface as the control volume. The heat loss (conduction and radiation) from the surface is subtracted from the total electrical power input (voltage (V)×current (I)) to provide the net convective heat transfer (Qnet) from the test surface. A 1-D conduction model was used to compute the conduction heat losses to the lower side of the test section. Radiation losses were estimated for the heated plate using an emissivity ε=0.92 for the liquid crystal sheet. The average conduction and radiation losses were observed to be about 8 to 24% of the total electrical power input respectively. Under ideal conditions, the two terms of the energy balance equation should be close to each other. In the present work, the two terms were within ±5% of each other.
4 Results and discussion
Results have been presented for flow and heat transfer around a slit rib mounted on a flat surface, and compared with the performance of a solid rib. For the range of Reynolds numbers considered, all configurations led to heat transfer enhancement with respect to a flat surface without a rib. In addition, the presence of a slit consistently led to a higher enhancement with respect to a solid rib. The focus of the present research is to investigate the nature of the flow and thermal fields that lead to higher Nusselt numbers, without a comparable increase in the pressure penalty. Results are discussed below in the following sequence: (1) Nusselt number distribution; (2) time-averaged velocity profiles; (3) turbulent stresses; (4) time-averaged and rms temperature profiles; (5) smoke visualization; and (6) power spectra.
4.1 Nusselt number
The local Nusselt number referred here is with respect to the streamwise coordinate, and has been averaged in the spanwise direction along the rib length. The local augmentation Nusselt number variation for the solid and the slit ribs are compared in Fig. 2. The data has been scaled by the local Nusselt number for a smooth flat plate at the appropriate Reynolds number. It is observed that wall heat transfer increases in the stream-wise direction from the downstream edge of the rib, reaches a maximum, and subsequently decreases in magnitude farther downstream. The Nusselt numbers in the presence of a rib are uniformly greater than that for a flat surface; in addition the presence of a slit raises the Nusselt number beyond that of a solid rib, for certain open area ratios. These results are repeatedly seen at the Reynolds numbers of 22,600, 32,100 and 40,800. The nature of variation of the Nusselt number for the ribs with a slit shows a strong dependence on the open area ratio. The slit ribs with β=10, 20 and 30% are more effective than the solid rib in the far-field region at the three Reynolds numbers. The heat transfer rates in the near-field of the slit rib for all open area ratios are higher than the solid rib at Reynolds numbers of 32,100 and 40,800; the trend is less conclusive at the lowest Reynolds number. For the lower open area ratio (β=10, 20 and 30%), heat transfer enhancement is significant both in the near- and far-field regions. The maximum in Nusselt number occurs earlier for open area ratios of 40 and 50% in comparison to 10, 20 and 30% slit ribs as well as the solid rib. Heat transfer enhancement is limited here to the near-field region alone.

The span-wise averaged augmentation Nusselt number variation of solid rib and slit rib with downstream distance (open area ratio, β=10, 20, 30, 40 and 50%) at three Reynolds numbers
Using the position of the maximum in the local Nusselt number variation with distance, it is possible to identify the recirculation length as a function of the open area ratio. This data is given in Table 1. A significant reduction in the size of the recirculation zone is observed for slit ribs with β=40 and 50% in comparison to those with β=10, 20 and 30%, as well as the solid rib. The bandwidth of the maximum heat transfer region (reattachment zone) of the 10, 20 and 30% slit ribs is higher than the solid rib. This indicates that the reattachment process is sensitive to flow through the slit. This observation correlates well with the velocity and temperature fields and is discussed in Sects. 4.2 and 4.4.
The re-attachment lengths reported in the literature for wall-mounted arrays of solid ribs are compared in Table 2. The data of the present study from LCT and smoke visualization are in agreement with the values of Liou (1990) and Sparrow and Tao (1983) reported on the basis of velocity and naphthalene sublimation measurements respectively. The augmentation Nusselt numbers surveyed in Table 2 for the single rib of the present work and rib arrays of Kukreja et al. (1993), Aliaga et al. (1994), Cavallero and Tanda (2002) and Sparrow and Tao (1983) are comparable to one another. The augmentation Nusselt numbers for a slit rib of the present work are lower than those of rib arrays of Hwang (1998), and are compared in Table 3. This is understandable because the slits of Hwang (1998) make the flow unsteady as well as three-dimensional. The slit of the present work is expected to keep the flow close to the two-dimensional state.
The plate-averaged augmentation Nusselt number and friction factor ratio for the solid and slit ribs are compared in Fig. 3 at Reynolds numbers of 22,600, 32,100 and 40,800. The reference here is the plate-averaged Nusselt number and the friction factor for a smooth flat plate. The augmentation Nusselt number increases initially with the open area ratio, attains a maximum, and subsequently diminishes. The friction factor ratio decreases with an increase in the open area ratio for all Reynolds number. Slit ribs with β=40 and 50% have the lowest friction factor ratio. The slit ribs of open area ratios of 10, 20 and 30% have a higher heat transfer enhancement and a lower pressure penalty at Reynolds numbers of 22,600 and 32,100, when compared to a solid rib. The slit rib with an open area ratio of β=20% has the greatest heat transfer enhancement among all ribs studied for the three Reynolds numbers.

The comparison of augmentation Nusselt number \({\left( {{\overline{{Nu}} } \mathord{\left/ {\vphantom {{\overline{{Nu}} } {\overline{{Nu}} _{{\text{o}}} }}} \right. \kern-\nulldelimiterspace} {\overline{{Nu}} _{{\text{o}}} }} \right)}\) and friction factor ratio (f/fo) as a function of open area ratio (β) for three Reynolds numbers
The data of Figs. 2 and 3 can be explained using the following physical picture. The role of secondary flow on heat transfer enhancement is a function of the open area ratio of the slit rib. For a solid rib, the secondary flow brings cold outer flow to the vicinity of the wall and increases heat transfer. For large open area ratio slit ribs (β=40 and 50%), the secondary flow inside the slit plays a negligible role on the shear layer modification. This is because the top portion of the slit rib acts like an independent rib in the free stream. However, for intermediate open area ratios (β≤30%), the slit flow offers positive impact on both the surface heat transfer enhancement and pressure penalty. The slit flow affects the unsteadiness of the recirculation bubble, which in turns influences heat transfer in the pre-reattachment region. More importantly, the flow through the rib alters the flow structure inside the reattaching shear layer. Therefore, the recirculation pattern enclosed by the reattaching shear layer is modified; that in turn affects heat transfer ahead of the reattachment point. The pressure penalty of a slit rib is reduced due to the mass addition inside the wake region leading to drop in momentum deficit.
The above results have been examined in terms of the flow and transport mechanisms in the following sections. For definiteness, the discussion is restricted to a Reynolds number of 32,100.
4.2 Time-averaged velocity profiles
The time-averaged streamwise (u) and transverse (v) components of velocity are presented in Fig. 4; the equivalent plot for the streamwise component in wall coordinates (u+ vs. y+) is given in Fig. 5. Local streamwise velocities in the region adjacent to the rib are likely to be reversed, in particular for β<30%, and cannot be sensed by the hot-wire probe. These points (for x/e<7.5) have not been shown in Fig. 4. Here, x is a coordinate measured from the downstream corner of the rib. The transverse component of velocity can however, be measured by the probe. In an earlier work (Panigrahi and Acharya 1999), it was shown from LDV measurements that the ratio of the number of negative velocity points to positive velocity points is zero above the y-location corresponding to u/Umax>0.6, where Umax is the maximum velocity at the corresponding stream-wise location. Therefore, u-velocity measurements above the y-location corresponding to u/Umax>0.6 alone have been reported.

Non-dimensional time averaged velocities (u- and v-components) for solid rib and slit rib; β=10, 20, 30, 40 and 50%; Re=32,100

Velocity profiles in wall co-ordinates at different streamwise locations for solid rib and slit rib; β=10, 20, 30, 40 and 50%; Re=32,100
The overall behavior of the flow field, wherein fluid particles go around the rib, flow separation at the rib corners leading to a recirculation zone beyond the rib, flow re-attachment and the appearance once again of boundary-layer behavior in the far-field are confirmed from the figures. The presence of a slit in the rib can support through-flow and alter the velocity profiles. In addition, at large open area ratios, the two parts of the rib can independently sustain their individual wakes. A minor recirculation zone ahead of the rib forms at the lower corner, and was visible in the flow visualization images of the present work. Measurements of velocity and temperature within this region have not been discussed, since its contribution to heat transfer enhancement is minimal.
In the near-wall region, the u-velocities of the solid as well as 10, 20 and 30% slit ribs are lower than those for ribs with 40 and 50% slits. Flow through the slit itself is significant for open area ratios of β=40 and 50%, and was seen to produce higher u-velocities upstream of the rib. The u-velocity at x/e=2.5 shows a local maximum for slit ribs with β=40 and 50% due to flow through the rib. The v-velocity has dual peaks in the near-wall region for 40 and 50% slit ribs, the peak in the near-wall region being higher than the other. This can be attributed to the wake-like behavior sustained independently by the top portion of the slit rib. The difference in the magnitudes of the u-velocity peaks is because of the differences in their respective environment; the upper peak is influenced by the outer mean flow, while the lower region is influenced by the flow through the slit and the rigid lower surface.
At x/e=5.0, 7.5 and 13.5, the u-velocity continues to be lower in the near-wall region for the solid rib and slit ribs with open area ratios of 10, 20 and 30%, when compared to those with a larger opening. However, the v-velocity for the 40 and 50% slit ribs drops significantly at these locations, in comparison to x/e=2.5. This trend is understandable because the top parts of these ribs behave as independent rectangular obstacles mounted in the free stream. The net transverse dimension of the lower part of the slit rib is smaller in comparison to the total rib height. The vertical deflection of the shear layer is smaller, thus leading to a lower magnitude of the v-velocity. The reduction in the v-velocity at these locations can be correlated with a reduction in the momentum transport in the direction normal to the wall, and therefore a drop in heat transfer enhancement (Fig. 2). The higher u-velocity at x/e=5.0, 7.5 and 13.5 for β=40 and 50% slit ribs does not correlate with heat transfer enhancement; in fact the heat transfer rates are the lowest in these regions (Fig. 2). This indicates a greater correlation of wall heat transfer to the near-wall v-velocity, rather than the u-velocity. This trend is characteristic of heat transfer mechanisms that are based on mixing of the hot fluid with the cold outer flow in the presence of a vortex.
In the post reattachment zones of x/e=16.0 and 23.5, the difference in the u-velocity profile for different rib geometries is small. However, the relative variation in the v-velocity is appreciable at these locations. The significant variation of heat transfer enhancement among different rib geometries at these locations in Fig. 2 indicates once again a stronger relationship between the v-velocity and the heat transfer mechanism for a wall-mounted rib.
The evolution of the streamwise velocity profiles in wall coordinates are compared in Fig. 5. The velocity profiles for the solid and the slit ribs approach the turbulent law of the wall in the far-field region. The shapes of the velocity profiles in wall coordinates evolve in the streamwise direction. In the near-field region, the shape depends on the open area ratio and hence the rib geometry. The velocity profiles for open area ratios of 40 and 50% approach the law of the wall profile for a smooth duct at an earlier x/e location in comparison to the other rib geometries. The reattachment and redevelopment of the boundary layer takes place at an earlier x/e location, dictated essentially by the size of lower part of the slit rib. For β<30%, re-attachment of the separated shear layer is unaffected, but flow modifications near the rib delay the establishment of a fully developed boundary-layer.
4.3 Turbulent stresses
Turbulence measurements are discussed in the present section. At the Reynolds number considered, the wake, the shear layer as well as the boundary layer that form at the wall after re-attachment are all turbulent. In a hot-wire measurement, the wake unsteadiness is itself recorded as a part of the turbulent fluctuations. In all experiments, the turbulence levels were found to diminish to around 0.5% beyond a vertical distance of six rib heights. Turbulence levels upstream of the rib were equally small, except in the region affected by separation at the lower upstream corner of the rib. In the following discussion, vertical profiles of two components of the normal stress as well as one component of the shear stress have been discussed. Their relationship to heat transfer enhancement is explored.
4.3.1 Normal stresses
Normal stresses have been presented in terms of the rms values urms and vrms in Fig. 6. Data in the zone of reversed velocity has not been shown (β<30%); instead an average trend has been indicated by a dashed line. At the upstream location of x/e=−2.5, urms and vrms velocities were found to be small, except close to the rib corner, where a separation zone is formed adjacent to the rib. Beyond the rib (x/e=2.5, 5.0 and 7.5), both urms and vrms increase with distance normal to the wall, reach a maximum and subsequently reduce to the respective free stream values. The effect of having a slit is to lower the magnitude of fluctuations with respect to the solid rib. At x/e=2.5 the maximum urms and vrms values are observed for the slit rib with β=40%, followed by the slit rib with β=50%.

Non-dimensional rms velocities (urms and vrms) for solid rib and slit rib; β=10, 20, 30, 40 and 50%. For β<30%, a dashed line has been used to represent the expected trend in the region of reversed velocity.
The shapes of the urms and vrms profiles in the recirculation zone can be explained as follows: The streamwise normal stress represented by urms is primarily related to the transverse gradients in the time-averaged streamwise velocity. The transverse normal stress vrms depends on the instantaneous pressure difference between the wake and the external flow. The 40% slit rib creates a larger pressure difference in the wake region behind the top portion of the slit rib, leading to larger vrms values, in comparison to the 50% slit rib. These trends continue to be seen at x/e=5.0 and 7.5, with adjustments taking place to account for changes in the time-averaged velocity profile. For β=40 and 50%, the re-attachment length is short, and the accompanying effect of boundary-layer growth is felt. Consequently, the peak in the rms velocities shifts from the interior of the fluid region to the wall.
At locations x/e=13.5, 16.0 and 23.5, the distribution of velocity fluctuations take on a self-similar form, being flat for the streamwise normal stress in the near-wall region, and falling to zero closer to the edge of the boundary-layer. The transverse normal stress shows a slight reduction towards the wall, but the self-similar nature of the profiles is to be seen. These trends are characteristic of turbulent boundary-layers (Schlichting 1979), wherein turbulence reached a fully developed state. Under these conditions, production and dissipation mechanisms are in balance. Broadly, diffusion and convection are of secondary importance, though they communicate information about the origin of turbulence at the rib to the boundary-layer downstream.
The wake of a rib can be identified as a zone of recirculation, where vorticity is produced; the rib is also a roughness element that promotes turbulence. Heat transfer enhancement at the wall is a combined effect of these two factors. It can be expected that at lower Reynolds numbers, steady vortical motion contributes towards enhancement. Fluctuations become important to wall heat transfer beyond the point of re-attachment and at higher Reynolds numbers. For the present work the Reynolds number is 32,100 (equivalent to a rib-height-based Reynolds number of 2,000), and fluctuations can be expected to be an important consideration everywhere beyond the rib. If the rib were to function as a turbulence promoter (rather than a vortex generator), it can be expected that the total turbulence produced by the rib correlates with the average heat transfer enhancement. This aspect was examined in the following manner. The integrated values of urms and vrms across the boundary layer have been individually plotted in Fig. 7. The integrated turbulent fluctuations increase in the streamwise direction, show a maximum around the re-attachment point, and subsequently decrease. The integrated velocity fluctuations in the far-field (x/e>5) for the 10, 20 and 30% open area ratios ribs are greater than 40 and 50% open area ratio ribs. These trends are to be compared with the local Nusselt number distribution in Fig. 2. Along with features such as a local maximum in Nusselt number, it can be seen that heat transfer in the far-field for the 40 and 50% slit ribs is quite small, when compared to open area ratios of 10–30%. Thus, it is clear that a part of the enhancement in heat transfer depends on the turbulence generated by the rib.

The integrated urms and vrms values for solid rib and slit rib; β=10, 20, 30, 40 and 50%; Re=32,100. For β<30%, values in the region of reversed flow are not shown.
Chen and Du (2003) experimentally investigated the effect of three-dimensional velocity fluctuations on heat transfer enhancement and observed a positive correlation between them. The data of the present work shows that the correlation is only conditionally valid. Specifically, the integrated urms and vrms fluctuations for the solid rib are higher than those for 10, 20 and 30% open area ratios in Fig. 7. Yet, the solid rib has a lower heat transfer enhancement.
4.3.2 Shear stresses
The cross-correlation between the x- and y-velocity fluctuations can become active in the boundary-layer that forms in the far-field of the rib, as well as the free shear layer produced by the rib corner. As shown by Hinze (1979), the production of this quantity is linked to spatial gradients in the time-averaged velocity. The cross-correlation is equivalent to a shear stress, and serves to increase wall friction and heat transfer with respect to the laminar state. To a first approximation, one can expect similarity between \( - \overline{{{u}\ifmmode{'}\else$'$\fi{v}\ifmmode{'}\else$'$\fi}} \;{\text{and}}\;\overline{{{v}\ifmmode{'}\else$'$\fi{T}\ifmmode{'}\else$'$\fi}} ,\) the latter being the turbulent heat flux. Thus augmentation in the former is a measure of enhancement in heat transfer itself. Profiles of cross-correlation function \( - \overline{{{u}\ifmmode{'}\else$'$\fi{v}\ifmmode{'}\else$'$\fi}} \) for various open area ratios are presented in Fig. 8. In the far-wake (x/e>7.5), it is clear that \( - \overline{{{u}\ifmmode{'}\else$'$\fi{v}\ifmmode{'}\else$'$\fi}} \) has the same sign as the gradient of the time-averaged velocity profile, namely positive. It is also positive at the edge of the shear layer (y/e beyond 2) for all x-locations. In the presence of a slit, the gradients in the time-averaged velocity are not significantly altered, with a simultaneous reduction in the shear stress levels. This result shows that the turbulent shear stress does not correlate with the heat transfer enhancement data of Fig. 2, wherein it is shown that slit ribs perform better than solid ribs. For lower open area ratios (β=10–30%), the role of the slit is to be interpreted as modifying the large-scale flow structure adjacent to the rib, rather than assisting turbulence production. The large-scale flow structure is responsible for heat transfer enhancement near the rib, in an environment where turbulence production is actually diminished.

Non-dimensional turbulent shear stress for solid rib and slit rib; β=10, 20, 30, 40 and 50%. For β<30%, a dashed line has been used to represent the expected trend in the region of reversed velocity.
Closer to the rib, the turbulent shear stresses for slit ribs are significantly influenced by the flow through the slit. For a solid rib, these stresses are significant near the free shear layer that forms closer to the upper surface. In the presence of a slit, the location of the peak in \( - \overline{{{u}\ifmmode{'}\else$'$\fi{v}\ifmmode{'}\else$'$\fi}} \) shifts downwards where the shear layer has an interaction with jet-like through-flow in the slit. The wake-like behavior of \( - \overline{{{u}\ifmmode{'}\else$'$\fi{v}\ifmmode{'}\else$'$\fi}} \) for the 40 and 50% slit rib at x/e=2.5 can be attributed to the free stream-like flow behind the upper portion of the slit rib and the reattaching-like flow behind the lower portion of the slit rib.
4.4 Temperature profile and fluctuations
Time-averaged temperature variation in the wake of the rib directly reflects the extent of wall heat transfer. The importance of temperature fluctuations towards heat transfer enhancement is not as direct. Velocity fluctuations can be associated with large gradients in the time-averaged flow, leading to better fluid mixing and heat transfer enhancement. Temperature fluctuations are also produced in regions of large time-averaged temperature gradients, which can be advected and diffused from their points of origin and dissipated. The relationship between a large local temperature fluctuation and the local Nusselt number is examined in the present section.
The region immediately behind the solid rib is not well-mixed because of the recirculation pattern. Away from the rib, the vertical extent of the recirculation zone decreases, and the wall is in greater proximity to the cold fluid. This factor leads to an increase in the wall heat transfer rate. Farther downstream, the shear layer originating from the rib re-attaches itself to the wall, and a boundary-layer regime is initiated. Accordingly, the heat transfer rate reaches a maximum, and diminishes later with increasing boundary-layer thickness. For the present discussion, the working fluid is air (Pr=0.7) and the hydrodynamic and thermal boundary-layer thicknesses are close to each other. The role of the slit in the rib is to inject cold fluid in the near-wake of the rib, and increase wall heat transfer in this region. The amount of fluid injected is quite small for β<30%, and cannot influence the temperature profiles and heat transfer rates in the far-wake. For β>40%, a different trend is followed. The slit can however continue to influence the heat transfer enhancement in the far-field by modifying turbulence production near the rib, as discussed in Sect. 4.3.
The dimensionless temperature and temperature fluctuation profiles for the present experiment are presented in Fig. 9. At x/e=2.5, the solid and the 10% slit rib have the highest mean temperature with the temperature profile being nearly flat. This trend is related to the movement of the fluid particles in the recirculation bubble adjacent to the rib. The steepness of the temperature profile reduces with an increase in the open area ratio because of flow through the slit. The thickness of the thermally affected zone at x/e=2.5 is the highest for the 10% slit rib, and lowest for the 50% slit rib. The slit rib with open area ratios of 40 and 50% have smaller thermal boundary layer thickness because of insignificant interaction between the flow in the lower part with the upper. The temperature profiles of 40 and 50% slit ribs are similar at x/e=2.5, 5.0 and 7.5. Thus, for large slit openings, Fig. 9 indicates a heat transport mechanism that is driven by a smaller reattachment zone due to the flow past the lower portion of the slit rib.

Non-dimensional time-averaged temperature and rms temperature profiles for solid rib and slit rib; β=10, 20, 30, 40 and 50%; Re=32,100
At x/e=5.0, the temperature profile for the solid rib is similar to that of the 10% slit rib, and is in agreement with the data in Fig. 2. The 20 and 30% slit ribs have similar temperature profiles at x/e=5.0. The bulk temperature of the 20 and 30% slit ribs is less than 10% slit rib and solid rib due to the larger cold flow through the slit. Farther downstream, namely x/e=13.5, 16.0 and 23.5, the difference in temperature profiles among various types of ribs diminishes. However, the 40 and 50% slit ribs have a lower bulk temperature in the far-field, indicating that the cumulative heat transfer up to the particular location, say x/e=16, was ineffective.
The temperature fluctuations of Fig. 9 respond strongly to the slit size in the near-wake, though a trend towards a universal behavior is seen in the far-field. Temperature fluctuations can be associated with the gradient in the time-averaged temperature profile through the production mechanism \({\left( { - \overline{{{v}\ifmmode{'}\else$'$\fi{T}\ifmmode{'}\else$'$\fi}} \frac{{\partial \ifmmode\expandafter\bar\else\expandafter\=\fi{T}}}{{\partial y}}} \right)}.\) In addition, the local temperature fluctuation contribution is also influenced by the transport of temperature fluctuation due to the v-fluctuation, diffusion and dissipation (Launder 1988). For a solid rib, they are the largest closer to the solid wall, and in the region occupied by the shear layer. In the presence of a slit, additional regions of large temperature gradients result in local maxima and minima in the temperature fluctuations. The higher value of near-wall temperature fluctuation is primarily due to the production mechanism as the temperature gradient is higher in this region. However, the temperature fluctuation at locations away from the wall is influenced by the turbulent heat flux \({\left( { - \overline{{{v}\ifmmode{'}\else$'$\fi{T}\ifmmode{'}\else$'$\fi}} } \right)}\) as well as the transport of temperature fluctuation \({\left( {\frac{\partial }{{\partial y}}\overline{{{T}\ifmmode{'}\else$'$\fi^{2} {v}\ifmmode{'}\else$'$\fi}} } \right)},\) hence the vrms profile of Fig. 6 with the temperature fluctuation profile of Fig. 9.
At x/e=5.0, the distribution of Trms for the 40 and 50% slit ribs is different from that at x/e=2.5. A peak is observed at y/e=0.5 for the x/e=2.5 location while there is no peak at x/e=5.0. The absence of the second peak in temperature fluctuation for 40 and 50% slit rib in comparison to other ribs correlates to the lower value of temperature fluctuation transport due to the low v-velocity for these slit ribs (Fig. 4). The temperature fluctuations are significant in the near-wall region, and drop to the free stream value at the edge of the thermal boundary layer. This is due to a reduction in the velocity fluctuations at x/e=5.0 starting from x/e=2.5. However, the temperature gradient in the near-wall region at x/e=5.0 is higher than that at x/e=2.5 resulting in a higher value of temperature fluctuation production at this location in Fig. 9. At x/e=7.5, the peak value of the temperature fluctuation is smaller in comparison to that of x/e=5.0 for a solid rib and slit rib (β=10, 20 and 30%) due to the combined reduction in temperature gradient as well as the turbulent heat flux. At x/e=13.5, 16.0 and 23.5, the temperature fluctuations are high near the wall and decrease away from it. From the temperature profile in Fig. 9, the high temperature gradient region can be seen to be small and is located close to the wall. Hence a significant temperature fluctuation is observed in this small region.
The temperature profiles for the solid and slit ribs in wall coordinates are compared in Fig. 10. The logarithmic law of the wall is also included for comparison. In the far-field region (x/e>7.5), the temperature profiles for both the solid and slit ribs converge to a universal distribution. The slope of this distribution in the logarithmic regime is smaller than that for the smooth flat plate, for which the slope is 5.5. Hirota et al. (1994) did observe the slope of the logarithmic law for the rough duct to be about to 4.3. Figure 11 shows that the difference in slope of the law of the wall between a smooth duct and the rib-roughened passage is dependent on the open area ratio. The slope of the smooth duct is approached with an increase in the open area ratio, the 50% slit rib showing the closest match with the smooth duct. In comparison to the velocity profile in wall coordinates of Fig. 5, the temperature profile for the rib-roughened wall approaches that for the smooth duct over a shorter distance. This result is in agreement with the observations of Hirota et al. (1994), that for rough surfaces, turbulent transport of heat is inferior to that of momentum.

Temperature profiles in wall co-ordinates at different streamwise locations for solid rib and slit rib; β=10, 20, 30, 40 and 50%; Re=32,100

Smoke visualization of flow over solid rib and slit rib (open area ratio, β=10, 20, 30, 40 and 50%; Reynolds number based on rib height is 4,000.
4.5 Flow visualization
To explain the flow mechanism responsible for heat transfer enhancement, flow visualization studies were carried out in a smoke tunnel facility. A scaled-up rib was used in the experiments. The flow visualization images are shown in Fig. 11. The smoke lines reveal the nature of flow through the slit and its interaction with the wake of the rib. The images show that flow separates at the upstream top corner of the rib. A weak recirculation pattern is formed ahead of the rib at its base. For small open area ratios, the flow in the slit is like a jet that is deflected vertically upwards with the recirculation bubble. The jet straightens up for larger slits due to the larger momentum of flow through the slit. For open area ratios greater than 30%, the rib effectively acts as a pair of rectangular obstacles, one of which is placed on the surface, while the other is held in the free stream. A time sequence of images for β=40 and 50% showed unsteady vortices from the portion of the rib held in the free stream. A comparison of the smoke lines for small values of β (<30%) indicates that heat transfer from the wall is vortex-driven in the near-wake of the rib. The role of the slit is to introduce cold fluid in the recirculation region on one hand, and decrease its size on the other, in agreement with Fig. 2. These factors increase the near-field Nusselt number, advance the position of the maximum in Nusselt number, but do not significantly thicken the thermal boundary layer after the reattachment point. Thus, they lead to an improvement in performance with respect to the solid rib. For larger open area ratios, through-flow in the slit is higher, but the recirculation zone is small, being scaled by the lower half of the rib. Reattachment of the shear layer to the wall occurs earlier, but the smaller rib ensures a lower maximum in the Nusselt number. The detached portion of the rib does not contribute to enhancement of wall heat transfer. Thus, larger open area ratios are seen to be detrimental to increase in heat transfer with respect to the solid rib.
4.6 Power spectra
In this section, the behavior of discrete Fourier modes in the flow generated by different flow geometries is explored, with particular emphasis on the v-velocity. These have been drawn at different streamwise and transverse locations and presented in Fig. 12. Three streamwise locations were selected; x/e=2.5 and 5.0 correspond to a point within the reattachment region, and 7.5 corresponds to the near-reattachment region. Two normal locations were selected; y/e=0.1 is the near-wall region and y/e=1.5 is the outer region of the shear layer.

The dimensionless v’-velocity spectra at different streamwise (x/e) and wall normal (y/e) locations for solid rib and slit rib; β=10, 20, 30, 40 and 50%; Re=32,100
The spectra contain information about the distribution of the turbulent kinetic energy among the small and the large eddies, the extent to which the turbulence mechanisms are fully developed and the possibility of isolated harmonics that are shed from the rib. The areas under the curve of the individual dimensional spectra give a measure of the mean square velocity fluctuation. The v-velocity spectra in Fig. 12 do not show significant variation in the streamwise direction at the near-wall region. The slope of the spectra in the inertial sub-range, however, varies both in the streamwise and normal directions, revealing the non-equilibrium nature of the turbulent boundary layer behind the rib. The universal spectra of a fully developed turbulent boundary layer (Hinze 1979), with a slope of −5/3, were seen for all open area ratios, when x/e>13.5.
Clear spectral peaks are to be observed in Fig. 12 for the 40 and 50% slit ribs at the y/e=1.5 location, while no clear peak is observed in the near-wall (y/e=0.1) region. As a clear dominant spectral peak is observed close to the top of the slit rib, it is proposed here that the periodic fluctuations originate at this location. The Strouhal numbers based on the transverse dimension of the detached rib and average incoming velocity are 0.19 and 0.16 respectively for the 40 and 50% slit ribs. The aspect ratio of the rectangular rib is 3.4 and 4.2 for these ribs, and the respective Reynolds numbers based on the transverse dimension are 570 and 463 respectively. The Strouhal numbers reported in Okajima (1982) at these Reynolds numbers are 0.18 and 0.13 for the 40 and 50% slit ribs respectively. This match supports the proposal that the 40 and 50% slit ribs create independent bluff objects placed in uniform flow.
5 Conclusions
Convective heat transfer in the entrance region of a rectangular channel with a surface mounted slit rib was investigated using hot-wire anemometry, cold-wire anemometry, liquid crystal thermography and smoke flow visualization. The open area ratios of the slit rib set during the experiment are equal to 10, 20, 30, 40 and 50%. The nominal Reynolds number based on the hydraulic diameter of the channel is 32,100. Time averages and turbulent statistics of two components of velocity and temperature, smoke visualization images and surface Nusselt number plots have been reported. The important findings of the study are summarized below.
-
1.
For a solid rib, the secondary flow brings cold outer flow to the vicinity of the wall and increases heat transfer. For large open area ratio slit ribs (β=40 and 50%), the secondary flow through the slit plays a negligible role on the shear layer modification. However, for intermediate open area ratios (β≤30%), the flow through the slit offers a positive impact on both the surface heat transfer enhancement and pressure penalty. This flow influences the unsteadiness of the recirculation bubble, which in turns influences the heat transfer in the pre-reattachment region.
-
2.
Heat transfer augmentation of a slit rib is higher than the solid rib with 20% open area ratio being an optimum.
-
3.
A reduction in pressure penalty for the slit rib is realized in terms of the friction factor due to the mass and momentum addition into the wake region behind the rib leading to drop in momentum deficit.
-
4.
For the slit rib with a higher open area ratio (β=40 and 50%), the lower part of the slit rib behaves as a small independent rib with its own reattachment region. This adversely affects the heat transfer enhancement due to the weakening of the reattachment zone. The top portion of the 40 and 50% slit rib behaves as an independent rectangular bluff body mounted in the free stream with clear vortex shedding.
-
5.
Heat transfer enhancement correlates with the transverse velocity component and its temporal fluctuation.
Abbreviations
- e :
-
Rib height, m
- f :
-
Friction factor based on the pressure drop in the duct over the length of the test section
- L r :
-
Reattachment length
- Nu :
-
Span-wise averaged Nusselt number as a function of x
- \(\overline{{Nu}} \) :
-
Plate-averaged Nusselt number
- Re :
-
Reynolds number based on the hydraulic diameter of the duct and average velocity
- Re e :
-
Reynolds number based on the rib height and average velocity
- T(x, y):
-
Fluid temperature distribution, dimensionless
- u, v :
-
Local velocity components in Cartesian coordinates scaled by the duct-averaged velocity
- u′′, v’′:
-
Local velocity fluctuations in Cartesian coordinates scaled by the duct-averaged velocity
- \( - \overline{{{u}\ifmmode{'}\else$'$\fi{v}\ifmmode{'}\else$'$\fi}} \) :
-
Turbulent shear stress non-dimensionalized by the square of the average velocity
- U avg :
-
Duct-averaged velocity, m/s
- x, y:
-
Streamwise and wall normal coordinates respectively (Fig. 1)
Fig. 1 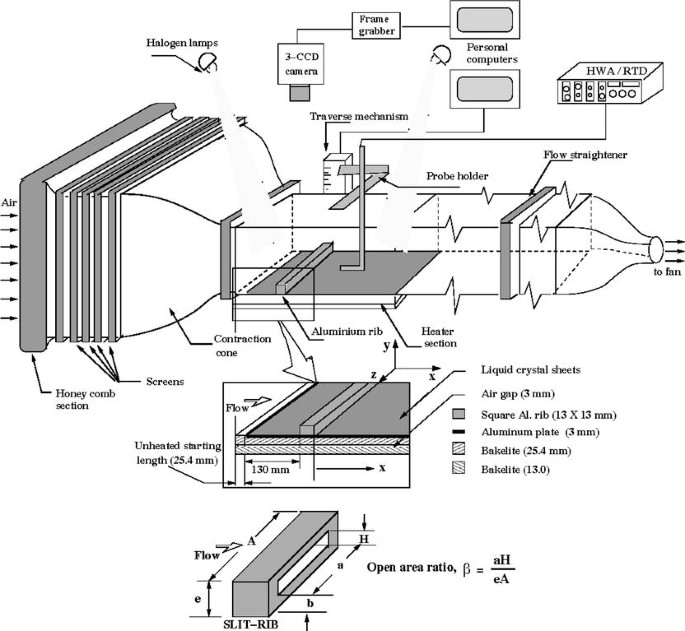
Schematic diagram of flow system, coordinate system and instrumentation
- β :
-
Open area ratio, %
- δ :
-
Velocity boundary layer thickness, m
- δ T :
-
Thermal boundary layer thickness, m
- avg:
-
Average
- o:
-
Smooth passage
- rms:
-
Root mean square
- w:
-
Wall
- ∞:
-
Free stream
- +:
-
Wall coordinate
- ′:
-
Fluctuating quantity

References
Acharya S, Panigrahi PK (2003) Analysis of large scale structures in separated shear layers, experimental. Therm Fluid Sci 27(7):817–828
Acharya S, Dutta S, Myrum TA, Baker RS (1993) Periodically developed flow and heat transfer in a ribbed duct. Int J Heat Mass Transf 36:2069–2082
Aliaga DA, Lamb JP, Klein DE (1994) Convective heat transfer distributions over plates with square ribs from infrared thermography measurements. Int J Heat Mass Transf 40:363–374
Baughn JW (1995) Liquid crystal methods for studying turbulent heat transfer. Int J Heat Fluid Flow 16:365–375
Bruun HH (1994) Hot-wire anemometry. Oxford University Press, New York, pp 147–156
Cavallero D, Tanda G (2002) An experimental investigation of forced convection heat transfer in channels with rib turbulators by means of liquid crystal thermography. Exp Therm Fluid Sci 26:115–121
Chen TY, Du RK (2003) Effects of velocity fluctuations on heat transfer enhancement. Exp Fluids 34(5):548–555
Chyu MK, Natarajan V (1993) Effects of a slit in a rib on the heat transfer from a rib-mounted wall. Am Soc Mech Eng J Heat Transf 115:792–796
Ekkad SV, Han JC (1997) Detailed heat transfer distributions in two-pass square channels with rib turbulators. Int J Heat Mass Transf 40:2525–2537
Han JC, Zhang YM (1992) High performance heat transfer ducts with parallel, broken and V-shaped broken ribs. Int J Heat Mass Transf 35:513–523
Hinze JO (1979) Turbulence, 2nd edn. McGraw-Hill, New York, pp 83–174
Hirota M, Fujita H, Yokosawa H (1994) Experimental study on convective heat transfer for turbulent flow in a square duct with a ribbed rough wall (characteristics of mean temperature field). Am Soc Mech Eng J Heat Transf 116:332–340
Hwang JJ (1998) Heat transfer-friction characteristic comparison in rectangular ducts with slit and solid ribs mounted on one wall. Am Soc Mech Eng J Heat Transf 120:709–716
Kays WM, Crawford ME (1993) Convective heat and mass transfer. McGraw-Hill, New York
Kukreja RT, Lau SC, McMillin RD (1993) Local heat/mass transfer distribution in a square channel with full and V-shaped ribs. Int J Heat Mass Transf 36:2013–2020
Launder BE (1988) On the computation of heat transfer in complex turbulent flows. Am Soc Mech Eng J Heat Transf 110:1112–1128
Liou T-M, Chang Y, Hwang D-W (1990) Experimental and computational study of turbulent flows in a channel with two pairs of turbulence promoters in tandem. Am Soc Mech Eng J Heat Transf 112:302–310
Liou T, Wang W, Chang Y (1995) Holographic interferometry study of spatially periodic heat transfer in a channel with ribs detached from one wall. Am Soc Mech Eng J Heat Transf 117:32–38
Mochizuki S, Murata A, Shibata R, Yang WJ (1999) Detailed measurement of local heat transfer coefficients in turbulent flow through smooth and rib-roughened serpentine passages with a 180° sharp bend. Int J Heat Mass Transf 42:1925–1934
Okajima A (1982) Strouhal numbers of rectangular cylinders. J Fluid Mech 123:379–398
Panigrahi PK, Acharya S (1999) Mechanisms of flow transport in a turbine blade coolant passage of a rib-turbulator. Am Soc Mech Eng J Turbomach 121:152–159
Panigrahi PK, Acharya S (2004) Multi-modal forcing of the turbulent separated shear flow past a rib. Am Soc Mech Eng J Fluids Eng 126:22–31
Panigrahi PK, Tariq A (2003) Liquid crystal heat transfer measurements in a rectangular channel with solid and slit rib. J Flow Vis 6:407–416
Schlichting H (1979) Boundary layer theory, 7th edn. McGraw-Hill, New York, pp 564–570
Sparrow EM, Tao WQ (1983) Enhanced heat transfer in a flat rectangular duct with streamwise-periodic disturbances at one principal wall. Am Soc Mech Eng J Heat Transf 105:851–861
Swaminathan MK, Rankin GW, Sridhar K (1986), Evaluation of the basic systems of equations for turbulence measurements using the Monte Carlo method. J Fluid Mechanics 170:1–19
Tariq A, Panigrahi PK (2003) Flow and heat transfer in a rectangular duct with single-rib and two-ribs mounted on the bottom surface. J Enhanced Heat Transf 10:171–198
Torii K, Nishino K, Nakatama K (1994) Mechanism of heat transfer augmentation by longitudinal vortices in a flat plate boundary layer. In: Proc 10th Int Heat Transf Conf, Brighton, UK 6:123–128
Author information
Authors and Affiliations
Corresponding author
Rights and permissions
About this article
Cite this article
Tariq, A., Panigrahi, P.K. & Muralidhar, K. Flow and heat transfer in the wake of a surface-mounted rib with a slit. Exp Fluids 37, 701–719 (2004). https://doi.org/10.1007/s00348-004-0861-8
Received:
Accepted:
Published:
Issue Date:
DOI: https://doi.org/10.1007/s00348-004-0861-8