
Abstract
One of the most important measures of offspring performance is growth rate, which is often traded off against another important survival trait, immune function. A particular feature of ostrich chicks maintained in farmed environments is that cohorts of chicks vary widely in size. As parents can have a profound effect on the phenotype and fitness of their offspring, we investigated whether chick growth and immune defence were related to variation in levels of immune defence in their genetic parents. As secondary sexual traits of sires could serve as indicators of male quality, and be used in female mating decisions, we also investigated whether chick growth rate and immune defence were related to male plumage and integumentary colouration. We found that offspring growth rates and humoral responses were related to the humoral responses of their parents, suggesting that at least some components of humoral immune capacity are heritable. The white colour of male ostrich feathers was correlated to the humoral response and growth rate of their offspring, suggesting that this visual cue involved in the male courtship display could serve as an important signal to females of male quality, thereby forming the basis of mate choice in this species.
Introduction
The vertebrate immune system has evolved to destroy and remove antigens (parasites, viruses and other infections), and hence plays a crucial role in host survival and fitness. Like mammalian immunity, avian immunity is complex and involves innate, cell-mediated and humoral compartments. However, while the development of sophisticated immune responses is important to survival, it also entails short-term (energy, nutrients) and long-term (oxidative stress, autoimmunity) costs (for a review see Hasselquist and Nilsson 2012). A trade-off between immune responses and other life-history traits, in particular survival and growth rate, has been documented in wild bird species (Saino et al. 1997; van der Most et al. 2011), and immune responses to non-pathogenic antigens have been demonstrated to reduce growth in domestic poultry (Klasing et al. 1987), Japanese quails, Coturnix coturnix japonica (Fair et al. 1999) and in a wild population of magpies, Pica pica (Soler et al. 2003).
To date, variation observed in avian offspring immune responses has been demonstrated to be affected by parental care (Saino et al. 1997) and maternal transfer of antibodies (Grindstaff et al. 2003; Hasselquist and Nilsson 2009). However, there is increasing evidence that the ability to mount an immune response is important in mate choice (Johnsen et al. 2000). By choosing a mate with an efficient immune system, parents could acquire mates with better resistance to parasites, resulting in either direct benefits in species with biparental care; but also indirect genetic benefits when offspring inherit genes for superior immunocompetence (Folstad and Karter 1992; Andersson 1994; Westneat and Birkhead 1998; von Schantz et al. 1999). The heritability of immune-related traits has been established not only in poultry species artificially selected for low and high immune responses (Parmentier et al. 1996), but also in wild bird species (Råberg et al. 2003; Cichon et al. 2006).
Moreover, in many bird species, females prefer to mate with the most elaborately ornamented males as many secondary sexual characters demonstrate strong condition dependence, and can be produced only by males in prime condition (Heywood 1989; Andersson 1994; Iwasa and Pomiankowski 1994; Cotton et al 2006). Specifically, plumage colouration is among the most widespread and conspicuous of ornamental traits in birds, and its variation may be a reliable indicator of the general health of an individual (Hill 1991). For instance, brighter plumage and/or integumentary colour, such as bill, leg or skin colouration have been correlated with better nutritional condition (Doucet 2002; Griffith and Pryke 2006) or stronger immune responses (Møller and Petrie 2002; Saks et al. 2003a; Faivre et al. 2003; McGraw et al. 2006; Jacquin et al. 2011). Hence colour variation could signal functional differences in quality and potentially discriminate between potential partners, and ultimately optimize mate choice (McGraw and Ardia 2003; Bortolotti et al. 2006).
In farm conditions, ostrich chicks are predisposed to various infections, diseases and stressors that result in high mortalities, ranging from 10 to 50 % within the first 3 months of age (Verwoerd et al. 1999). Another particular feature of ostriches is that they are fast-growing birds and individuals within the same age cohort often differ greatly in size (Deeming and Ayres 1994; Deeming et al. 1993), particularly during the first three months of their lives (Bunter and Cloete 2004). The causes of such a variation in growth rates are still poorly understood, and could be related to the protein content in the diet (Deeming 1996); social grouping (Deeming and Ayres 1994; Mushi et al. 1998); or disease (Deeming and Ayres 1994). Ostriches are sexually dimorphic and have an unusual mating system in which both males and females have several partners (Bertram 1992; Kimwele and Graves 2003). Therefore, both males and females have multiple opportunities for mate choice, and different combinations of parental genotype appear to lead to considerable variation in offspring size and survival. Interestingly, ostrich females are able to discriminate between males and to invest differently at the egg stage with respect to male traits involved in the courtship display (Bonato et al. 2009a). Furthermore, both cell- and humoral-mediated components of their immune system are reflected by these traits, which only high quality males appear able to maintain (Bonato et al. 2009b). Additionally, ostrich chicks with higher growth rates show intermediate responses to diphtheria–tetanus toxoids (Bonato et al. 2009c), suggesting a cost associated with the maintenance of this component of immune defence. Thus, females that base their mate choice decisions on ornamentation could acquire males with better resistance to parasites and this could potentially explain the wide variation in ostrich growth rates and survival. Therefore, the aim of this study was to investigate (1) whether variation in parental levels of immune defence was related to offspring immune responses and growth rates; and (2) whether male traits (specifically colouration) predicted offspring immune responses and growth rates.
Material and methods
Study population
The study was carried out on South African black ostriches (Struthio camelus var. domesticus), maintained at the research farm of the Western Cape Department of Agriculture in Oudtshoorn, South Africa, from August 2005 to March 2006. The breeding flock consisted of 38 birds maintained in two groups in 8-ha camps with male/female ratios of 7:12 and 8:11, respectively. Eggs were collected on a daily basis, weighed and artificially incubated in electronic incubators until hatching. Chicks were sexed through cloacal examination (Gandini and Keffen 1985), tagged and weighed with an electronic balance (Mercer) once a month, from the day of hatching to 360 days of age. All chicks were allowed to dry off for 8 to 10 h after hatching, and were subsequently transferred to an intensive chick rearing facility where they were kept in groups of 100 to 110 chicks together with chicks from the established breeding flock on the farm. The rearing facility was divided into several stalls where chicks were distributed according to their age. During their first 2 weeks, chicks were maintained at a constant temperature of 25 °C. Thereafter, the temperature was decreased by 1 °C per week, until 2 months old when heating was stopped. Light was provided from 8 am to 5 pm. Food and fresh water were supplied ad libitum. From an age of 3 months, chicks were transferred to outdoor camps.
Parentage determination
Fifty microlitres of blood was collected from the jugular vein of adult birds and day-old chicks and stored in Vacutainer™ tubes kept at 4 °C until parentage analysis could be conducted. DNA was extracted from blood samples using a standard protocol with overnight digestion with proteinase K and phenol/chloroform extraction. The amount of DNA was estimated, and dilutions were made to approximately 1 ng/μL. Genotyping was determined for six primers (CAU1, CAU7, CAU14, CAU17, CAU64, CAU76; Tang et al. 2003), Genemapper 4.0 (Applied Biosystem, Foster City, CA, USA) was used for allele scoring and the parentage assignment was conducted via Cervus 3.0 (Kalinowski et al. 2007; for details see Bonato et al. 2009a). Both camps were analysed separately for the parentage assignment, as some adults in camp 1 and in camp 2 were related.
Colour measurements
Reflectance spectra between 300 and 700 nm were recorded using an Ocean Optics USB 2000 spectrophotometer and a PX-2 xenon lamp (FL, USA) on 5 different traits (bill, neck skin, black feathers, white feathers and legs) on each male. Each trait was measured 10 times in randomly allocated places. Reflection was recorded using a probe held perpendicular to the surface, collecting light from a spot 6 mm in diameter. A white reference (Spectralon 99 % white standard) and a dark reference for calibration were taken before measuring each individual trait (for details, see Bonato et al. 2009b).
Estimates of growth rates
Measurements were retained for growth analysis where birds of known identity had been measured at least twice during the growth period and age was known to within 24 h. Two individuals were not measured at hatching and not all individuals could be followed to maturity. Growth coefficients were estimated following the method of Tjørve and Underhill (2009) in which hatching and asymptotic masses are fixed, allowing the inclusion of truncated observations. Body weight gain in ostriches is commonly described using the Gompertz growth curve (e.g. Cilliers et al. 1995) and, following Tjørve and Underhill (2009), a Gompertz growth rate coefficient (k) for each bird was estimated as:
where the measured mass (in kilogram) took the value M 1 on calendar date t 1, and M 2 on date t 2, and M A was the asymptotic mass. Where more than two observations (n) existed for the same individual, then m = n(n − 1) / 2 values for k were found by comparing all pairs of observations, and the median of the m values was taken as the estimate of k for that individual (Tjørve and Underhill 2009). Using a Gompertz curve of the form
(e.g. Ricklefs and Webb 1985), yields b = −log (M H / M A ) when t = 0, such that growth could be modelled starting from the hatching mass, M H, at time t = 0. M A (the asymptotic mass) was fixed as 119 kg for males and 122 kg for females (the maximum values recorded in the dataset) and M H was 0.85 kg for males and 0.82 kg for females (the mean weights from all chicks measured at hatching).
Immune responses
We estimated two measures of immunocompetence: the T cell-mediated immune response and the B cell humoral response. We first assessed the T cell-mediated immune responses on adults and 4-month-old chicks; and then the B cell humoral immune response a month later, in order to minimise interaction between the two tests.
The T cell-mediated immune response was measured using a phytohemagglutinin (PHA) injection. Although this is a standard method of assessing cell-mediated immunity in poultry (Cheng and Lamont 1988), recent studies on house sparrows Passer domesticus (Martin et al. 2006) and zebra finches Taeniopygia guttata (Vinkler et al. 2010) have shown that PHA swelling is more complex than previously thought: it is correlated with cell-mediated components of the immune system, but not exclusively so, as some of the swelling is attributable to other aspects of immune function, both innate and adaptive. Our results should thus be interpreted in this context. Birds were inoculated sub-dermally with 0.4 mg of a PHA solution (Sigma, L-8754) dissolved in 0.04 mL of phosphate-buffered saline (PBS) in the right wing web, and with 0.04 mL of PBS in the left wing, as a control test. We measured the thickness of the wing webs on three occasions: before the injection, 6 and 24 h later. On each occasion we used a digital calliper and measured the thickness of the wing web three times and used the mean of these measures. Repeatability of measurements (Lessells and Boag 1987) were 0.79 and 0.82 for the adults (P < 0.001, N = 38) and 0.82 and 0.85 for the chicks, for the right and left wing respectively (P < 0.001, N = 74). Smits et al. (1999) recommends eliminating the PBS injection, but because we observed slight swellings at the point of injection when using a control injection, we decided to include it in our study. The wing-web swelling was calculated as the difference in thickness of the PHA-injected versus the PBS-injected wing, which indicates the strength of the response to the PHA injection.
To measure the B cell-mediated humoral response, we elicited an antibody response in the birds by injecting a solution of 0.5 ml of a diphtheria–tetanus vaccine subcutaneously. Blood samples were collected from the jugular vein in Vacutainer tubes before the injection, and 10, 14, 21, and 30 days post-injection. Within 30 min, samples were centrifuged (4,000 rpm for 10 min) and plasma was stored at −70 °C. To assess the level of antibodies in the plasma, we then conducted an enzyme-linked immunosorbent assay (Hasselquist et al. 1999; Råberg et al. 2003; Hanssen et al. 2004; for details, see Bonato et al. 2009b). Final measures of antibody levels were expressed as the difference between baseline and post-immunization antibody titres of individuals.
Sample sizes and statistics
Thirty-eight adults and 396 chicks were genotyped for parentage analysis. Briefly, reproductive skew was observed in both sexes where each male and female mated with several partners, but a few combinations of parents sired more chicks than others (for details see Bonato et al. 2009a). Because of high chick mortality (62 % during the first 3 months post-hatching), we were able to calculate the growth rates of only 75 chicks (35 males and 40 females), and for this study, we used immune responses of a sub-sample of chicks (74 chicks for the PHA injection response; 34 chicks for the humoral response) for which we had established pedigrees.
Cell-mediated responses and antibody titres of the humoral responses were log-transformed to achieve normally distributed residuals. We used repeated-measurements ANOVA to detect any differences in the strength of the responses across time and between sexes for both the cell-mediated and humoral responses.
A principal component analysis (PCA) was performed on the reflectance spectra for all five traits for each male, and reduced a number of highly correlated variables (reflectance at 2.4 nm intervals) to a small number of independent variables. The PCA on colour measurements revealed that three principal components explained between 95.8 % and 98.9 % of the total variance in the five traits measured (for details see Bonato et al. 2009a). In reflectance spectra of natural objects, the first principal component (PC1) is usually relatively flat, in which case it describes achromatic variation or “achromatic brightness” (Endler and Théry 1996). The second and third principal components (PC2 and PC3) therefore describe variation in spectral shape and are indirectly related to hue and saturation (Endler 1990). Briefly, PC1 summarized between 70.5 and 94.8 % of the spectral variation in these traits, whereas PC2 and PC3 accounted for 3.3–17.5 % and 0.8–7.8 %, respectively.
To investigate relationships between parental and offspring immune responses, three similar Generalized Linear Mixed Models (GLMM) were performed on the response to PHA injection, diphtheria and tetanus injection. These models were defined with a lognormal distribution to generate normal residuals and homogeneous variances. Offspring immune response was entered as the dependent variable, offspring sex and hatching date were entered as fixed effects, while parental immune responses (and their interaction), as well as offspring growth rate were entered as covariates. This was appropriate as chick growth rate is influenced by immune responses, and both PHA injection responses and humoral responses decrease with chick hatching date (Bonato et al. 2009c). The identification of parents and combinations of parents were entered as random factors to control for multiple mating. Furthermore, we calculated heritability estimates of each immune responses (and their standard errors) as twice the coefficient from a linear regression of offspring values on parent values (Falconer and Mackay 1996).
To investigate the relationship between parental immune responses and chick growth rates, we conducted a similar GLMM with growth rate as the dependent variable, hatching date and offspring sex were entered as fixed factors while parental PHA injection response, diphtheria and tetanus responses (and their interaction), parents’ growth rates and their interaction (as these display heritability: Bunter and Cloete 2004), offspring response to PHA injection, diphtheria and tetanus injection as covariates. The identification of parents, and the interaction between parents, were entered as random factors, to control for repeated measures of individuals and parental combinations.
Finally, we investigated the relationship between chick immune responses/growth rates and sire’s traits. We performed four similar GLMMs with chick immune response to PHA injection, tetanus and diphtheria response/growth rate as dependent variables; spectrophotometric measurements of the male’s feathers, bill, neck and legs as explanatory variables; hatching date and chick sex as fixed factors; and sire’s identity as a random factor.
The significance of fixed effects (factors and covariates) in the GLMMs were examined using Wald-type adjusted F statistics and the effect with the highest P value was sequentially dropped until only significant terms (P < 0.05) remained in the model (Jones and Taylor 1999). To compensate for multiple comparisons, we controlled for False Discovery Rate using the Excel-based spreadsheet program developed by Pyke (2011), and reported P values adjusted accordingly (Storey 2003).
Furthermore, all the final models were checked for the presence of multivariate outliers with high leverage using the iterative Grugg’s test (GraphPadPrism version 6.00 for Windows). Two values on the regression fit for parents and offspring responses to tetanus had high leverage and were subsequently excluded from the analysis. All other statistics were performed using Genstat 12th Edition (Payne et al. 2009).
Results
-
(a)
Response to PHA injection
Cell-mediated immune responses in adults (N = 38) were highly variable between individuals and higher 24 h after the injection, although not significantly different from 6 h post-injection (6 h: mean ± SD = 2.75 ± 2.26 mm ; 24 h: mean ± SD = 3.38 ± 3.28 mm, F 1,1 = 3.12, P = 0.09). We did not find any effect of sex on this aspect of immune response (F 1,37 = 0.05, P = 0.83). We found a positive correlation between the strength of the cell-mediated response 6 and 24 h post-injection (r = 0.62 ± 0.05, P = 0.001, N = 38). For subsequent analysis, we used the strongest response to the stimulation of the cell-mediated response (24 h post-injection). We found similar results for the chicks, in which cell-mediated response was highest 24 h post-injection. No effect of offspring sex was detected (F 1,73 = 0.38, P = 0.54, N = 74), and so we combined the data across sexes.
-
(b)
Response to tetanus and diphtheria antigens
The primary antibody responses for both diphtheria and tetanus in adults were highest 21 days after the injection (diphtheria: F 1,3 = 216.31, P = 0.001; tetanus: F 1,3 = 166.69, P = 0.001). Only when examining the response to diphtheria did we find an effect of sex, where females had higher responses than males 21 days and 30 days after the injection (21 days: t = 2.47, P = 0.02, df = 36; 30 days: t = 2.31, P = 0.03, df = 36: Fig. 1). We found a significant correlation between the response to diphtheria and the response to tetanus after controlling for sex (r = 0.61 ± 0.08, P = 0.001, N = 38). For subsequent analysis, we used the strongest humoral response (21 days post-injection). We found similar results for the chicks (N = 34), in which the highest response to the diphtheria–tetanus vaccine was also found 21 days post-injection (Bonato et al. 2009c).
Fig. 1 
Humoral responses to a diphtheria and b tetanus in 38 adult ostriches (15 males and 23 females) using a diphtheria–tetanus vaccine injection. Grey bars indicate males; white bars females. Diphtheria (a) and tetanus (b) antibody production was measured 10 (T10), 14 (T14), 21 (T21) and 30 (T30) days after a first injection with the vaccine. The asterisks indicate sex differences in the antibody response (P < 0.05)
-
(c)
Relationships between the immune function of parents and their offspring.
The analysis of potential relationships between the parental and offspring ability to raise an immune response revealed that both the father and mother’s (and their combination) response to diphtheria predicted the chick’s response to diphtheria (Wald test: W = 11.42, df = 33, P = 0.044; W = 17.30, df = 33, P = 0.024; and W = 6.32, df = 33, P = 0.012 respectively; Fig. 2a). Similar results were found for the response to tetanus (father’s response: W = 19.30, df = 31, P = 0.022; mother’s response: W = 20.26, df = 31, P = 0.018; and father × mother: W = 4.95, df = 31, P = 0.038; Fig. 2b). In accordance with this, heritability estimates for antibody response to diphtheria and tetanus were 0.56 ± 0.27 (P = 0.017) and 0.51 ± 0.47 (P = 0.305) respectively. Furthermore, females with higher responses to diphtheria and tetanus were found to mate with males with higher responses to diphtheria (r = 0.42, F 20,74 = 7.73, P = 0.001) and tetanus (r = 0.58, F 20,74 = 3.56, P = 0.001). However, no relationship between parental and offspring responses to PHA injection was found (father: W = 0.82, df = 73, P = 0.374; mother: W = 0.42, df = 73, P = 0.519). The heritability estimate for the response to PHA injection was 0.11 ± 0.10 (P = 0.305).
Fig. 2 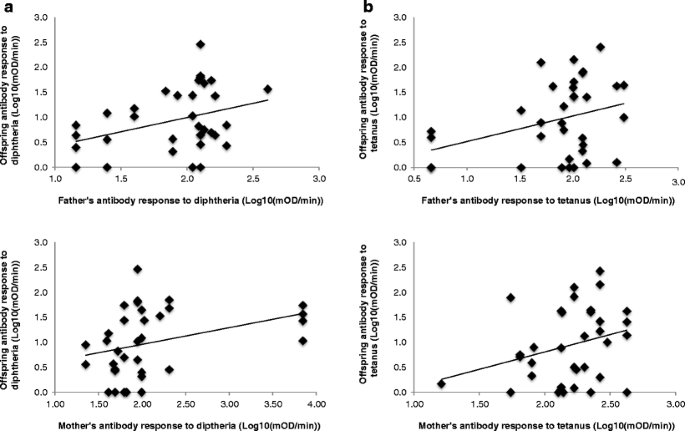
The relationship between parental (N = 38) and offspring immune responses (N = 74) to a diphtheria–tetanus vaccine in ostriches. a Parental and offspring responses to diphtheria; b parental and offspring responses to tetanus
-
(d)
Relationship between parental immune function and offspring growth rate.
The analysis of chick growth rates in relation to parental ability to raise an immune response revealed that the mother’s response to PHA injection and her offsprings’ growth rates were positively correlated (W = 8.44, df = 74, P = 0.007), but not the father’s response to PHA injection and his offspring growth rates (W = 2.78, df = 74, P = 0.120). We also found that the responses of both parents to diphtheria (and their interaction) were positively correlated with offspring growth rate (father: W = 103.79, df = 74, P < 0.001; mother: W = 25.12; df = 74, P < 0.001; father × mother: W = 54.27, df = 73, P < 0.001; Fig. 3a). Similar results were found between parental responses to tetanus and offspring growth rate (father: W = 78.87, df = 74, P < 0.001; mother: W = 41.90, df = 74, P < 0.001; father × mother: W = 15.94, df = 73, P < 0.001; Fig. 3b).
Fig. 3 
The relationship between parental humoral responses (N = 38) to a diphtheria–tetanus vaccine injection and growth rate coefficients (k) of 75 ostrich chicks. a Parental response to diphtheria and offspring growth rate; b parental response to tetanus and offspring growth rate
-
(e)
Male colouration and offspring immune responses and growth rates.
The analysis revealed that only PC2 values of the father’s white feathers predicted chick responses to diphtheria (W = 5.01, df = 33, adjusted P value = 0.031; Fig. 4a), while both PC2 values for white feathers and bill predicted chick growth rate (white feathers: W = 1.79, df = 74, adjusted P value = 0.034; bill: W = 4.79, df = 74, P = 0.032, adjusted P value = 0.034; Fig. 4b).
Fig. 4 
Ostrich chick immune response and growth rate are predicted by the colouration (reflected by PC2) of white feathers and bill of their sires: a chick immune response to diphtheria and PC2 values for white feathers; b chick growth rate coefficients (k) and PC2 values for bill and white feathers


Discussion
Our findings revealed that parents’ humoral responses predicted both chick humoral responses and growth rates. Parents with higher responses to the diphtheria and tetanus toxoids had offspring producing higher responses to both toxoids, as well as higher growth rates. By contrast, there was no significant relationship between parent and chick responses to PHA injection, and only the mother’s response to PHA injection predicted offspring growth rate. Additionally, the colouration of the father’s white feathers was found to predict offspring response to diphtheria, while the colouration of both the father’s white feathers and bill predicted offspring growth rate.
The relationships between parental immune responses and offspring immune responses and growth suggest that at least some aspects of the humoral immune system are heritable in this species. There is equivocal evidence for heritability in immune-related traits in birds: heritability for antibody responsiveness to diphtheria and tetanus toxoids has been established in blue tits, Parus caeruleus, with tetanus having far greater heritability than diphtheria (Råberg et al. 2003), as has responsiveness to sheep red blood cells in barn owls, Tito alba (Roulin et al. 2000) and cell-mediated responses to PHA in the great tit, Parus major (Brinkhof et al. 1999). In our study, no relationship between parental and offspring responses to PHA injection was evident. However, previous studies suggest that responses to the PHA injection are affected more by condition or rearing environment, both in chicks and in adult birds (Birkhead et al. 1999; Lifjeld et al. 2002; Kilpimaa et al. 2005) compared with humoral responses (Råberg et al. 2003). As both ostrich chicks and adults were provided with ad libitum food, potential variations in cell-mediated responses between individuals (and particularly in males) may have been masked.
Studies in avian species have demonstrated that females may respond to the degree of male attractiveness by investing in larger clutches (Petrie and Williams 1993), larger eggs (Cunningham and Russell 2000; Bonato et al. 2009a) or by transferring more androgens or immunoglobulins into the egg yolk (Gil et al. 1999; Saino et al. 2002; Hasselquist and Nilsson 2009; Hasselquist et al. 2012). Female ostriches tend to lay eggs of different weight in relation to the colouration of specific male traits (the most important being his white feathers), suggesting that females assess males and invest accordingly (Bonato et al. 2009a). As faster-growing ostrich chicks show intermediate responses to diphtheria–tetanus toxoids—highlighting the cost associated with maintaining this component of immune defence (Bonato et al. 2009c)—the wide variation in chick growth rate could be at least partially explained by female mate choice, combined with differential allocation of resources by females to offspring fathered by attractive males. Thus, the reported levels of heritability of ostrich responses to diphtheria and tetanus (section c of “Results”), may be inflated by maternal effects, as for example, reported recently for heritability of boldness and aggressiveness in zebrafish Danio rerio (Ariyomo et al. 2013).
The positive relationship between the sire’s colouration (as reflected by PC2 values for white feathers and bill) and offspring immune response and growth rate suggest respectively that offspring from more colourful males are in better condition (as they grow faster), and are more likely to survive (as they are more immunocompetent). Interestingly, several components of the plumage and integumentary colouration of male ostriches have been found to indicate different aspects of male quality (Bonato et al. 2009b). Specifically, white feathers have been demonstrated to reflect a male’s ability to raise an antibody response to diphtheria, while bill colouration was related to the heterophile/lymphocyte ratio, a crude estimation of a bird’s current immune stress (Gross and Siegel 1983; Krams et al. 2012). The immunocompetence handicap hypothesis (ICHH) predicts that only high quality individuals are able to invest both in high immunocompetence and elaborate ornament expression (Folstad and Karter 1992; Norris and Evans 2000). Gil and Culver (2011) provide support for the ICHH, finding that male spotless starlings with exaggerated ornaments (feathers) and high testosterone concentrations may counteract the inhibitory action of testosterone by some compensatory mechanism. In captive greenfinches, Carduelis chloris, males with brighter yellow breast feathers showed stronger humoral immune responses, but no relationship between plumage colouration and PHA responses was evident (Saks et al. 2003b). In ostriches, white feathers serve as similar indicators of male quality (or ‘good genes’), informing a female of a male’s humoral immune resistance. Females could enhance the fitness of their offspring through mate choice if offspring inherit their father’s humoral immune function, and consequently grow faster, ultimately increasing female fitness. This reasoning is in accordance with our previously described results on the positive relationship between the humoral response of parental dyads and the humoral response and growth rates of their offspring.
Interestingly, we found that males had lower diphtheria responses compared to females. The ICHH predicts that androgens (such as testosterone) suppress immune function through direct interactions with receptors of immune cells or through indirect routes such as elevation of stress hormone levels or increased costly behavioural activities (Owen-Ashley et al. 2004). However, studies on the effect of testosterone on the expression of sexual ornamentation, immunity and sexual strategies have showed contrasting results across species (Roberts et al. 2004; Boonekamp et al. 2008). In male ostriches, the level of testosterone increases with the level of aggression between males, and aggression is characterized by forward kicking, where white feathers are directly exposed to opponents (Bertram 1992), once again emphasizing their crucial role. Hasselquist (2007) has suggested as an alternative explanation, the “mating season stress hypothesis” by which stress hormones (such as corticosterone) act to suppress immune function: the sex with the highest variance in reproductive success (often males, as in the case of ostriches: Kimwele and Graves 2003; Bonato et al. 2009a) may suffer suppressed immune function during the breeding season, due to greater investment in courtship displays, interactions with competitors and the development of secondary sexual characters (Zuk 1994; Norris and Evans 2000; Stoehr and Kokko 2006). Our data support this hypothesis in so far as breeding adult male ostriches—as compared to females—do experience difficulty in mounting immune responses to diphtheria.
Most models of mate choice have underestimated the importance of male choice in the evolution of mating systems (Johnstone et al. 1996). There is increasing evidence that both sexes show some degree of choosiness (Servedio and Lande 2006; Lihoreau et al. 2008) and may carry ornaments that signal some aspects of their quality to potential partners and competitors (Doutrelant et al. 2008; Hanssen et al. 2008; Zanollo et al. 2012). In several bird species, males were found to prefer ornamented females (Amundsen et al. 1997; Cornwallis and Birkhead 2006) and differentially allocate sperm to particular breeding attempts (Cornwallis and Birkhead 2007). Although we do not have any measurements on female ornamentation, both males and females should show some degree of choosiness as they both incur similar reproductive costs (i.e. parental care). The observation that ostrich parents appear to mate assortatively, in relation to their ability to raise a humoral response, suggests male mate choice.
In conclusion, this study shows that some aspects of humoral response are heritable, as parents producing higher immune responses produced offspring with both higher immune responses and higher growth rates. Additionally, the colour of the father’s white feathers and bill predicted both growth rate and humoral response of his offspring. As the white colour of male ostrich feathers has previously been found to predict his ability to raise an immune response (i.e. response to diphtheria) and bill colour provides a general indication of the current immune system status of males, we suggest that these traits are visual cues serving as important honest signals of male quality to females, therefore forming the basis of mate choice in this species. These results are potentially important for the ostrich industry, as the selection of ostrich lines for high, or early responsiveness to harmless pathogens could improve resistance to various kinds of infectious disease agents (and subsequently improve survival rates during the first few months), as well as enhance chick growth rates.
References
Amundsen T, Forsgren E, Hansen LTT (1997) On the function of female ornaments: male bluethroats prefer colourful females. Proc R Soc Lond B 264:1579–1586
Andersson M (1994) Sexual selection. Princeton University Press, Princeton, New Jersey
Ariyomo TO, Carter M, Watt PJ (2013) Heritability of boldness and aggressiveness in the zebrafish. Behav Genet 43:161–167
Bertram BCR (1992) The ostrich communal nesting system. Princeton University Press, Princeton, New Jersey
Birkhead TR, Fletcher F, Pellat EJ (1999) Nestling diet, secondary sexual traits and fitness in zebra finch. Proc R Soc Lond B 266:385–390
Bonato M, Evans MR, Cherry MI (2009a) Investment in eggs is influenced by male coloration in the ostrich (Struthio camelus). Anim Behav 77:1027–1032
Bonato M, Evans MR, Hasselquist D, Cherry MI (2009b) Male coloration reveals different components of immunocompetence in ostriches, Struthio camelus. Anim Behav 77:1033–1039
Bonato M, Evans MR, Hasselquist D, Cloete SWP, Cherry MI (2009c) Growth rate and hatching date in ostrich chicks reflect humoral but not cell-mediated immune function. Behav Ecol Sociobiol 64:183–191
Boonekamp JJ, Ros AHF, Verhulst S (2008) Immune activation suppresses plasma testosterone levels: a meta analysis. Biol Lett 4:741–744
Bortolotti GR, Blas J, Negro JJ, Tella JL (2006) A complex plumage pattern as an honest social signal. Anim Behav 72:423–430
Brinkhof MWG, Heeb P, Kolliker M, Richner H (1999) Immunocompetence of nestling great tits in relation to rearing environment and parentage. Proc R Soc Lond B 266:2315–2322
Bunter KL, Cloete SWP (2004) Genetic parameters for egg-, chick- and live-weight traits recorded in farmed ostriches (Struthio camelus). Livest Prod Sci 91:9–22
Cheng S, Lamont SJ (1988) Genetic analysis of immunocompetence measures in a white leghorn chicken line. Poult Sci 67:989–995
Cichon M, Sendecka J, Gustafsson L (2006) Genetic and environmental variation in immune response of collared flycatcher nestlings. J Evol Biol 19:1701–1706
Cilliers SC, du Preez JJ, Maritz JS, Hayes JP (1995) Growth curves of ostriches (Struthio camelus) from Oudtshoorn in South Africa. Anim Sci 6:161–164
Cornwallis CK, Birkhead TR (2006) Social status and availability of females determine patterns of sperm allocation in the fowl. Evolution 60:1486–1493
Cornwallis CK, Birkhead TR (2007) Experimental evidence that female ornamentation increases the acquisition of sperm and signals fecundity. Proc R Soc Lond B 274:583–590
Cotton S, Small J, Pomiankowski A (2006) Sexual selection and condition-dependent mate preferences. Curr Biol 16:R755–R765
Cunningham EJ, Russell AF (2000) Egg investment is influenced by male attractiveness in the mallard. Nature 404:74–77
Deeming DC (1996) Production, fertility and hatchability of ostrich (Struthio camelus) eggs on a farm in the United Kingdom. Anim Sci 67:329–336
Deeming DC, Ayres L (1994) Factors affecting the rate of growth of ostrich (Struthio camelus) chicks in captivity. Vet Rec 135:617–622
Deeming DC, Ayres L, Ayres FJ (1993) Observations on the first commercial production of ostrich (Struthio camelus) eggs in the UK: rearing of chicks. Vet Rec 132:627–631
Doucet SM (2002) Structural plumage coloration, male body size, and condition in the blue-black grassquit. Condor 104:30–38
Doutrelant C, Grégoire A, Grnac N, Gomez D, Lambrechts MM, Perret P (2008) Female coloration indicates female reproductive capacity in blue tits. J Evol Biol 21:226–233
Endler JA (1990) On the measurement and classification of colour in studies of animal colour patterns. Biol J Linn Soc Lond 41:315–352
Endler JA, Théry M (1996) Interacting effects of lek placement, display behavior, ambient light and color patterns in three neotropical forest-dwelling birds. Am Nat 148:421–452
Fair JM, Hansen ES, Ricklefs RE (1999) Growth, developmental stability and immune response in juvenile Japanese quails (Coturnix coturnix japonica). Proc R Soc Lond B 266:1735–1742
Faivre B, Préault M, Salvadori F, Théry M, Gaillard M, Cézilly F (2003) Bill colour and immunocompetence in the European blackbird. Anim Behav 65:1125–1131
Falconer D, Mackay T (1996) Introduction to quantitative genetics. Longman, Essex, UK
Folstad I, Karter AJ (1992) Parasites, bright males and the immunocompetence handicap. Am Nat 139:603–622
Gandini GCM, Keffen RH (1985) Sex determination of the South African ostrich (Struthio camelus). J S Afr Vet Assoc 56:209–210
Gil D, Culver R (2011) Male ornament size in a passerine predicts the inhibitory effect of testosterone on macrophage phagocytosis. Funct Ecol 25:1278–1283
Gil D, Graves J, Hazon N, Wells A (1999) Male attractiveness and differential testosterone investment in zebra finch eggs. Science 286:126–128
Griffith SC, Pryke SR (2006) Benefits of females assessing color display. In: Hill GE, McGraw KJ (eds) Bird coloration: function and evolution, Harvard University Press, pp 233–279
Grindstaff JL, Brodie ED, Ketterson ED (2003) Immune function across generations: integrating mechanism and evolutionary process in maternal antibody transmission. Proc R Soc Lond B 270:2309–2319
Gross WB, Siegel HS (1983) Evaluation of the heterophil/lymphocyte ratio as a measure of stress in chickens. Avian Dis 27:972–979
Hanssen SA, Hasselquist D, Folstad I, Erikstad KE (2004) Cost of immunity: immune responsiveness reduces survival in a vertebrate. Proc R Soc Lond B 271:925–930
Hanssen SA, Folstad I, Hasselquist D, Erikstad KE (2008) A label of health: the expression of a female plumage trait signals previous immune challenge. Biol Lett 4:379–381
Hasselquist D (2007) Comparative immunoecology in birds: hypotheses and tests. J Ornithol 148(suppl 2):S571–S582
Hasselquist D, Nilsson JÅ (2009) Maternal transfer of antibodies in vertebrates: trans-generational effects on offspring immunity. Philos T Roy Soc B 364:51–60
Hasselquist D, Nilsson JÅ (2012) Physiological mechanisms mediating costs of immune responses: what can we learn from studies of birds? Anim Behav 83:1303–1312
Hasselquist D, Marsh JA, Sherman PW, Wingfield JC (1999) Is avian humoral immunocompetence suppressed by testosterone? Behav Ecol Sociobiol 45:167–175
Hasselquist D, Tobler M, Nilsson J-Å (2012) Maternal modulation of offspring immune function in vertebrates. In: Nelson RM, Demas G (eds) Eco-immunology. Oxford University Press, Oxford, pp 165–224
Heywood JS (1989) Sexual selection by the handicap mechanism. Evolution 43:1387–1397
Hill GE (1991) Plumage coloration is a sexually selected indicator of male quality. Nature 350:337–339
Iwasa Y, Pomiankowski A (1994) The evolution of mate preferences for multiple handicaps. Evolution 48:853–867
Jacquin L, Lenouvel P, Haussy C, Ducatez S, Gasparini J (2011) Melanin-based coloration is related to parasite intensity and cellular immune response in an urban free living bird: the feral pigeon Columba livia. J Avian Biol 42:1–5
Johnsen A, Andersen V, Sunding C, Lifjeld JT (2000) Female bluethroats enhance offspring immunocompetence through extra-pair copulations. Nature 406:296–299
Johnstone RA, Reynolds JD, Deutsch JC (1996) Mutual mate choice and sex differences in choosiness. Evolution 50:1382–1391
Jones MC, Taylor PC (1999) Statistical Modelling using GENSTAT. Arnold, London
Kalinowski ST, Taper ML, Marshall TC (2007) Revising how the computer program CERVUS accommodates genotyping error increases success in paternity assignment. Mol Ecol 16:1099–1106
Kilpimaa J, Van de Casteele T, Jokinen I, Mappes J, Alatalo RV (2005) Genetic and environmental variation in antibody and T-cell mediated responses in the great tit. Evolution 59:2483–2489
Kimwele CN, Graves JA (2003) A molecular genetic analysis of the communal nesting of the ostrich (Struthio camelus). Mol Ecol 12:229–336
Klasing KC, Laurin DE, Peng RK, Fry D (1987) Immunologically mediated growth depression in chicks: influence of feed intake, corticosterone and interleukin-1. J Nutr 117:1629–1637
Krams I, Vrublevska J, Cirule D, Kivleniece I, Krama T, Rantala MJ, Sild E, Hõrak P (2012) Heterophil/lymphocyte ratios predict the magnitude of humoral immune response to a novel antigen in great tits (Parus major). Comp Biochem Physio A 161:422–428
Lessells CM, Boag PT (1987) Unrepeatable repeatibilities: a common mistake. Auk 104:116–121
Lifjeld JT, Dunn PO, Whittingham LA (2002) Short term fluctuations in cellular immunity of tree swallows feeding nestlings. Oecologia 130:185–190
Lihoreau M, Zimmer C, Rivault C (2008) Mutual mate choice: when it pays both sexes to avoid inbreeding. PLoS One 3:e3365
Martin LB, Han P, Lewittes J, Kuhlman JR, Klasing KC, Wiklelski M (2006) Phytohemagglutinin-induced skin swelling in birds: histological support for a classic immunoecological technique. Funct Ecol 20:290–299
McGraw KJ, Ardia DR (2003) Carotenoids, immunocompetence, and the information content of sexual colors: an experimental test. Am Nat 162:704–712
McGraw KJ, Correa SM, Adkins-Regan E (2006) Testosterone upregulates lipoprotein status to control sexual attractiveness in a colorful songbird. Behav Ecol Sociobiol 60:117–122
Møller AP, Petrie M (2002) Condition dependence, multiple sexual signals, and immunocompetence in peacocks. Behav Ecol 13:248–253
Mushi EZ, Isa JFW, Chabo RG, Segaise TT (1998) Growth rate of ostrich (Struthio camelus) chicks under intensive management in Botswana. Trop Anim Health Prod 30:197–203
Norris K, Evans MR (2000) Ecological immunology: life history trade-offs and immune defense in birds. Behav Ecol 11:19–26
Owen-Ashley NT, Hasselquist D, Wingfield JC (2004) Androgens and the immunocompetence handicap hypothesis: unravelling direct and indirect pathways of immunosuppression in song sparrows. Am Nat 164:490–505
Parmentier H, Nieuwland M, Rijke E, De Vries Reilingh G, Schrama J (1996) Divergent antibody responses to vaccines and divergent body weights of chicken lines selected for high and low humoral responsiveness to sheep red blood cells. Avian Dis 40:634–644
Payne RW, Murray DA, Harding SA, Baird DB, Soutar DM (2009) GenStat for Windows (12th Edition) Introduction. VSN, Hemel Hempstead
Petrie M, Williams A (1993) Peahens lay more eggs for peacocks with larger trains. Proc R Soc Lond B 251:127–131
Pyke N (2011) Using false discovery rates for multiple comparisons in ecology and evolution. Methods Ecol Evol 2:278–282
Råberg L, Stjernman M, Hasselquist D (2003) Immune responsiveness in adult blue tits: heritability and effects of nutritional status during ontogeny. Oecologia 136:360–364
Ricklefs RE, Webb T (1985) Water content, thermogenesis, and growth rate of skeletal muscles in the European starling. Auk 102:369–376
Roberts ML, Buchanan KL, Evans MR (2004) Testing the immunocompetence handicap hypothesis: a review of the evidence. Anim Behav 68:227–239
Roulin A, Jungi TW, Pfister H, Dijkstra C (2000) Female barn owls (Tyto alba) advertise good genes. Proc R Soc Lond B 267:937–941
Saino N, Bolzern AM, Møller AP (1997) Immunocompetence, ornamentation, and viability of male barn swallows (Hirundo rustica). P Natl Acad Sci USA 94:549–552
Saino N, Incagli M, Martinelli R, Møller AP (2002) Immune response of male barn swallow in relation to parental effort, corticosterone plasma levels, and sexual ornamentation. Behav Ecol 13:169–174
Saks L, McGraw K, Horak P (2003a) How feather colour reflects its carotenoid content. Funct Ecol 17:555–561
Saks L, Ots I, Horak PH (2003b) Carotenoid-based plumage coloration of male greenfinches reflects health and immunocompetence. Oecologia 134:301–307
Servedio MR, Lande R (2006) Population genetic models of male and mutual mate choice. Evolution 60:674–685
Smits JE, Bortolotti GR, Tella JL (1999) Simplifying the phytohaemagglutinin skin-testing technique in studies of avian immunocompetence. Funct Ecol 13:567–572
Soler JJ, de Neve L, Perez-Contreras T, Soler M, Sorci G (2003) Trade-off between immunocompetence and growth in magpies: an experimental study. Proc R Soc Lond B 270:241–248
Stoehr AM, Kokko H (2006) Sexual dimorphism in immunocompetence: what does life-history theory predicts? Behav Ecol 17:751–756
Storey J (2003) The positive false discovery rate: a Bayesian interpretation and the q-value. Ann Stat 31:2013–2035
Tang G, Huang YH, Lin L, Hu XX, Feng JD, Yao P, Zhang L, Li N (2003) Isolation and characterization of 70 novel microsatellite markers from ostrich (Struthio camelus) genome. Genome 46:833–840
Tjørve KMC, Underhill LG (2009) Growth and its relationship to fledging success of African black oystercatcher Haematopus moquini chicks. Zoology 112:27–37
van der Most PJ, de Jong B, Parmentier HK, Verhulst S (2011) Trade-off between growth and immune function: a meta-analysis of selection experiments. Funct Ecol 25:74–80
Verwoerd DJ, Deeming DC, Angel CR, Perelman B (1999) Rearing environments around the world. In: Deeming DC (ed) The ostrich: biology, production and health. CABI, Manchester, pp 190–216
Vinkler M, Bainova H, Albrecht T (2010) Functional analysis of the skin-swelling response to phytohaemagglutinin. Funct Ecol 24:1081–1086
von Schantz T, Bensch S, Grahn M, Hasselquist D, Wittzell H (1999) Good genes, oxidative stress and radical sexual signals. Proc R Soc Lond B 266:1–12
Westneat DF, Birkhead TR (1998) Alternative hypotheses linking the immune system and mate choice for good genes. Proc R Soc Lond B 265:1065–1073
Zanollo V, Griggio M, Roberston J, Kleindorfer S (2012) The number and coloration of white flank spots predict the strength of a cutaneous immune response in female Diamond Firetails, Stagonopleura guttata. J Ornithol 153:1233–1244
Zuk M (1994) Immunology and the evolution of behavior. In: Real D (ed) Behavioral mechanisms in ecology. Chicago University Press, Chicago, pp 354–368
Acknowledgments
We gratefully thank the National Research Foundation of South Africa for financial support, and the Western Cape Department of Agriculture for maintaining the research flock at the Oudtshoorn Research farm, and especially Stefan Engelbrecht and Basie Pfister for assistance in taking care of the birds and data collection. DH was supported by grants from the Swedish Research Council (VR), and partially from the Linnaeus excellence research project CAnMove financed by the Swedish Research Council and Lund University.
Ethical standards
Ethical clearance for these experiments, which comply with the laws of South Africa, was granted by the Stellenbosch University ethics committee (2006B03001).
Author information
Authors and Affiliations
Corresponding author
Additional information
Communicated by K. McGraw
Rights and permissions
About this article
Cite this article
Bonato, M., Evans, M.R., Hasselquist, D. et al. Ostrich chick humoral immune responses and growth rate are predicted by parental immune responses and paternal colouration. Behav Ecol Sociobiol 67, 1891–1901 (2013). https://doi.org/10.1007/s00265-013-1597-3
Received:
Revised:
Accepted:
Published:
Issue Date:
DOI: https://doi.org/10.1007/s00265-013-1597-3