
Abstract
Objective
To compare the results of sonographic (US) and magnetic resonance (MR) imaging in detecting pathology of the posterior tibial tendon (PTT) in patients with PTT dysfunction.
Design
Twenty-two ankles that were clinically suspected by the orthopedic surgeon to have PTT dysfunction were evaluated with US (10 MHz linear-array transducer) and 1.5 T MR examinations within the same day. The US and MR studies were conducted and interpreted by two sonologists and two musculoskeletal radiologists who were masked to the results of the other study. Four patients had bilateral studies. Classic clinical findings were utilized as a standard reference in staging PTT dysfunction.
Patients
Eighteen women (mean age 61 years, age range 39―86 years).
Results
Based on a commonly accepted staging system for PTT dysfunction, 6 ankles were classified as stage I, 11 ankles as stage II, and 5 ankles as stage III. All stage I ankles were interpreted as having an intact PTT by both MR imaging and US. In the stage II and III tendons, MR imaging demonstrated PTT tears in 12 of 22 examinations, including 11 partial tears and 1 complete tear. US demonstrated PTT tears in 8 of 22 examinations, including 8 partial tears and no complete tears. The findings of US and MR imaging were consistent in 17 of 22 cases (77%). The five inconsistencies were as follows: in 4 cases, US reported tendinosis when MR imaging interpreted partial tears (no change in management); in one case, US diagnosed a partial tear when MR reported a complete tear of the PTT (no change in management because the clinical findings were more consistent with a partial tear).
Conclusions
In this study, US and MR imaging of the PTT were concordant in the majority of cases. US was slightly less sensitive than MR imaging for PTT pathology, but these discrepancies did not affect clinical management.
Introduction
The diagnosis of posterior tibial tendon (PTT) dysfunction is often made by history and physical findings alone [1, 2]. However, clinical findings may occasionally be confusing, making the diagnosis a challenge, especially in acute or subacute presentations [3, 4]. Early recognition of PTT dysfunction is critical in preventing irreversible deformity and disability [4]. Imaging of the symptomatic PTT has proven to be a valuable tool in diagnosis, as well as in surgical and treatment planning [5].
MR imaging has been established as the “gold standard” for detection of ankle tendon abnormalities [2, 3, 4, 5, 6, 9]. Several authors have reported on the high accuracy of MR imaging in detecting ankle tendon tears [6, 7, 9, 10]. Recently, numerous studies have documented the effectiveness of sonography (US) as an alternative diagnostic tool for investigating pathology of the PTT [3, 11, 12, 13, 14, 15]. The superficial location of the PTT makes it well suited for imaging by high-resolution US. The development of linear-array high-frequency transducers makes it possible to produce high-resolution images that can display inner tendon structure [6, 16, 7, 18].
The purpose of this preliminary study was to compare US and MR imaging of PTT pathology in patients with PTT dysfunction.
Patients and methods
This study was performed on 18 patients who were examined over a 3-year period, with clinical symptoms of PTT dysfunction. All 18 patients subsequently underwent US and MR imaging within the same day. Four patients who had bilateral symptoms had bilateral studies done. The results of the US examinations were not used for clinical management, but solely for the purposes of this study. All the subjects were women, whose ages ranged from 39 to 86 years, with a mean age of 61 years. All patients presented with symptoms and signs of PTT dysfunction, and a history of chronic ankle pain of greater than 6 weeks’ duration.
Patient histories and physical examinations were performed by the same orthopedic surgeon, who specializes in foot and ankle surgery. Classic clinical findings were utilized as a standard reference, using the staging system of PTT dysfunction of Johnson and Strom [19]. This type of examination has been considered to be an acceptable standard of reference in prior studies of the PTT [7, 20, 21, 22]. Clinically, 16 of the 22 tendons had stage II, III, or IV dysfunction, and were thus considered to have high clinical suspicion for either a partial or full-thickness tear. The other 6 tendons had stage I dysfunction.
US examinations were performed in real time by the same sonologist experienced in musculoskeletal US. All contralateral asymptomatic ankles were scanned for use as a comparison. Static images were all retrospectively interpreted in consensus by the original sonologist as well as a second experienced sonologist who specializes in musculoskeletal US. Although the sonologists were not masked to the symptomatic ankle, they were masked to the clinical staging and the results of the MR examinations. Each examination was performed using a 10 MHz linear-array transducer with a commercially available ultrasound unit (ATL Ultramark 9-HDI, Bothell, Wash.). During the examination, subjects were in the prone or lateral decubitus position. The PTT was imaged in two segments: above and behind the medial malleolus, starting approximately 8 cm superior to the medial malleolus; and between the medial malleolus and the insertion of the PTT on the tarsal navicular. Once the PTT was imaged longitudinally, sequential transverse images (perpendicular to the long axis of the tendon) were obtained. The adjacent flexor digitorum longus tendon was used as a visual comparison in this projection.
Diagnostic criteria on US were as follows. Complete PTT tear was defined as marked disruption of the fibrillary pattern of the tendon, such that tendon continuity was no longer maintained. Partial PTT tear was defined as a linear hypoechoic disruption of the fibrillary pattern not involving the entire tendon thickness. PTT tendinosis was defined as focal or diffuse tendon thickening accompanied by heterogeneous echotexture; hypoechoic foci in the PTT were called tendinosis rather than tear if they were rounded in shape rather than linear, and showed no overt disruption of the fibrillary pattern.
MR examinations were performed on only the symptomatic ankles. Four patients had bilateral studies. All examinations were retrospectively interpreted in consensus by two musculoskeletal radiologists who were masked to the clinical staging of the ankles along with the US findings. All MR imaging was performed using a 1.5 T scanner (Signa; GE Medical Systems, Milwaukee, Wis.) with an extremity coil around the ankle (field of view 14–18 cm). The protocol consisted of imaging in sagittal, axial, and coronal planes; the axial plane was defined as being parallel to the long axis of the foot. Two sets of axial images were obtained. One was intermediate-weighted to optimize the signal-to-noise ratio: proton density fast spin echo (FSE) using a TR/TE (effective) of 2500–3800/34–38 ms, an echo train length of 4, slice thickness 4 mm, skip 1 mm, and a matrix of 256×256 with 2 signals averaged. The other axial sequence consisted of a fat-suppressed T2-weighted FSE sequence that was acquired with a TR/TE (effective) of 3000–6000/60–90 ms, an echo train length of 8, slice thickness of 4 mm, skip 1 mm, and a matrix of 256×192 with 2–3 signals averaged. Coronal images were acquired using the same T2-weighted FSE technique. Sagittal spin echo T1-weighted images (TR/TE=400–700/8–14, slice thickness 3 mm, skip 1 mm, matrix 256×256, 2 signals averaged) and sagittal fast spin echo inversion recovery images (TR/TE/TI=2000–4000/40–60/150 ms, an echo train length of 8, slice thickness 4 mm, skip 1 mm, matrix 256×192, 3 signals averaged) were also acquired. Contrast was not used in any examination.
Diagnostic criteria for MR imaging were as follows. Complete PTT tear was defined as complete discontinuity of the tendon with a fluid gap. Partial PTT tear was defined as intratendinous signal approaching that of fluid on fluid-sensitive sequences. PTT tendinosis was defined as focal thickening or thinning of the tendon, or intratendinous signal less than that of fluid on fluid-sensitive sequences.
The results of the clinical, US, and MR examinations were compared. The study was completed according to the protocol approved by our Institutional Review Board. Informed consent was obtained from all subjects.
Results
Of the 22 ankle studies, US demonstrated tears of the posterior tibial tendon in 8 ankles (8 partial tears) compared with 12 tears (11 partial tears; 1 complete tear) diagnosed by MR imaging. Breakdown by clinical staging is as follows:
-
Of the 6 stage I ankles, neither US nor MR imaging diagnosed any tears.
-
Of the 11 stage II ankles, US diagnosed partial tears of the PTT in 6 ankles. MR imaging also diagnosed partial tears in the same 6 ankles (Fig. 1). In the remaining 5 stage II tendons, US diagnosed tendinosis of the PTT in 2 ankles and reported 3 normal tendons. However, MR imaging identified partial tears in the 2 ankles that were read as tendinosis by US (Fig. 2). The 3 tendons that were read as normal on US demonstrated tendinosis on MR imaging.
Fig. 1A–C 
A 60-year-old woman with stage II PTT dysfunction, and partial PTT tear seen on sonography and MR imaging. A Axial and B longitudinal sonographic images of right PTT at the level of distal tibia (T) demonstrate linear hypoechoic partial tear (arrows). C Axial fast spin-echo fat-suppressed T2-weighted MR image (6000/72) of the right PTT shows partial disruption of the fibers of the tendon near its insertion, indicated by foci of fluid signal intensity (arrow)
Fig. 2A–C 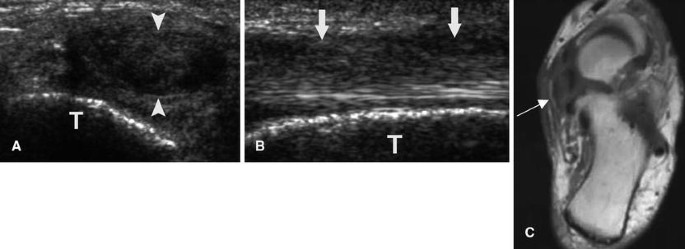
A 73-year-old woman with stage II PTT dysfunction, and tendinosis seen on sonography and MR imaging. A Axial sonographic image of the left PTT at the level of distal tibia (T) demonstrates a rounded hypoechoic abnormality (arrowheads) occupying the majority of the tendon circumference. B Longitudinal sonographic image at the level of the distal tibia (T) shows that the superficial fibers of the PTT are diffusely hypoechoic (arrows) but otherwise intact, consistent with severe tendinosis C Axial fast spin-echo proton density-weighted (2200/20) MR image shows a thickened, tendinotic distal PTT (arrow)
-
Of the 5 stage III ankles, US diagnosed partial tears of the PTT in 2 ankles. MR imaging demonstrated partial tears in the same 2 ankles. Of the 3 remaining stage III ankles, US diagnosed tendinosis of the PTT in 1 ankle and reported 2 normal tendons. MR imaging also identified a partial tear in the ankle that was read as tendinosis by US, and diagnosed tendinosis in an ankle that was reported normal by US. In one of the stage III cases, MR imaging demonstrated a complete tear of the PTT where US only visualized a partial tear (Fig. 3).
Fig. 3A–D 
An 83-year-old woman with stage III PTT dysfunction. Serial axial MR images demonstrated a complete PTT tear that was interpreted as partial on sonography. A Axial fast spin-echo fat-suppressed T2-weighted MR image (4800/72) of the left PTT superior to the ankle joint shows thickening of the PTT (arrow) near the myotendinous junction. B T2-weighted MR image (4800/72) at the level of the ankle joint shows fluid signal (arrow) in the normal location of the PTT, next to the flexor digitorum longus tendon (arrowhead). C T2-weighted MR image (4800/72) inferior to the ankle joint shows revisualization of a thickened PTT (arrow) anterior to the flexor digitorum longus tendon (arrowhead). D Corresponding longitudinal sonogram of the left PTT obtained at and just below the medial malleolus shows a thickened tendon (arrow) with peritendinous fluid (asterisk). Arrowhead demonstrates the tear that was interpreted as partial on ultrasonography but complete on MR imaging


Previous studies demonstrate that US and MR findings of partial tear and tendinosis are quite comparable and differentiating the two does not affect management [6, 17]. Therefore, the data were then categorized into three groups: normal, tendinosis/partial tear, and complete tear. Based on these categories, the findings of the MR and US examinations were concordant in 6 of 6 stage I tendons (100%), 8 of 11 stage II tendons (73%), and 3 of 5 stage III tendons (60%). Overall, the findings of the MR and US examinations were concordant in 17 of the 22 ankles (77%) (Table 1).
Discussion
Although diagnostic staging of PTT dysfunction remains primarily clinical, imaging studies in select patients are necessary for treatment planning [5]. PTT dysfunction refers to a broad spectrum of pathology that may produce similar signs and symptoms. These include tendon avulsion from its navicular insertion, intrasubstance tendon tear, partial tendon tear, and tenosynovitis without tear [5, 21, 23, 24]. There are other potential causes of acquired flatfoot in the adult that are not secondary to PTT dysfunction. These include tarsal coalition, inflammatory arthropathy, neuropathic arthropathy, tarsometatarsal osteoarthritis, neuromuscular disease, and traumatic ligamentous disruption of the mid-foot [20, 25, 26]. The various pathologies may at times be indistinguishable by clinical findings and plain radiographs, making the diagnosis a challenge [21, 23]. In addition, due to the natural progression of the disorder, early recognition of dysfunction is critical in preventing irreversible deformity and disability [4, 15, 25]. Therefore, imaging of the symptomatic PTT has proven to be a valuable tool in diagnosis, as well as in surgical planning [2, 5, 10, 18].
MR imaging has been established as the current imaging gold standard for detection of ankle tendon abnormalities [2, 6, 7, 8, 9]. In 1988, Rosenberg, et al. [10] reported an MR sensitivity of 95%, specificity of 100%, and an accuracy of 96% in detecting tears of the PTT. Numerous authors have since documented the benefits of MR imaging for preoperative planning for ankle tendon reconstructive surgery [2, 5, 7, 8, 9, 10]. MR imaging is useful in localizing the site and extent of rupture, which can aid in the operative approach [5]. However, MR imaging has its limitations. Khoury et al. reported that MR imaging characteristics of tendinosis and partial tear overlap [6]. Degenerative posterior tibial tendons are infrequently seen as MR signal abnormality, and most appear normal [17, 27]. Secondary signs, such as medial tubercle hypertrophy and the appearance of an accessory navicular bone, are often necessary to diagnose subtle partial tears with confidence [7, 28, 29]. A recent study by Rockett et al. could not duplicate the sensitivity and accuracy of MR imaging in detecting ankle tendon tears that was previously recorded by Rosenberg et al. [10, 13].
High-resolution US is another imaging option that can depict PTT pathology [3, 11, 12, 13, 14, 15, 16, 30, 31, 32]. The recent vast improvement in US technology and the development of high-frequency transducers has allowed for superior image resolution and quality. The individual fibrils of a superficial tendon such as the PTT can be visualized with a spatial resolution of less than 0.1 mm in vitro [17, 33], and US is thus far superior to MR imaging at evaluating inner tendon ultrastructure [11, 16, 17, 18, 33]. Several authors in recent years have confirmed that US evaluates PTT pathology with high accuracy [3, 11, 12, 13, 14, 15]. A review of the literature revealed three comparisons of US and MR imaging in evaluating the PTT. Rockett et al. examined 15 posterior tibial tendons with US and MR imaging, and compared the results with surgical findings. US was found to be more accurate than MR imaging, with 100% sensitivity, 90% specificity, and 94% accuracy. In comparison, MR imaging had 23% sensitivity, 100% specificity, and 66% accuracy [13]. These results were supported by those of Gerling et al., who showed that US and MR imaging performed at the same level in evaluating PTT tears; in that study, US demonstrated 69% sensitivity, 81% specificity, and 72% accuracy in comparison with a 73% sensitivity, 69% specificity, and 72% accuracy for MR imaging [34]. Premkumar et al. recently performed a comparative study of 44 posterior tibial tendons with US and MR imaging [35]. The sensitivity and specificity for diagnosing tendinopathy with US was 80% and 90% respectively when compared to MR imaging, and 90% and 80% when diagnosing peritendinitis. However, this study did not look specifically at PTT tears [35].
In an attempt to replicate the results of these recent studies, we performed a study that compared MR imaging and US for PTT evaluation. US compared favorably with MR imaging, the current imaging “gold standard.” Both examinations were consistent in identifying PTT pathology in 17 of 22 cases (77%), and were in agreement in all of the stage I ankles. In evaluating the stage II and III ankles, all discrepancies between US and MR imaging involved differentiating tendinosis from partial tears, and partial tears from complete tears. This result was not surprising, considering that previous studies have shown that the US and MR findings of partial tear and tendinosis overlap, and thus at times cannot be differentiated from each other [6, 17]. Moreover, the distinction between tendinosis and partial tear may not be of clinical significance since patients with partial tears, tendinosis, or tenosynovitis of the PTT are managed similarly. More importantly, these conditions need to be differentiated from complete tears, as treatment may be different. In our one case where MR imaging identified a complete tear that was reported as a partial tear on US, the management of the patient was not affected because the clinical findings were more consistent with partial tear.
This study was limited by the small sample size, so that the findings should be considered only as preliminary. Furthermore, there was no surgical proof since all of our patients were treated conservatively, and MR imaging is an imperfect gold standard. It is conceivable that in some cases when there were discrepant findings between US and MR imaging, US may actually have been correct. A true prospective study with surgical correlation and/or outcome analysis could better address this issue.
To summarize, in this study US compared favorably with MR imaging for imaging PTT pathology. There was complete agreement in all clinically stage I ankles. For clinical stages II and III, although MR imaging detected more tears, these tendons were all interpreted as abnormal on US, and clinical management was therefore not altered. US offers a more convenient and less expensive alternative to MR imaging for detecting PTT tears.
References
Alexander IJ, Johnson KA, Berquist TH. Magnetic resonance imaging in the diagnosis of disruption of the posterior tibial tendon. Foot Ankle 1987; 8:144–147.
Conti SF, Michelson J, Jahss M. Clinical significance of magnetic resonance imaging in preoperative planning for reconstruction of posterior tibial tendon ruptures. Foot Ankle 1992; 13:208–214.
Waitches GM, Rockett M, Brage M, Sudakoff G. Ultrasonographic-surgical correlation of ankle tendon tears. J Ultrasound Med 1998; 17:249–256.
Conti SF. Posterior tibial tendon problems in athletes. Orthop Clin North Am 1994; 25:109–121.
Kerr R, Forrester DM, Kingston S. Magnetic resonance imaging of foot and ankle trauma. Orthop Clin North Am 1990; 21:591–601.
Khoury NJ, El-Khoury GY, Saltzman CL, Brandser EA. MR imaging of posterior tibial tendon dysfunction. AJR Am J Roentgenol 1996; 167:675–682.
Schweitzer ME, Caccese R, Karasick D, Wapner KL, Mitchell DG. Posterior tibial tendon tears: utility of secondary signs for MR imaging diagnosis. Radiology 1993; 188:655–659.
Beltran J, Noto AM, Mosure JC, Shamam OM, Weiss KL, Zuelzer WA. Ankle: surface coil MR imaging at 1.5 T. Radiology 1986; 161:203–209.
Khoury NJ, El-Khoury GY, Saltzman CL, Kathol MH. Peroneus longus and brevis tendon tears: MR imaging evaluation. Radiology 1996; 200:833–841.
Rosenberg ZS, Cheung Y, Jahss MH, Noto AM, Norman A, Leeds NE. Rupture of posterior tibial tendon: CT and MR imaging with surgical correlation. Radiology 1988; 169:229–235.
Miller SD, Van Holsbeeck M, Boruta PM, Wu KK, Katcherian DA. Ultrasound in the diagnosis of posterior tibial tendon pathology. Foot Ankle Int 1996; 17:555–558.
Hsu TC, Wang CL, Wang TG, Chiang IP, Hsieh FJ. Ultrasonographic examination of the posterior tibial tendon. Foot Ankle Int 1997; 18:34–38.
Rockett MS, Waitches G, Sudakoff G, Brage M. Use of ultrasonography versus magnetic resonance imaging for tendon abnormalities around the ankle. Foot Ankle Int 1998; 19:604–612.
Shetty M, Fessell DP, Femino JE, Jacobson JA, Lin J, Jamadar D. Sonography of ankle tendon impingement with surgical correlation. AJR Am J Roentgenol 2002; 179:949–953.
Chen YJ, Liang SC. Diagnostic efficacy of ultrasonography in stage I posterior tibial tendon dysfunction: sonographic-surgical correlation. J Ultrasound Med 1997; 16:417–423.
Therman H, Hoffmann R, Zwipp H, Tscherne H. The use of ultrasonography in the foot and ankle. Foot Ankle 1992; 13:386–390.
Kainberger F, Mittermaier F, Seidl G, Parth E, Weinstabl R. Imaging of tendons: adaptation, degeneration, rupture. Eur J Radiol 1997; 25:209–222.
Bureau NJ, Roederer G. Sonography of Achilles tendon xanthomas in patients with heterozygous familial hypercholesterolemia. AJR Am J Roentgenol 1998; 171:745–749.
Johnson KA, Strom DE. Tibialis posterior tendon dysfunction. Clin Orthop 1989; 239:196–206.
Mann RA, Thompson FM. Rupture of the posterior tibial tendon causing flat foot. Surgical treatment. J Bone Joint Surg Am 1985; 67:556–561.
Funk DA, Cass JR, Johnson KA. Acquired adult flat foot secondary to posterior tendon pathology. J Bone Joint Surg Am 1986; 68:95–102.
Holmes GB, Mann RA. Possible epidemiological factors associated with rupture of the posterior tibial tendon. Foot Ankle 1992; 13:70–79.
Hogan JF. Posterior tibial tendon dysfunction and MRI. J Foot Ankle Surg 1993; 32:467–472.
Mink JH, Deutsch AL, Kerr R. Tendon injuries of the lower extremity: magnetic resonance assessment. Top Magn Reson Imaging 1991; 3:23–28.
Pomeroy GC, Pike RH, Beals TC, Manoli A. Acquired flatfoot in adults due to dysfunction of the posterior tibial tendon. J Bone Joint Surg Am 1999; 81:1173–1182.
Henceroth WD, Deyerle WM. The acquired unilateral flatfoot in the adult: some causative factors. Foot Ankle 1982; 2:304–308.
Schweitzer ME, Karasick D. MR imaging of disorders of the posterior tibial tendon. AJR Am J Roentgenol 2000; 175:627–635.
Schweitzer ME, Eid ME, Deely DM, Wapner KL, Hecht PJ. Using MR imaging to differentiate peroneal splits from other peroneal disorders. AJR Am J Roentgenol 1997; 168:129–133.
Lim PS, Schweitzer ME, Deely DM, et al. Posterior tibial tendon dysfunction: secondary MR signs. Foot Ankle Int 1997; 18:658–663.
Fornage BD, Rifkin MD. Ultrasound examination of tendons. Radiol Clin North Am 1988; 26:87–107.
Stephenson CA, Seibert JJ, McAndrew MP, Glasier CM, Leithiser RE, Iqbal V. Sonographic diagnosis of tenosynovitis of the posterior tibial tendon. J Clin Ultrasound 1990; 18:114–116.
Coakley FV, Samanta AK, Finlay DB. Ultrasonography of the tibialis posterior tendon in rheumatoid arthritis. Br J Rheumatol 1994; 33:273–277.
Martinoli C, Derchi LE, Pastorino C, Bertolotto M, Silvestri E. Analysis of echotexture of tendons with US. Radiology 1993; 186:839–843.
Gerling MC, Pfirrmann CW, Farooki S, et al. Posterior tibialis tendon tears: comparison of the diagnostic efficacy of magnetic resonance imaging and ultrasonography for the detection of surgically created longitudinal tears in cadavers. Invest Radiol 2003; 38:51–56.
Premkumar A, Perry MB, Dwyer AJ, et al. Sonography and MR imaging of posterior tibial tendinopathy. AJR Am J Roentgenol 2002; 178:223–232.
Author information
Authors and Affiliations
Corresponding author
Rights and permissions
About this article
Cite this article
Nallamshetty, L., Nazarian, L.N., Schweitzer, M.E. et al. Evaluation of posterior tibial pathology: comparison of sonography and MR imaging. Skeletal Radiol 34, 375–380 (2005). https://doi.org/10.1007/s00256-005-0903-1
Received:
Revised:
Accepted:
Published:
Issue Date:
DOI: https://doi.org/10.1007/s00256-005-0903-1