
Abstract
This work presents the response of a porous energetic material subjected to severe transient loading conditions. The porosities, represented by voids, entirely change the response of an otherwise homogeneous material. The variations in terms of energy distribution and maximum temperature reached in the material in the presence of heterogeneities (voids) but in the absence of chemical reactions are studied. This study also accounts for void–void interactions to enhance the understanding of the localization of energy in the material. It is observed that relative position of voids can have important consequence on energy distribution as well as rise in temperature of the energetic material. The relative position of voids further influences the interaction of secondary shock waves generated during the collapse of one void with the downstream voids. This interaction can either enhance or diminish the strength of the shock depending on the location of downstream voids. This work also reveals that the findings from mutual void–void interactions can be used to study systems with multiple voids. This is shown by analyzing systems with 10–25 % void volume fraction. The effect of void–void interactions are connected to the overall response of a chemically inert porous material to imposed transient loads.
1 Introduction
Shock waves interacting with heterogeneous materials are important in studies related to impact, penetration and detonation in condensed media, with applications in propulsive devices, munitions and explosive–target interactions. Designing propulsion devices and munitions for precise operational performances demands comprehensive understanding and manipulation of the spatial and temporal distribution of energy release in activated energetic materials. The study of release of energy is a crucial requirement in these systems. Moreover, these studies become very important in the safe handling of energetic materials as heterogeneities leading to formation of “hot spots” [2] are the favorable sites for initiation of detonations under modest insults. Traditional models for these applications are based on continuum theories where the microstructural heterogeneities of the material are either ignored or homogenized. These simulations, based on a continuum mechanics approach [3, 4], at the macroscale may miss key mechanisms of energy release at a scale corresponding to particle size. While the overall detonation response of the energetic material must include the coupling of kinetic and thermal energy (produced due to plastic work or inertia effects) with heat release due to chemical reactions, the micromechanics of void collapse in the absence of chemical reactions must first be thoroughly understood. This work seeks to follow the computational work of Tran et al. [5] and the experimental work of Swantek et al. [1] to examine specifically the interactions between voids in a porous energetic material in the inert case. This leads to an understanding of the mutually enhancing or damping effects that voids may have on each other in such materials, without the complexities of chemical heat release. These latter effects were investigated for single voids in Tran et al. [6] and will be deferred to forthcoming work.
1.1 Mechanisms of void collapse
In the present work, the modeling of void collapse in a high explosive is chosen as the focus. Examples of such materials include the popular HMX [7]. Initiation of a heterogeneous explosive can occur when an impulse given to the material evolves into a detonation wave. This phenomenon of evolution of a shock wave into a detonation wave depends on the local heating of material, where temperatures can be much higher than that obtained from the bulk homogeneous material. These localized regions of high temperature are known as hot spots and can result in initiation of detonation under certain conditions. Bowden and Yoffe [8] proposed the mechanism of detonation initiation due to collapse of voids; purposeful introduction or incidental occurrence of voids in cast explosives introduces a potential site for hot spot formation under shocked loading of an energetic material. There are a number of mechanisms which can contribute to formation of hot spots. These mechanisms can operate collectively depending on the size of voids, material properties, strength of the shock wave and regime of operation. The various mechanisms of energy localization at voids that were proposed over the years are as follows:
-
1.
Compression of gas in the void This mechanism can occur when a shock wave passes over the void, compressing the gas inside it. As the void is collapsed, the entrapped gas inside the void is compressed to high temperature and pressure. The temperature can reach a value high enough to initiate ignition. Chaudhri and Field [9] have showed in their work that this phenomenon is important only for the size ranging from \(50\,\upmu \text{ m }\) to 1 mm voids collapsed by a low strength shock \({\sim }\)0.1 GPa. Therefore, the gas compression is a dominant mechanism when large pores are collapsed slowly.
-
2.
Hydrodynamic impact This mechanism occurs when a heterogeneous explosive is loaded at high shock strengths. At high speeds, the stress wave amplitude far exceeds the plastic yield strength of material deforming the lower surface of void. The deformed downstream surface thus forms a high-speed jet of material which impacts against the upper surface of void resulting in increase of temperature. In this phenomenon, the high kinetic energy of downstream surface is converted into internal energy during impact resulting in very high temperature favorable for detonation initiation. This mechanism [10], therefore, corresponds to the inertia-dominated regime.
-
3.
Plastic work When a solid material undergoes plastic deformation, the temperature rises due to conversion of plastic work into heat. Khasainov et al. [2] have pointed that significant heating can occur due to plastic work for smaller void sizes, i.e., for void diameters less than micrometers and in short times of less than a microsecond.
Other mechanisms that may be important for formation of hot spots are shear heating [11], kinetic energy release due to inter-particle impact [12], melting at inter-particle boundaries [13], friction due to relative motion of particles, viscous heating [14], adiabatic shear banding [15], shock reflections [16] and interfacial defects caused by shock passage [14]. Various phenomenological burn models have been used to incorporate these mechanisms to study the initiation of solid energetic materials. Forest Fire Model [17], JTF model [18] and Ignition and Growth model [4] are the most common ones; details of these can be found in the mentioned references. However, all of the mechanisms accompanying the deposition of energy in a material at void sites are local phenomena and occur at the scale of individual particles; therefore, these effects are not adequately reflected in a continuum model that operates on volume-averaged [3] or mixture formulations [4] and must be modeled in as sub-grid or closure models. Experiments [1, 19] are difficult to perform due to the short time scales and optical access issues, but can provide some information on the response of voids to imposed loads. On the other hand, direct numerical simulations, as in this study, can provide detailed insights and quantification of the energetics of porous materials subject to imposed transient loads. In particular, this work leads to important physical insights into the effects of void–void interactions in a representative sample of a porous explosive that can be used to construct closure models for use in macroscale computations.
1.2 Importance of modeling the mesoscale dynamics of heterogeneous explosives
Typical analyses of the response of an energetic material exposed to severe loadings (that are likely to trigger explosion) have treated the energetic material as a macroscopically homogeneous material, which for heterogeneous explosives implies some form of homogenization or mixture theory [3, 4]. In such treatments, the response of the material to a passing shock which initiates self-sustaining chemical reactions must somehow incorporate microscopic, localized events such as hot spots. In hydrocodes [20] that compute such response, the Lee–Tarver “Ignition and Growth model” [4] is used to initiate reaction. This model provides a heat release rate at any point in a heterogeneous explosive as a function of the local shock pressures and the void fraction and can be used as a heat deposition source term in a homogenized multiphase model (such as the Baer–Nunziato model [3]). In the ignition and growth model, a small fraction of the explosive is assumed to be ignited by the passage of the shock front; the reaction rate is controlled by pressure and surface area of the unreacted material, by adopting ideas from treatment of deflagration processes. The Lee–Tarver model [4] is a phenomenological model that provides the heat released behind the leading shock wave by modeling the energy release rate in the form:
here \(F\) is the fraction of reacted explosive, \(p\) is the pressure, and \(I,\, G\), x, y, r, and z are constants that are empirically established and,
where \(V_{0 }\) is the initial specific volume of the explosive and \(V_{1}\) is the specific volume of the shocked, unreacted explosive.
Note that in (1), the first term accounts for ignition and the second for growth of the reaction front. The argument posed by Lee and Tarver is that ignition is supposed to depend on the compressive strength of the incident shock wave and also on the surface area corresponding to the fraction of unreacted explosive while growth of the reaction front depends on the pressure. This latter dependency is an extension of the idea of burning fronts in deflagrating propellants. Note that in a heterogeneous medium, ignition occurs at hot spots and buildup to detonation occurs as the reaction grows outward from these hot spots [4]. Thus, the number and intensity of energy localizations at hot spots play a role in determining whether ignition and growth can lead to run-off to detonation. As shown by Khasainov et al. [2] and others [5, 11], and as demonstrated in results to be presented, the formation of the hot spots can lead to localized temperature and pressure excursions that are quite different from the imposed temperature and pressure fields in a shocked homogeneous material. Thus, the physics behind void collapse is not captured by arguments that are extended from deflagration phenomena in propellant stick burning.
The way in which hot spot phenomena are argued [4] to be reflected in the Lee–Tarver model depends on the mechanism of hot spot formation that is considered to operate. For example, if the hydrodynamic void collapse leads to hot spots, the exponent \(r\) is assigned the value 3. This is due to an assumed relationship between the particle velocity \(u_{\mathrm{p}}\) and void fraction \(\eta ,\, \text{ viz., } u_\mathrm{p}^2 \propto \eta ^{3}\). Since the hydrodynamic void collapse is an inertial mechanism that converts the local kinetic energy of the jet formed in the underside of the void into thermal energy, the ignition process is assumed to depend on the kinetic energy. If the hot spot is formed due to plastic work done in deforming the void as it collapses, then this work is assumed to be proportional to \(\int \!{p^{2}} \mathrm{d}t\) [21], where \(p\) is the pressure and the integral is over the time of collapse of the void. Since \({P^{2}}\,\alpha \,{{\eta }^{4}}\), the exponent is given the value 4 [21]. Whether \(r\) should be 3 or 4 is determined by recourse to experiments and the other constants in the equation above are fit to experiments as well. This procedure of determining the value of \(r\) depends on the type of explosive in an ad hoc way and is non-generalizable. The rational for fitting the constants in the Lee–Tarver model appears to be based on semi-empirical and physical notions, but there is no specific understanding of how void collapse deposits energy and how this locally deposited energy leads to thermal runoff and detonation.
While the Lee–Tarver model is quite popular in making predictions of the overall response of energetic materials using hydrocodes, it is difficult to see clearly how the void collapse mechanism, in particular void–void interactions can be adequately reflected in such a phenomenological model. In more recent work, Tarver [22] and Menikoff [23] have taken a more microscopic view by asking the question, “what is a shock wave to an explosive molecule?” [22]. In this view, by assuming that reactions in the condensed-phase explosive material follow conventional Arrhenius rate laws [24], a material comprising of molecules of energetic material will be ignited if the local temperatures exceed certain critical values and the local thermal energy deposition is high enough that the activation energy barrier can be overcome. Thus, there are two key elements that reflect whether a hot spot will lead to successful ignition: local temperature (connecting hot spot intensity to reaction rate kinetics through the activation energy required to trigger reactions) and the “strength” of the hot spot. The latter measure depends on the size of the hot spot, the time scale over which local ignition conditions can be maintained, etc. before dissipative mechanisms such as rarefaction waves, plastic work, heat diffusion, viscosity, and phase changes can draw energy away from the hot spot. Thus, Tarver et al. [22] have obtained values of critical temperatures for HMX and TATB explosives that are functions of the sizes of the voids; the smaller are the voids, the larger are the “critical temperatures”. This implies that shocking a heterogeneous explosive with very small voids may not lead to ignition.
The viewpoint in the current work is that, along the lines of the more recent work of Tarver et al. [22] and others [5, 14, 23], a truly microscopic viewpoint is required to understand and quantify the effect of a shock on voids in the heterogeneous material. The issue of whether there will be ignition hinges on the following factors:
-
1.
When a void collapses what is the local temperature experienced by reactive molecules in the vicinity of the void? What is the time scale of relaxation of this local temperature?
-
2.
How does this localization depend on the shock strength and void size?
-
3.
When a piece of heterogeneous explosive containing a void (or a collection of voids) is exposed to shock loading, what is its response? How does the input shock energy distribute itself into thermal and inertial modes in the material?
-
4.
What effects do void–void interactions have in a heterogeneous explosive and how do these effects depend on the loading parameters and void characteristics (e.g., shock strength, void size and shape)?
The simulations that follow examine the physics of void–void interactions to shed light on the above issues.
1.3 Modeling of shock-induced mesoscale dynamics
Simulations of energy deposition and transport in the presence of grain scale features have been pursued in a variety of contexts. Zhang et al. [25] have examined the effects of metallic particles (and small arrays of particles) of initially circular shape in an RDX explosive (modeled as a homogeneous substrate). Udaykumar et al. [5, 6] have examined the evolution and collapse of a void in an inert matrix and a reactive HMX matrix, demonstrating the different ways in which energy localization can occur ranging from plastic work to hydrodynamic collapse. Shirish et al. [26] have studied different pre-ignition phenomena such as hydrodynamic mechanism, shear heating and gas compression leading to void collapse in HMX. Cooper et al. [27] also studied void collapse in a metallic system using an Eulerian approach. Frost et al. [28] have used the detonation shock dynamics model for detonation propagation, where the detonation front is tracked by means of a level set function. They examined the passage of a detonation wave through an array of inert particles. In all of these simulations, the attempt was to examine the detailed micromechanics and energy localization phenomena pertaining to a single feature or small array of features embedded in an otherwise homogeneous substrate with properties pertaining to HEs. Reaugh [29] examined features of void collapse, inter-particle contact and deformation in a representative disordered mixture with realistic particle shapes simulating HMX crystals. Benson [30] developed an Eulerian approach where the deformation field is mapped back to a fixed Eulerian mesh following a preliminary Lagrangian update step. Within each grid cell in the Eulerian mesh several particles can coexist, with a volume fraction-based approach to keep track of each particle. Shock compaction of powders has been studied using this approach. Since particle surfaces are not explicitly tracked, some of the mechanisms of energy deposition listed above (e.g., frictional, melting, and void collapse) cannot be included in the model. Menikoff [13] has used this framework to examine the compaction of a granular bed of HMX. The propagation of stress waves in the inhomogeneous medium and the energy localization in a mesoscale sample containing a collection of (regularly shaped) crystals was studied. Menikoff [16, 31] has also examined the hot spot formation from shock reflections in a physical experiment in which heterogeneities in terms of glass beads are introduced in liquid nitromethane. Using the Eulerian computer code CTH, Baer [14] and others have studied the mesoscale dynamics of HEs under the effect of imposed shocks. Detailed 3D simulations of compaction (i.e., inert cases) and detonation (i.e., reactive cases) have been simulated. The HMX crystals are loaded in the computational domain using algorithms for particle size distribution and shapes that yield desired packing fractions. The simulations were conducted with elastic-perfectly plastic models for the crystals. In these works, details of void dynamics, particularly the interactions between several voids subject to shock loading have not been elucidated. The present work, using a sharp interface treatment of the voids through the collapse stage [32], investigates and reveals several key aspects of the physics of void collapse and void–void interactions in an otherwise homogeneous matrix.
2 Governing equations and constitutive laws
The governing equations in Eulerian framework comprise a set of hyperbolic conservation laws [33]. Cast in Cartesian coordinates, the governing equations take the following form:
In (3–8), \({\vec {V}}\) is the velocity vector, \(\rho \) is the material density and \(E\) is the specific total energy of the material. The stress state of material is given by the Cauchy (true) stress tensor \({\varvec{\sigma }} ={{\varvec{S}}}-{{\varvec{P}}I,\, S}\) is the deviatoric stress and \(P\) is pressure. The strain rate tensor is denoted by D and \(G\) is the shear modulus of material. The integration of the mass, momentum and energy balance laws along with the evolution of the deviatoric stress components is performed assuming a pure elastic deformation (i.e., freezing the plastic flow) as an elastic predictor step, followed by a radial return mapping to bring the predicted stress back to the yield surface [34]. Equations (3–8) are cast in hyperbolic conservation law form in a conservative formulation with conserved variable, flux and source vectors explicated in [35]. Other details pertaining to constitutive equations, radial return algorithm and the Mie–Gruneisen equation for determining dilatational response have been laid out in previous work [35, 36]. The evolution of effective plastic strain (\(\bar{{\varepsilon }}_p )\) and temperature (T) included in governing equations is given by (7) and (8), respectively. In (8), c is the specific heat, k is thermal conductivity, \(\dot{W}_\mathrm{p} \) is the stress power due to plastic work and \(\beta \) is the Taylor–Quinney parameter [37]. For the application considered in this work, the conduction term (\(\nabla ^{2}T)\) is neglected as it is small compared to other two terms.
3 Methodology
The main objective of this work was to characterize and analyze the mechanisms which are important at relatively high speeds (particle velocities at or above 500 m/s), i.e., strong shocks interacting with typical void sizes in HMX (void diameters of the order of 10 \(\upmu \text{ m }\)) material without chemical reactions. In this setting the convective time scales are dominant, as these are very short (\(\text{ O }\sim 10^{-7}\text{ s }\)) compared to diffusive and diffusion time scales (\(\text{ O }\sim 10^{-5}\text{ s }\)). This dominance allows us to exclude viscosity and thermal diffusion by treating HMX as an elastic-perfectly plastic material [7]. Therefore, the physical mechanisms important in given regime will be plastic work and hydrodynamic impact. The response of a material (elastic-perfectly plastic) to high intensity (shock/impact) loading conditions is modeled. Details pertaining to material properties and Mie–Gruneisen equation of state parameters are listed in Tables 1 and 2, respectively.
The effect of compression on the melting point (\(T_\mathrm{m})\) of the HMX material is estimated based on the Kraut–Kennedy relation [38]:
where \(a=2( {\Gamma -\frac{1}{3}})\) and \(T_\mathrm{mo}\) is the melting temperature at atmospheric conditions, \(V_\mathrm{o}\) is the initial specific volume, and \(\Delta V\) is the change in specific volume. The yield strength is set to zero when the temperature is greater than the melting point of the material.
The computation of void collapse is performed by integration of the mass, momentum and energy balance laws along with the evolution of the deviatoric stress components, assuming a pure elastic deformation (i.e., freezing the plastic flow) as an elastic predictor step, followed by a radial return mapping to bring the predicted stress back to the yield surface [34]. A third-order TVD-based Runge–Kutta scheme [40] for temporal discretization and a third-order convex scheme [41] for spatial discretization are used. The void is defined as an embedded object using the level set [42] function, which is then tracked during the course of the simulation. The interface treatment is handled using a modified GFM (Ghost Fluid Method) approach [35]. The computational code has been validated by simulating a number of physical problems for high-speed impact and penetration in both two and three dimensions [32, 35]. This work carefully examines the physics of void interactions in a porous material. The calculations for void collapse with limit cases of theory on hydrodynamic collapse (Rayleigh) are also performed. The insights obtained from the present work are significant and novel and advance the understanding of the mechanics of void collapse when there are multiple voids interacting with shock loadings.
4 Results
4.1 Analysis of single void collapse
This section focuses on collapse of a cylindrical void in a HMX matrix material that is considered to be homogeneous. The computational setup is shown in Fig. 1 [32, 35, 39]. A cylindrical void with a radius of \(5\,\upmu \text{ m }\), within a HMX material, undergoes deformation as a result of shocked loading by imposing a particle velocity of 500 m/s at the bottom boundary as shown in Fig. 1. The imposed shock is given a rise time equivalent to a fraction (10 %) of the total time required by the shock to reach the lower surface of void.

Initial domain setup showing cylindrical void in HMX matrix
4.1.1 Grid independence study
A grid independence study for a single void is performed to establish the framework for further analysis. A void size of \(10\,\upmu \text{ m }\) in the HMX matrix is studied for different grid resolutions. A particle velocity of 500 m/s is prescribed on the south boundary. For a fixed domain of size \(30\,\upmu \text{ m } \times 30\,\upmu \text{ m }\), mesh sizes of \(150 \times 150, 200 \times 200, 300 \times 300\) and \(400 \times 400\) were used. Apart from the coarse case of \(150 \times 150\), the other mesh sizes were observed to have the same maximum temperature rise as shown in Fig. 2a. The time at which the significant rise in temperature occurred is the same for all mesh sizes. Two measures defining the response of the material were recorded throughout the calculation : (1) The maximum temperature recorded in the domain and (2) the effectiveness of conversion of the imposed shock energy into thermal energy; this was done by evaluating the ratio of total internal energy to total kinetic energy according to:
In 10, \(\rho \) is the material density, \(e\) is the specific total internal energy and \({\vec {V}}\) is the velocity. The integrals in 10 are evaluated over the computational domain (\(\Omega \)).

Grid-refinement studies for collapse of a single void with initial loading velocity of 500 m/s. a Maximum temperature in the domain. b Energy distribution in the domain
The evaluated ratio for different mesh sizes is shown in Fig. 2b. All the cases showed similar results for change in slope of curve as seen in Fig. 2b. As all the fine mesh resolution cases showed excellent agreement in temperature rise behavior and energy distribution, a mesh size of \(300 \times 300\) is selected for further computations. This mesh size corresponds to 100 grid points across the undeformed void diameter. Thus, as the void collapses the number of grid points in the void diminishes but the adopted grid was found to be adequate to capture the dynamics of the collapse throughout the collapse process. It is noted that the present work carries the computations through and beyond complete disappearance of the void, which is quite infrequently the case in the literature. In Lagrangian methods for solving void collapse phenomena, it is rather challenging to follow the void shape close to or beyond total collapse. The present technique, with the least-squares treatment described in [35] succeeds in maintaining robustness through and beyond the collapse process.
4.1.2 Temperature rise and energy distribution
When a homogeneous material is shock loaded, the rise in temperature is due to the bulk heating of the material. However, in a heterogeneous material, the contribution to the rise in temperature comes from different mechanisms (6). As can be seen from Fig. 3a, heterogeneities such as voids introduce enhanced sensitivity in the material and its response to an incoming shock is altered significantly. The main contributions in the rise of temperature in the case of a heterogeneous material for the given regime are plastic work and hydrodynamic impact. The process of void collapse following impact at the bottom surface to total hydrodynamic collapse of void and finally disappearance of void can be explained in five stages shown in Fig. 4. Stage 1 is the time before the shock reaches at the bottom surface of void. The energy of the shock wave itself causes \({\sim }60\,\text{ K } \) rise in temperature in the bulk solid material during stage 1. This stage is the same as impacting or shock loading a homogeneous material. In the second stage, the acceleration of material at the lower surface of the void occurs. However, this stage does not contribute much to temperature rise as shown in Fig. 3a. As the material starts accelerating, plastic deformation (stage 3) begins and the material begins to resist the deformation. The plastic work required to deform the material heats the material, resulting in a modest rise of temperature. Stage 4 involves total deformation of lower surface of void, jetting of the lower surface and impingement of the lower surface on the top surface resulting in hydrodynamic impact and a sharp rise in temperature to its peak (\({\sim }1{,}100\, \text{ K }\)) value. The impact phenomenon results in a secondary shock wave, which interacts with the initial shock wave resulting in complex wave patterns. Finally during stage 5, the hydrodynamic jet completely collapses the void and the void disappears.

Variation in a maximum temperature and b energy distribution with time for homogeneous and heterogeneous HMX material with initial loading velocity of 500 m/s

Different stages (1–5) showing the variation of temperature in a heterogeneous HMX material for a shock loading velocity of 500 m/s
An alternate way of looking at the above stages is in terms of the distribution of kinetic energy and internal energy. This can be investigated by taking the ratio of the total internal energy to the total kinetic energy over the whole domain (10) as shown in Fig. 3b. This measure is significant as it reveals the way in which energy is partitioned in the material due to the combined effects of shock loading and shock focusing at the void. It also leads to an understanding of the apportioning of energy in the material between the kinetic energy (inertia) and internal energy (thermal) modes. Figure 5 shows the velocity field at the five stages explained above depicting the role of kinetic energy in the material. The initial part, i.e., stage 1, of the curve with zero slope (Fig. 3b) represents the small rise in internal energy during the time taken by the shock to reach the lower surface of void. At stage 2, the material at the bottom surface of void starts accelerating resulting in increase in the kinetic energy as seen from the negative slope shown in Fig. 3b. As explained earlier, the material resists this plastic deformation resulting in a modest increase in temperature and hence a rise in the internal energy. This can be seen in stage 3 where the slope of the curve decreases in magnitude (Fig. 3b). At stage 4, there is a sharp rise in the curve due to conversion of the kinetic energy to the internal energy causing abrupt rise in temperature and pressure.

Different stages (1–5) showing the variation of velocity (vectors) in a heterogeneous HMX material for a shock loading velocity of 500 m/s
This happens when the lower void surface impinges on the upper surface. Finally at stage 5, the void collapses fully resulting in the culmination of the energy redistribution behavior. The interface evolution of the void collapse stages explained above is shown in Fig. 6.

Evolution of the interface representing a single void in the HMX material for a shock loading velocity of 500 m/s
It can also be seen from Fig. 5d that the collapse of the void results in a secondary cylindrical shock wave. This wave can interact with the voids downstream and can either enhance or diminish the intensity of the shock depending on the location of downstream void. This will be examined in the section below on the interaction of multiple voids.
4.1.3 Comparison with experiment
In a recently published paper, Swantek et al. [1] have performed experimental studies for the void collapse phenomenon in a mixture of agarose and glycerol gradient buffer. These studies were performed for the void sizes of 3 mm. The voids were modeled as a cylindrical tube which is the key modeling assumption in the present 2D study as well and, therefore, the present 2D results can be compared with experiments. The key observations made in experiments for a collapse of a single void are compared to computational results and can be summarized as follows:
-
1.
During the early stage of collapse, the region upstream of the void has a velocity significantly greater than the free stream velocity. In stage 2 shown in Fig. 5b, the velocity is \({\sim }\)1,250 m/s, more than twice the value of free stream velocity. The magnitude of the vertical component of the velocity approaches more than three times the magnitude of free stream velocity (500 m/s) immediately before the collapse of the void as observed in experiments. This can be seen in stage 3 of Fig. 5.
-
2.
A shielding region of zero velocity downstream the void is shown in (stages 1–stage 3) Fig. 5 and is also observed in the experiments. This happens due to the diffraction of the shock wave around the void leaving the immediate downstream region with low particle velocities.
-
3.
The results for normalized void diameter with normalized collapse time were also compared and are shown in Fig. 7. The initial period of acceleration corresponding to normalized time of 0.25 as observed in Fig. 7 was in good agreement with the results of Swantek et al. [1].
Fig. 7 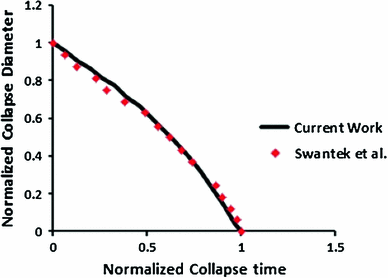
Normalized time vs. normalized diameter for a single cylindrical void. The results from current computation are compared with Swantek et al. [1]
-
4.
In the present work, the impact speeds are high enough that the void collapse phenomenon falls in the hydrodynamic regime. Therefore, the void collapse times should be comparable to Rayleigh collapse times [43] for a bubble. Rayleigh defined the time of collapse for a spherical bubble, \(t_\mathrm{c}\) in terms of its radius \(R\), the pressure at infinity \(P_{\infty }\) and the internal pressure \(P_\mathrm{{v}}\) as
$$\begin{aligned} t_\mathrm{{c}} =0.915\left( {\frac{\rho }{P_\infty -P_\mathrm{v} }} \right) ^{0.5}R \end{aligned}$$(11)Johnsen et al. [44] have observed the time of collapse of a bubble for a pressure ratio of 714. It was observed that shock collapse times are one time unit greater than the Rayleigh collapse time [1, 44]. Rayleigh collapse times for three different speeds (500, 1,000 and 1,500 m/s) were compared with void collapse times from the current simulations. Figure 8 shows that the void collapse times are one time unit higher than the Rayleigh collapse time which is in good agreement with [1] and [44]. This difference between the present collapse behavior (albeit predominantly hydrodynamic in nature) can be because of the plasticity effects and due to the finite size of the void, leading to shock passage times around the void. In fact, it is shown in Fig. 8 that the void collapse time coincides with the Rayleigh line if the time for shock passage around the void is subtracted from the total passage time. Thus, plasticity and other effects play only a minor role in the collapse of the void in the hydrodynamic collapse regime of interest in this work. This is supported by the temperature and energy curves shown in Fig. 3, where plasticity effects manifest in the relatively short period labeled as stage 3.


Normalized collapse time \(( {\frac{t_\mathrm{{co}} }{R}})\) vs. pressure ratio for cylindrical voids is shown. A comparison with Rayleigh collapse time \(( {t_\mathrm{{c}} =0.915({\frac{\rho }{P_\infty -P_\mathrm{{v}} }})^{0.5}R})\) is also shown
4.2 Multiple voids
4.2.1 Inline voids
As shown in the above cases, when an isolated void collapses a secondary shock wave emanates from the point of collapse and can affect the load imposed on the voids downstream. The conventional notion of void–void interactions in a shocked heterogeneous material is that in a field of voids, the collapse of one void will lead to strong pressure waves and temperature pulses, which will lead to enhanced intensity of collapse of the surrounding voids. To examine this effect, the interaction among voids is studied by first focusing on two voids and then generalizing the findings obtained to fields of voids. To study the effect of mutual separation and position of two voids in an otherwise homogeneous material, the vertical gap (\(G_\mathrm{v})\) between voids was varied from \(0.5D\) to \(2D\) (Fig. 9a), where \(D\) is the diameter of a void.

Variation in a maximum temperature in the domain and b energy distribution with time for tandem inline voids in a cylindrical setting with an initial loading velocity of 500 m/s. c The snapshots of shape of the voids before collapse and d the corresponding peaks in maximum temperature
For \(G_\mathrm{v}=0.5D,\) the first (i.e., upstream) void behaves in a similar manner as a single void, but the results for the second (downstream) void is counterintuitive as (from Figs. 9a, 10) there is no further increase in maximum temperature following its collapse. Moreover, the downstream void collapses with much lower temperature compared to the upstream void as shown in Fig. 9a. This is due to “shielding” [1] of the downstream void. As seen from Fig. 11a–b, the velocity immediately above the upstream void is close to zero even at the later stages of its collapse. This results in complete shielding of downstream void from the incoming shock wave. The downstream void is not exposed to any flow until the upstream void has completely collapsed. This reduced interaction of the downstream void with the incident shock wave results in a much lower collapse temperature.

Snapshots of temperature field for inline tandem voids with \(G_\mathrm{v}=0.5D\) and an initial loading velocity of 500 m/s

Snapshots of velocity field (vectors) for inline tandem voids with \(G_\mathrm{v}=0.5D\) and an initial loading velocity of 500 m/s
Another interesting finding from the computations is the difference in the collapse behavior of void 2 for all the three cases (\(G_\mathrm{v}= 0.5D,D\) and \(2D\)) shown in Fig. 9. First, it can be clearly seen from Fig. 9 that for all the cases with tandem voids, the void 1 behaved similar to the single void scenario. However, this is not true for the void 2 as the maximum collapse temperature is different for all the three cases shown.
The shape of void 1 at an instant near full collapse, as shown in Fig. 9c, clearly indicates a rather uniform compression of the void with the lower surface assuming a flattened shape before impacting the top surface of the void. This results in a sharp rise in temperature as shown by the formation of a peak in the maximum temperature curve. Note that there is a slight irregularity in the peak as the impact is not entirely flat and there can be more than one contact point as the void collapses. This connection between the shape of the void before collapse with the maximum temperature can be used to explain the behavior of void 2 for all three gaps for the second void.
For \(G_\mathrm{v}=0.5D,\) void 2 is in the proximity of void 1. The shape of void 2 before collapse (Fig. 9c) clearly indicates an impinging jet formed during the collapse of void 1. The void first pinches into smaller voids which then subsequently collapse. However, the temperature rise due to collapse of void 1 is such that the material reaches temperature greater than the melting point of HMX. This causes the surrounding material to lose strength resulting in a softer material (lower density) and thus the inertia of the jet impinging on void 2 is lower than for the other gaps. This leads to smaller impact energy of the jet for void 2 at \(G_\mathrm{v}=0.5D\) and hence lowers the maximum collapse temperature. The number of irregular peaks in this case clearly reflects the collapse mechanism as the void 2 is split into two voids of substantial size (see Fig. 12) which again collapse resulting in the formation of multiple peaks in the temperature trace.

Evolution of void collapse in case of inline tandem voids with \(G_\mathrm{v}=0.5D\) and an initial loading velocity of 500 m/s: a upstream void and b downstream void
For \(G_\mathrm{v}=D,\) void 2 is at an optimal distance from the void 1. This results in substantial contribution of the impinging jet in the collapse mechanism of void 2. Note that the highest temperature in this case is observed during the very first impact which corresponds to the jet impact. The second peak in this case has a lower magnitude (see Fig. 9d) compared to the first clearly indicating corresponding to the collapse of smaller voids remaining after the jet has pinched off the void leaving behind two small satellite voids. The temperatures in the case of \(G_\mathrm{v}=D\) are higher because the larger void separation compared to the \(G_\mathrm{v} =0.5D\) case implies that the material surrounding the void is not weakened by the softening (due to melting) of the material when void 1 collapses. Hence, even though the jet is not as pronounced in the case of \(G_\mathrm{v}=0.5D\), the kinetic energy converted to internal energy during impact is higher (see Fig. 9b).
For \(G_\mathrm{v}=2D,\) void 2 is sufficiently far from void 1 that the strength of the impinging jet is rather small and the void is beginning to assume the same shape at collapse as void 1, i.e., jet formation is not as pronounced in this case. This is indicated by both the shape before collapse and the maximum temperature profile (see Fig. 9). However, the magnitude of maximum temperature for void 2 is less than the void 1 due to the shielding effect of void 1 as even at this gap of \(2D\), the incident shock does not fully attack void 2.
Thus, the observed behaviors for the three gaps, while all sharing the common feature of shielding by void 1, lead to different temperature excursions upon impact due to the different shapes and impact energies developed at the three different gaps.
4.2.2 Offset voids
As discussed above, the main goal of this study is to understand the behavior of shock loading of a porous energetic material with randomly placed multiple voids. While the above section dealt with inline voids, the offset setting can be one of the arrangements among any two voids in a random arrangement.
The inline voids separated with \(G_\mathrm{v}=0.5D\) discussed above were offset with a distance (\(G_\mathrm{h})\) varying from \(D\) to \(2.5D\). Here \(G_\mathrm{h}\) is the horizontal (offset) distance between the centers of two voids as shown in Fig. 13a. When the voids are in an offset condition as opposed to inline, since the downstream void is not in the direct path of the hydrodynamic jet emanating from the first void, the temperature rise due to collapse of second void is higher than any of the inline cases shown above. The setup and profile of maximum temperature for these cases are shown in Figs. 13a and 14.

a Variation in maximum temperature in the domain with time for three different offset arrangements and an initial loading velocity of 500 m/s. b Comparison of maximum temperature reached in the domain for different offset arrangements

Snapshots of temperature field for an offset arrangement with \(G_\mathrm{h}=1.375D\) and an initial loading velocity of 500 m/s
It is observed that initially, as \(G_\mathrm{h} \) is increased, the downstream void collapses with a higher temperature. But for \(G_\mathrm{h} \!\!>\!\!1.375D\), the value of maximum temperature falls as shown in Fig. 13b. As the gap is increased further, the downstream void is not influenced by the upstream void and behaves as a single void. This happens for \(G_\mathrm{h} =2.5D\). The rather significant rise in temperature of downstream void in the case of \(2D>G_\mathrm{h}>1.125D\) is due to uniform compression and due to the effect of a secondary shock wave initiated by the collapse of the upstream void.
This two-way compression due to incident shock and the secondary shock is depicted by the velocity vectors shown in Fig. 15 and is also observed in the interface evolution of the downstream void (Fig. 16b).

Snapshots of velocity field (vectors) for an offset arrangement with \(G_\mathrm{h}=1.375D\) and an initial loading velocity of 500 m/s

Evolution of void collapse for an offset arrangement with \(G_\mathrm{h}=1.375D\) and an initial loading of 500 m/s: a upstream void and b downstream void
4.2.3 Voids at 10 % volume fraction in a porous material
As was shown in the previous cases, the interaction between two voids in an otherwise homogeneous matrix can lead to a range of responses depending on the position of one void relative to other voids. Inline voids can lead to shielding effects, while offset voids can lead to enhancement of the collapse phenomenon due to the combination of the incident shock and shocks reflected from other voids. In this section, we examine the effect of collections of voids accounting for a range of void volume fraction (10–25 %) distributed randomly in a homogeneous HMX material. The initial loading velocity of 500 m/s is used for all the cases. The domain size is \(100\,\upmu \text{ m } \, \times \, 100\,\upmu \text{ m }\) with a uniform grid size of \(0.1\,\mu \text{ m }\). This level of resolution corresponds to approximately 100 mesh points along the (undeformed) void diameter. A parallelized version of the code was used to accommodate the rather heavy computational loads required to solve the problem, details of which are given in [36, 45]. A total of 24 processors were used to decompose the computational domain. The initial domain decomposition with embedded voids represented as level sets is shown in Fig. 17a. Figure 17b shows the initial configuration of voids with the voids being numbered from 1 to 10, to track the temperature of each void individually during collapse. The maximum temperature peaks corresponding to numbered voids and variation of energy distribution are shown in Fig. 18a and b, respectively.

a Voids embedded using level set function in the initial domain. b Initial configuration with voids being numbered from 1 to 10

Variation of a maximum temperature and b energy distribution in the domain with time for 10 % void volume fraction. Numbers (1–10) correspond to collapse of numbered voids in initial configuration
The results shown in the above sections for inline and offset arrangements of two voids are useful in understanding the behavior of the voids in the random arrangement by observing the relative position of voids and the corresponding peaks in maximum temperature during their collapse, as shown in Fig. 18a. The void 1 and void 2 collapse just as in a single void case; void 3 collapses with a temperature slightly lower than single void case. The offset effect observed in the previous section can be seen in the collapse of void 4 and void 5, which collapse with a significantly higher temperature. The void 6 which is shielded by void 4 collapses with a lower temperature demonstrating the shielding effect. The offset effect can be seen again in the collapse of void 7 and void 10. The void 8, which has \(G_\mathrm{v}\sim 2D\) from void 5 collapses with the same temperature as void 5. The same scenario is observed for void 9 which has \(G_\mathrm{v}\sim 2D\) from void 7.
For the above case, from Fig. 18b, the ratio of the internal energy to the kinetic energy can be seen to decrease before the collapse of void 1 and void 2 due to increase in velocity of material at the lower surface of voids. But the internal energy increases after the collapse of void 1 and void 2 due to hydrodynamic impact which raises the temperature and pressure. As the void collapse is a local phenomenon, the global energy distribution does not give a clear picture of the response of the material with increase in number of voids. As observed for all the voids, the slope of the curve decreases with increase in the kinetic energy before the collapse of the void but again switches sign due to the combined effect of plastic work and hydrodynamic impact; however, these changes are attenuated after the collapse of the first few voids due to the complex interaction of shock fronts and the energy being released by the various voids nearly simultaneously. It can also be seen that the after the collapse of the last void (void 10), the ratio of the internal energy to kinetic energy is close to 1. This indicates that, from the point of view of the spatially averaged energy deposition into the material due to the imposed shock loading, the sample is behaving as a nearly homogeneous (but porous) material. This nearly homogeneous behavior, however, masks the highly localized excursions of the temperature in the material, specifically at the void collapse sites, i.e., there are still hot spots that exist in the material. In terms of the run-up to detonation, the homogenized thermal energy picture therefore does not capture the local hot spot formation; these hot spots can initiate chemical reactions locally and the accumulated effects of these reaction fronts can lead to the formation of a detonation front leading to initiation.
The temperature field corresponding to two different times (18 and 32 ns) is shown in Fig. 19. The temperature field clearly shows the local hot spots where the temperature is much higher compared to bulk temperature of the material.

Snapshots of temperature field for 10 % void volume fraction in HMX material at two instants: a \(18\,\upmu \text{ s }\) and b \(22\,\upmu \text{ s }\)
4.2.4 Voids at 15–25 % volume fraction of HMX
For higher void volume fraction, the maximum temperature is observed to be highly dependent on the relative position of two voids in the matrix and not on the overall volume fraction; in fact, as the void fraction is varied at least one void exists which collapses forming a hot spot with temperatures in the range of 1,600–1,800 K. Considering the case of 25 % void volume fraction, the initial configuration of the HMX sample and a snapshot of temperature profile in the sample at \(40 \upmu \text{ s }\) is shown in Fig. 20.

Voids as 25 % volume fraction in HMX material. a Initial configuration. b Snapshots of temperature field at 40 ns
This case with 25 % void volume fraction had only few voids (\(<50\) %) collapse with temperatures \(>1{,}000\) K. These voids are labeled with their respective numbers in Fig. 21a. This is due to increased shielding effect with increase in void volume fraction as seen in Fig. 21a. The energy distribution as measured by the ratio of total internal energy to total kinetic energy gets close to one with increase in number of voids as shown in Fig. 21b.

Voids as 25 % volume fraction in HMX material. a Variation in maximum temperature with time. b Variation in energy distribution with time
The comparison of maximum temperature achieved in a given sample of HMX with variation of void volume fraction is shown in Fig. 22. This clearly depicts that the maximum temperature achieved in a given HMX sample is independent of void volume fraction and is more dependent on different inline and offset configurations of voids locally.

Variation of maximum temperature in a given HMX sample as a function of void volume fraction. The shock loading velocity is 500 m/s in all the cases
A comparison of energy distribution for different volume fractions is shown in Fig. 23 indicating the material behavior as nearly homogeneous till the collapse of the last void. The ratio remains close to 1 till the collapse of last void in the sample but increases eventually. The increase in energy distribution ratio after the collapse of all the voids is due to decrease in kinetic energy after the collapse of the last void.

Variation of energy distribution for different HMX samples with void volume fraction ranging from 0 % (homogeneous) to 20 %. The shock loading velocity is 500 m/s in all the cases. a Variation with total time. b Variation with normalized time
To capture the essential insights of the present study as it relates to the response of shocked materials consisting of voids, two plots showing the variation of total internal energy and total kinetic energy with time for various void fractions are shown in Figs. 24 and 25, respectively.

Variation of total internal energy for different HMX samples with void volume fraction ranging from 0 % (homogeneous) to 20 %. The shock loading velocity is 500 m/s in all the cases. a Variation with total time. b Variation with normalized time

Variation of total kinetic energy for different HMX samples with void volume fraction ranging from 0 % (homogeneous) to 20 %. The shock loading velocity is 500 m/s in all the cases. a Variation with total time. b Variation with normalized time
It can be seen from Fig. 24a that increase in porosity results in increase in the shock traversal time for a given sample. This is due to increase in the shock equilibration times as it traverses through the porous material; multiple shock reflections and diffractions around the voids and the interactions of shocks emanating from collapsing voids with the incident shock and with the reflected waves lead to the longer equilibration times. Figure 24b shows that for a given shock strength, the increase in porosity leads to increased conversion of kinetic energy into thermal energy as there are many locations, i.e., at the voids, where this conversion can take place. The distribution of kinetic energy is shown in Fig. 25a and b. The increase in total kinetic energy is also similar to increase in total internal energy until the collapse of the last void. However, the kinetic energy decreases sharply after the collapse of the last void as the shock focusing effect is lost. The sharp decrease in the kinetic energy results in the sudden increase in energy distribution ratio after the collapse of the last void as observed in Fig. 23.
5 Conclusions
This study applied the techniques developed in previous papers [35, 36, 45] to study the response of a porous material to shock insult. The void collapse process in the presence of a collection of voids is studied computationally, carrying the computations beyond the collapse stage of individual voids. Several important physical insights were obtained from this study, consistent with recently published experimental observations [1] of the response of 2-dimensional void arrays in a model material.
To gain an understanding of void interactions, two interacting voids were first simulated, with the voids placed at various distances apart in an inline and offset fashion. It was found that the secondary shock wave generated from the collapse of an upstream void will not always have important consequences on voids downstream. A counterintuitive result found in this study is that if the downstream voids are separated by a gap of less than one diameter from the upstream one and are in line with the upstream void, the hot spot formed when the downstream void collapses will be weaker than that formed upon the collapse of the upstream (or isolated) void. This happens due to two physical mechanisms. First due to the shielding effect of the upstream void on the downstream void, i.e., the incident shock wave tends to diffract around the upstream void, and therefore, the downstream void does not feel the full impact of the incident shock. The second reason is the proximity of collapse of the upstream void to downstream void leading to local melting of the surrounding material resulting in smaller impact energy of the jet for downstream void. For gaps approaching the diameter of the void, the reinforcing effect of the secondary shock wave is maximum resulting in relatively higher collapse temperatures.
The effect of lateral offset (with respect to the orientation of the incident shock) in void position is interesting as well. The offset void setting showed that the secondary shock wave can have an intensifying effect leading to an increase in temperature (over that of an isolated void) upon collapse of the void downstream; this is because the downstream void is compressed by the incident shock as it is not shielded by the upstream void and it is also further compressed by the secondary shock wave generated due to collapse of the upstream void. This dual-mode compression results in a significant rise of temperature in the case of offset voids compared to the inline tandem voids.
The understanding gained from the simulations of two interacting voids was useful in analyzing a system with many voids. The void behavior in the case of 10–25 % void volume fraction correlated very well with the behavior of the inline tandem voids and offset voids. It was observed that the increase in the void volume fraction had no influence on maximum temperature achieved in the HMX sample. However, the increased shielding effect was observed with the increase in void volume fraction. For higher volume fractions, the energy distribution represented by the ratio of total internal energy to total kinetic energy depicted the material to be nearly homogeneous till the collapse of last void. This was due to the localized nature of void collapse phenomenon which was masked in a volume-averaged global picture of energy distribution. Overall, the findings of this study clearly showed that the void collapse is a local phenomenon and the traditional models based on continuum theories, where the microstructural heterogeneities of the material are ignored or homogenized, will not give an adequate picture of initiation events or mechanisms such as hot spot formation due to void collapse. The void–void interactions studied here showed that these local events can be counterintuitive and can have enormous influence on material behavior at macro level. Thus, detailed micromechanical models of void dynamics in shocked material will prove necessary to adequately model the response of porous energetic materials. The extension of the present study to the reactive case, following the lines of the single void analysis in previous work [6] is underway.
References
Swantek, A., Austin, J.: Collapse of void arrays under stress wave loading. J. Fluid Mech. 649(1), 399–427 (2010)
Khasainov, B., Borisov, A., Ermolaev, B., Korotkov, A.: Two-phase visco-plastic model of shock initiation of detonation in high density pressed explosives. In: 7th Symposium (International) on Detonation, Annapolis, MD, pp. 435–447 (1981)
Baer, M., Nunziato, J.: A two-phase mixture theory for the deflagration-to-detonation transition (DDT) in reactive granular materials. Int. J. Multiph. Flow 12(6), 861–889 (1986)
Lee, E., Tarver, C.: Phenomenological model of shock initiation in heterogeneous explosives. Phys. Fluids 23(12), 2362–2372 (1980)
Tran, L., Udaykumar, H.: Simulation of void collapse in an energetic material, Part 1: inert case. J. Propuls. Power 22(5), 947–958 (2006)
Tran, L., Udaykumar, H.: Simulation of void collapse in an energetic material, Part 2: reactive case. J. Propuls. Power 22(5), 959–974 (2006)
Menikoff, R., Sewell, T.: Constituent properties of HMX needed for mesoscale simulations. Combust. Theory Model. 6(1), 103–125 (2002)
Bowden, F., Yoffe, A., Levy, P.: Fast reactions in solids. Phys. Today 12(6), 58–60 (1959)
Chaudhri, M., Field, J.: The role of rapidly compressed gas pockets in the initiation of condensed explosives. In: Proceedings of the Royal Society of London. Series A, Mathematical and Physical Sciences, vol. 340, no. 1620, pp. 113–128 (1974)
Mader, C.: Numerical Modeling of Explosives and Propellants. CRC Press, Boca Raton (1998)
Field, J.: Hot spot ignition mechanisms for explosives. Acc. Chem. Res. 25(11), 489–496 (1992)
Baer, M.: Modeling heterogeneous energetic materials at the mesoscale. Thermochimica Acta 384(1–2), 351–367 (2002)
Menikoff, R., Kober, E.: Compaction waves in granular HMX. In: AIP Conference Proceedings, pp. 397–400. Iop Institute of Physics Publishing Ltd (2000)
Baer, M.R.: Mesoscale modeling of shocks in heterogeneous reactive materials. Energ. Mater. 384(1–2), 321–356 (2007)
Wright, T.W., Batra, R.C.: The initiation and growth of adiabatic shear bands. Int. J. Plast. 1(3), 205–212 (1985)
Menikoff, R.: Hot spot formation from shock reflections. Shock Waves 21(2), 141–148 (2011)
Bowman, A.L., Forest, C.A., Kershner, J.D., Mader, C.L., Pimbley, G.H.: Numerical modeling of shock-sensitivity experiments. In: symposium on detonation, A., MD, USA, 19 Jun 1981, p. 9. Los Alamos Scientific Lab., NM (USA) (1981)
Johnson, J., Tang, P., Forest, C.: Shock-wave initiation of heterogeneous reactive solids. J. Appl. Phys. 57(9), 4323–4334 (1985)
Mali, V.: Flow of metals with a hemispherical indentation under the action of shock waves. Combust. Explos. Shock Waves 9(2), 241–245 (1973)
Anderson, C.E.: An overview of the theory of hydrocodes. Int. J. Imapact Eng. 5(1–4), 33–59 (1987)
Wackerle, J., Rabie, R., Ginsberg, M., Anderson, A.: Shock initiation study of PBX-9404. In: Pressures, S.I.o.H.D. Commissariat a l’Energie Atomique, Paris, France (1978)
Tarver, C.M.: What is a shock wave to an explosive molecule? In: AIP Conference Proceedings, Atlanta, Georgia (USA), pp. 42–52 (2002)
Menikoff, R.: Pore collapse and hot spots in HMX. In: AIP Conference Proceedings, Portland, Oregon (USA), pp. 393–396 (2004)
Anslyn, E.V., Dougherty, D.A.: Modern Physical Organic Chemistry. University Science Books, Sausalito (2006)
Zhang, F., Thibault, P.A., Link, R.: Shock interaction with solid particles in condensed matter and related momentum transfer. In: Proceedings of the Royal Society of London. Series A: Mathematical, Physical and Engineering Sciences, vol. 459, no. 2031, pp. 705–726 (2003)
Chitanvis, S.M.: Hotspot mechanisms in shock-melted explosives. In: AIP Conference Proceedings, Portland, Oregon (USA), pp. 319–322 (2004)
Cooper, S., Benson, D., Nesterenko, V.: A numerical exploration of the role of void geometry on void collapse and hot spot formation in ductile materials. Int. J. Plast. 16(5), 525–540 (2000)
Frost, D., Aslam, T., Hill, L.: Application of detonation shock dynamics to the propagation of a detonation in nitromethane in a packed inert particle bed. In: AIP Conference Proceedings, Snowbird, Utah (USA), pp. 821–824 (2000)
Reaugh, J.: Grain-scale dynamics in explosives. In: Technical Report. Lawrence Livermore National Lab., Livermore (2002)
Benson, D.: Computational methods in Lagrangian and Eulerian hydrocodes. Comput. Methods Appl. Mech. Eng 99(2–3), 235–394 (1992)
Menikoff, R.: On beyond the standard model for high explosives: challenges & obstacles to surmount. In: AIP Conference Proceedings on Matter, P.o.t.A.P.S.T.G.o.S.C.o.C, Nashville (Tennessee), pp. 18–25 (2009)
Kapahi, A., Sambasivan, S., Udaykumar, H.S.: Simulation of collapse and fragmentation phenomena in a sharp interface Eulerian setting. Comput. Fluids (2012 in press)
Kulikovskiĭ, A.G., Pogorelov, N.V.: Semenov. Mathematical Aspects of Numerical Solution of Hyperbolic Systems. CRC Press, Boca Raton (2001)
Simo, J., Hughes, T.: Computational Inelasticity. Springer, Berlin (2008)
Sambasivan, S., Kapahi, A., Udaykumar, H.S.: Simulation of high speed impact, penetration and fragmentation problems on locally refined Cartesian grids. J. Comput. Phys. (2012 in press)
Kapahi, A., Mousel, J., Sambasivan, S., Udaykumar, H.S.: Parallel, sharp interface eulerian approach to high-speed multi-material flows. Comput. Fluids (2012 in press)
Camacho, G.T., Ortiz, M.: Adaptive Lagrangian modelling of ballistic penetration of metallic targets. Comput. Methods Appl. Mech. Eng. 142(3–4), 269–301 (1997)
Poirier, J.P.: Introduction to the Physics of the Earth’s Interior. Cambridge Univ Press, London (2000)
Kapahi, A., Sambasivan, S., Udaykumar, H. S.: A three-dimensional sharp interface Cartesian grid method for solving high speed multi-material impact, penetration and fragmentation problems. J. Comput. Phys. (2013) doi:10.1016/j.jcp.2013.01.007
Shu, C.W., Osher, S.: Efficient implementation of essentially non-oscillatory shock capturing schemes II. J. Comput. Phys. 83(1), 32–78 (1989)
Liu, X., Osher, S.: Convex ENO high order multi-dimensional schemes without field by field decomposition or staggered grids. J. Comput. Phys. 142(2), 304–330 (1998)
Sethian, J.A.: Level set methods and fast marching methods. J. Comput. Inf. Technol. 11(1), 1–2 (2003)
Leighton, T.: The Acoustic Bubble, vol. 10. Academic Press, New York (1997)
Johnsen, E., Colonius, T.: Numerical simulations of non-spherical bubble collapse. J. Fluid Mech. 629, 231–262 (2009)
Kapahi, A., Mousel, J., Sambasivan, S., Udaykumar, H.S.: Three dimensional compressible multi-material flow computations using a parallelized levelset-based solver. In: Plasticity of Crystalline Materials: From Dislocations to Continuum. Wiley, New York (2011)
Acknowledgments
This work was performed under grants from the AFOSR Computational Mathematics program (Program Manager: Dr. Fariba Fahroo) and from the AFRL-RWPC (Computational Mechanics Branch, Eglin AFB, Program Manager: Dr. Michael E. Nixon).
Author information
Authors and Affiliations
Corresponding author
Additional information
Communicated by F. Zhang.
Rights and permissions
About this article
Cite this article
Kapahi, A., Udaykumar, H.S. Dynamics of void collapse in shocked energetic materials: physics of void–void interactions. Shock Waves 23, 537–558 (2013). https://doi.org/10.1007/s00193-013-0439-6
Received:
Revised:
Accepted:
Published:
Issue Date:
DOI: https://doi.org/10.1007/s00193-013-0439-6