
Abstract
Test case prioritization reorders test cases based on their fault detection capability. In regression testing when new version is released, previous versions’ test cases are also executed to cross check the desired functionality. Historical data ensures the previous fault information, which would lead the potential faults in new version. Faults are not uniformed in all software versions, where similar test cases may stack in same faults. Most of the prioritization techniques are either similar coverage based or requirements clustering, where some used historical data. However, no one incorporate dissimilarity and historical data together, which ensure the coverage of various un-uniformed faults. This paper presents a prioritization approach based on dissimilarity test case clustering using historical data analysis to detect various faults in minimum test case execution. Proposed scheme is evaluated using well established Defects4j dataset, and it has reported that dissimilarity algorithm performs better than untreated, random and similarity based prioritization.
Access provided by CONRICYT-eBooks. Download conference paper PDF
Keywords
1 Introduction
Test case prioritization reorders test case execution sequence to enhance fault detecting rate. In regression testing earlier versions of test cases are considered for testing new functionalities. Regression testing involves revalidating the software when new component is included to meet the modified requirements which may badly impact on existing software system [1]. This revalidating process executes both existing and newly added test cases, which is very expensive and time consuming [2].
It has been experimented that more than 50 days are required to test 20,000 lines of code [1].
Hence, diverse techniques are proposed in order to improve regression testing performance on the basis of cost effectiveness [1, 3, 4], which are categorized into three different techniques namely test suite reduction, test case selection, and test case prioritization [3]. Test case prioritization reorders test cases in such a way so that it meets testing objectives, for example fault detection rate and code coverage or quick feedback [4]. Faults are not uniformed in previous version of software, which is difficult to detect in regression testing [5].
Researchers introduced several prioritization methods of test cases to increase the rate of fault detection, which are categorized in several domains, such as code coverage [4, 6, 7], requirement coverage [8, 9], historical data analysis based [10, 11], etc. Based on historical execution data, dynamic regression test case prioritization using requirement priority was proposed by Wang et al. [10]. While, Rothermel et al. described several code coverage based prioritization strategies to improve the rate of fault detection [3]. A modified genetic algorithm for prioritizing test cases to improve code coverage was proposed by Patipat et al. [6]. Xiaobin et al. proposed Bayesian Network based test case prioritization technique, where test cases are clustered depend on their method level coverage [12].
On the other hand, Clustering based test case prioritization introduced by [8, 9], where test cases are clustered based on their code coverage to improve earlier fault detection in testing phase. However, clustering test cases based on their coverage information contain threat to detect similar fault consecutively as each cluster contains similar type of test cases. Accordingly, those test cases in each cluster share similar attribute have similar fault detection ability and consequently get similar precedence which may lead to reduce the effectiveness of fault detection rate.
This problem can be illustrated with the following example, where nine test cases cover nine faults of a program as shown in following Table.
F/T | F1 | F2 | F3 | F4 | F5 | F6 | F7 | F8 | F9 |
|---|---|---|---|---|---|---|---|---|---|
TC1 | 1 | 0 | 0 | 1 | 1 | 1 | 1 | 0 | 0 |
TC2 | 0 | 1 | 1 | 1 | 1 | 1 | 0 | 0 | 0 |
TC3 | 0 | 1 | 1 | 1 | 0 | 0 | 1 | 1 | 0 |
TC4 | 0 | 1 | 1 | 0 | 0 | 0 | 1 | 1 | 1 |
TC5 | 1 | 0 | 0 | 0 | 0 | 1 | 1 | 0 | 1 |
TC6 | 1 | 0 | 0 | 0 | 1 | 1 | 1 | 0 | 1 |
TC7 | 1 | 1 | 1 | 1 | 0 | 0 | 0 | 1 | 0 |
TC8 | 1 | 0 | 0 | 0 | 0 | 1 | 0 | 0 | 0 |
TC9 | 1 | 1 | 1 | 1 | 0 | 1 | 0 | 0 | 0 |
Most of the test cases of cluster-1 cover faults F1, F6 and F7 where none of the test case covers F2, F3 and F8 faults. In case of cluster-2, faults F2 and F3 covered by all test cases but no one covers fault F1. In cluster-3, both test cases cover faults F1, F3, F4 and F9, however, faults F5 and F7 do not covered by any single test case. In this scenario, any single cluster can’t cover all or maximum faults, which is the problem of clustered based test case prioritization which shares same properties.
To overcome those limitations, dissimilarity based test case prioritization scheme is proposed in this research, where test case’s similarity and historical failure data are incorporated. In this proposed scheme, all the previous and new versions test cases are considered to detect the similar function call graph. Several clusters are formed from this graph based on their degree of connectivity. Inter cluster test cases are ordered based on the preceding version failure history. Finally, the top test cases of each similar cluster are picked to generate the dissimilar test suite to cover maximum varieties of un-uniformed faults.
Proposed method has been experimented with Defects4j dataset [13], and results are compared to several prominent prioritization techniques. It has been discovered that the dissimilarity based test suite using historical data performs better than untreated, random and similarity based prioritization approaches.
The rest of this paper is organized as follows, where Sect. 2 denotes the literature review. Sections 3 and 4 described the proposed method and result analysis respectively. Finally Sect. 5 concludes this paper with future research direction.
2 Literature Review
Test case prioritization technique rearranges test case execution sequence to maximize testing objective functions, like fault detection rate improvement, reducing execution time etc. Because of significance in practice, many academicians, researchers and testers have demonstrated varieties methods of test case prioritization, which are categorized in several domains, such as code coverage [4, 6, 7], requirement coverage [8, 9], historical data analysis based [10, 11], etc. Some of the most prominent prioritization approaches are discussed in this section.
Rothermel et al. demonstrated a number of prioritization strategies to improve fault detection rate [4]. The proposed method uses most advantageous prioritization for finest test case orders to increase fault detection rate. They performed empirical studies to evaluate quality, importance and quantity of the rate of fault detection of different techniques. Empirical studies and results indicate that their proposed approach can efficiently detect the fault early of the execution.
To improve testing efficiency, history based dynamic regression test case prioritization using requirement priority was proposed by Wang et al. [10]. In this research work, test cases are prioritized with the priority of requirements assigned by customers and developers. The initially prioritized test cases are executed and numbers of faults detected by test cases are recorded to be used for next version requirement priority. The differences of requirement priority between two adjacent test cases reorder the execution sequence dynamically. An industrial experimentation has been performed in order to evaluate the technique, and result analysis shows that the proposed history based prioritization method improves testing effectiveness and fault detection ability than random and other methods. However, the efficiency of this technique depends on how accurately requirement priority has been assigned by customers and developers. Biased requirement priority assignment may affect the deserved prioritization effectiveness.
Patipat et al. implemented a modified genetic algorithm for prioritizing test cases to improve code coverage [6]. A control flow graph has been generated based on the selected program, which was derived to get decision graph. Test cases are randomly generated from the decision graph according to the population size (number of test cases). Test cases are preprocessed before feed as chromosome in genetic algorithm, to overcome the unwanted and dislocated desired path. Test suites are formed using selected test cases measuring conditions covered by each test case. The fitness value of every test case has been determined based on the coverage information, which are used to rank the suites. Finally, using fitness value, test suites have been ranked which is measured counting total coverage. After applying the genetic algorithm on test suite, the experimental result shows that modified genetic algorithm performs better than Bee Colony and random approach. However, generating complex decision graph for large scale software may overhead of this approach.
A Bayesian Network (BN) based novel prioritization framework has been proposed to improve fault detection rate by Siavash et al. [7]. The framework takes program modification, tendency of fault occurrence and test case coverage information as a single input and produces the probability of test case as output. The different evidence sets have been extracted from the source code, which are integrated to single BN model. The experimental result shows that proposed method performs better than other implemented techniques, if the available faults are remarkable. However, in this proposed approach, several test cases may indicate similar faults in execution.
Xiaobin et al. proposed an enhanced Bayesian Network (BN) based technique for prioritization, where test cases are clustered using method level coverage matrix [12]. Inter cluster test cases are prioritized based on their fault detection probability by BN approach. Source code change information, and class level coverage matrix are fed as input of BN model to get failure probability as output. The result shows that the improved BN scheme is more effective than normal BN model for test case prioritization. However, failure history which is effective to detect fault in regression testing [5], has not been considered for test case prioritization in the proposed strategy. Furthermore, clustering based on similar code coverage has similar fault detection capability, which may detect similar faults by multiple test cases.
Arafeen et al. introduced prioritization approach using requirement similarity clustering to investigate regression testing efficiency [8]. Distinct terms from software requirements are identified to generate term-document matrix, which lead to k-means cluster. Clusters of test cases have been formed using requirements-test case mapping traceability matrix. Inter cluster test cases has been prioritized based the source code coverage information. Execution sequence of clusters is ordered using code modification information and client’s requirement priority. Results denoted that the applied strategy which incorporates requirement information to prioritization improves the effectiveness of prioritization process. However, previous version test case failure history has not been considered for prioritization, which may affect the effectiveness of proposed technique.
Saeed et al. presented test case prioritization technique named as RDCC, which collaborates different software artifacts such as requirements, design diagrams and source code [9]. Their scheme overcomes the limitation of traditional single SDLC phase consideration in software testing. In RDCC approach, requirements connectivity, design inter-dependency and code metrics are collected, and multiplied by their weight for measuring final priority of test case. An academic case study has been used as the experimental analysis and results figure out that use of collaborative information in test case prioritization was significant. However, significant direction was undeclared for assigning weight to SDLC phases, and the result would be more effective by incorporating historical failure data.
Yiting et al. proposed a prioritization approach on the basis of fault severity to overcome random selection problem when multiple test cases have same coverage rate [14]. In this approach, test cases are selected based on the measurement of fault severity of each test case. The detected fault history of selected test cases has been recorded to update the test case priority for next execution. Considering consistent coverage rate, experimental result shows that the proposed technique improves the efficiency of regression testing. However, the fault severity has been assigned based on assumption rather than analysis of faults failed in previous testing execution, which may lead a biased prioritization. Consideration of consistent code coverage may have negative impact on their proposed approach.
Dusica et al. proposed a multi-perspective test case prioritization framework in time-constrained environments for faster fault detection [15]. This scheme considers test execution time, inter dependence functionality, failure impact and frequency factors for selecting the multi-perspective values. When time is limited for test suite execution, this technique selects test cases which are cost effective to execute. This approach prioritizes test cases to detect fault early and maximizes test cases having maximum inter dependence functional coverage, failure impact and frequency. Even though, this strategy used multiple factors for prioritizing test cases, dissimilar based test suite selection has not been considered to detect different types of fault at early execution.
Tanzeem et al. implemented a similarity based prioritization approach using historical failure data to rank new test cases matching with the failed test cases of previous execution [5]. Sequence of method call by previously failed and new test cases are generated to measure distance value from each other, which are used to form similarity matrix in descending order. The new test cases ranked higher whose distance value is less in the matrix. The experimental result shows that this similarity based approach is more effective in test case prioritization compared to other traditional strategies.
Regression test case selection approach has been evaluated in order to investigate the effect of time and resource constraint in testing process by [11]. In this strategy, based on historical data an empirical study has been conducted to prioritize test case in a time limit environment. The cost-benefit analysis of this strategy has been conducted under different software evaluation models to provide directions for further research on this field. The experimentation shows that regression testing for constrained environment has to be conducted differently from non-constraint environment and historical data has significant impact on regression testing. However, dissimilar test cases based on historical data is not considered for prioritization in order to detect various types of fault at the early of testing execution.
The analysis of existing approaches shows different prioritization strategies have been implemented for regression testing such as code coverage, requirement clustering, historical data analysis etc. Very few researchers incorporate the historical data and similarity clusters, where similar test cases are pointing the uniform faults together, which are imperfect in varieties of fault detection. However, no direction has been found yet to detect dissimilar faults using historical data analysis, which may increase fault detection rate in regression testing.
3 Proposed Methodology
Based on historical data, dissimilar based clustering framework is proposed to implement test case prioritization with intent to cover different region of code to detect variance faults at early. In this technique functions between two subsequent test suites version have been listed based on the function call similarity among them. Figure 1 presents the activity flow of proposed prioritization framework. A dependency matrix or graph has been generated based on the similar function of all test cases version. Test cases are clustered considering their function call similarities which are denoted by several circle in Fig. 1. Inter cluster test cases are ordered using the previous version fault detection matrix and degree of connectivity. Finally, the top test cases are picked from every cluster to form a dissimilar test suite, is iterated until all the test cases are picked. This order is the desired prioritization sequence of this proposed approach. The whole proposed method can be divided into five distinct steps which are described below.

Activity flow of dissimilar test case prioritization
Step 1: Generating Test Cases Dependency Graph
In this approach one old version and one new version of test suite are taken as input to generate similar functions list. Similarity between old version functions with new version is measured, based on the number of function called. Total number of called function by old and new version program function is calculated to generate similarity score [16]. An example of function called by old and new test cases is given below.

In the above example, function testCaseOld() called m1(), m2(), m3(), and m4(), where function testCaseNew() of new Test Case called m2(), m4(), and m5(). Even though, the name of old and new test cases is not same. However, m2() and m4() are called by both functions. In this example, similarity score is 2, which is calculated by the number of same called functions. Execution function call graph G (V, E) has been generated, where test cases are the vertex (V), and the similarity scores are the edges (E) between two vertices. Degree of connection for each test case is computed on the basis of dependency graph. The square root ceiling value of total test cases is used to find the number of clusters.
Step 2: Forming Similar Test Case Clusters
In this step, the distance among cluster headers and test cases degree of connections calculated from dependency graph. The measuring score is used to assign test cases to the cluster with whose distance is less. The test cases those are not connected with any cluster header (whose similarity score is zero) have been assigned in a cluster named as an orphan cluster.
To assign the members of orphan cluster, first degree of connection of each member inside orphan cluster is measured. This is then compared with each cluster header value and their member’s value. If any comparison value found closest to any cluster header, the member is assigned to that cluster. The remaining test cases whose connectivity degree with cluster header or members is zero are assigned to a cluster named as isolated cluster. Also test case pairs those are connected only with each other are assigned to isolated cluster.
Step 3: Prioritizing Inter Cluster Test Cases
In this step, total number of faults detected by similar test cases in previous execution and degree of connection is calculated in order to assign priority. Test cases failed in previous execution are listed in descending order based on the number of faults detected. Degree of connection is considered to assign priority for test cases those are shared same number of fault detection score. The remaining test cases those have only connection degree will be prioritized in a descending ordering based on their degree of connectivity. Total number of faults detected by similar test cases and degree of connection is measured for each clusters test cases. After then, clusters are prioritized based on their previously calculated total score.
Step 4: Dissimilar Test Suite Formation
Top test cases from each cluster have been picked one by one to form dissimilar test suites. This dissimilar test case cluster process is continued until all the test case is picked.
Step 5: Prioritizing and Executing Test Cases
The internal prioritization of dissimilar test suite has been given based on total number of faults detected by similar test cases in previous execution and degree of connectivity of each test case.
4 Result Analysis and Discussion
The implementation of proposed dissimilarity based prioritization approach with their comparative prominent test case prioritization is presented in this section. The result analysis with experimental setup and dataset are also described here.
Dataset
Two versions of three different projects named as JodaTime, Closure, and Chart from well reputed Defects4j datasets are used for experimental analysis in this paper [13]. Defects4j dataset contains 20,109 tests and 357 bugs in each individual projects. Each version of project contains buggy and fixed code segments with corresponding test cases. All the test cases are written in Junit test method. Projects which are used as dataset for this paper experimentation from Defects4j are shown in below Table 1.
Environment Setup
The research work evaluation has been performed on a single personal computer having 2.5 GHz core i5 CPU and 4 GB memory running the Ubuntu 14.04 LTS version operating system. To run Defects4j java 1.7, perl 5.0.10, git 2.10.1, and SVN 1.9.5 have been installed. LAMPP server has been installed in order to execute php scripts, which are used to generate dissimilar test suites.
Measurement Metric
In test case prioritization technique, standard measurement metric named as APFD (Average Percentage of Faults Detection) is used to calculate the average fault detection percentage for the test suite [17]. The limit of APFD result is 0 to 100, where higher number indicates faster fault detection rate. Let a test suite T containing n test cases; F denotes a set having m faults which is revealed by test suite T. TFi is the position number of earliest test case of test suite T which detects fault i. The APFD is calculated using the following Eq. (1).
Experimental Prioritization Method
Four different test case prioritization schemes are experimented to validate the result of proposed technique on same Defects4j datasets, which are explained below.
-
1.
Untreated Test Case Prioritization (UTP)
In UTP method, executions of test cases are performed on the basis of normal test case ordering without any prioritization. APFD of UTP method was measured by considering normal ordering of whole test suite and the position of test case that detect the faults at first.
-
2.
Random Test Case Prioritization (RTP)
In RTP method, APFD is measured using random test case ordering of a test suite. In this approach random execution sequence of test case is generated twenty (20) times, and APFD is calculated based on the average of all execution.
-
3.
Similar Test Case Prioritization (STP)
In STP, test cases are clustered on the basis of similar function call. Internal ordering of a single test cluster is calculated based on the faults detection of previous version. The connection degrees of test cases are considered for internal test case ordering, when fault detection is absent.
-
4.
Dissimilar Test Case Prioritization (DTP)
In DTP method, test cases are prioritized as dissimilar test suite, which is formed by picking up the top test case of each ordered test similarity cluster. Internal ordering of each test case within a dissimilar test suite is calculated based on their connection degree, and total number of faults they detected.
Results Analysis
The comparative results of proposed Dissimilar Test case Prioritization (DTP) with three prominent prioritization methods named as UTP, RTP and STP are listed below.
-
i.
UTP vs DTP:
In the experiment, for every project of two versions, DTP performs better than UTP which is shown in the above Table 2. For example in Chart v3 dataset DTP APFD values for different input size are 79%, 79%, 79%, 96% &100% where UTP APFD values are 0%, 0%, 29.16%, 83%, 100% respectively. The various APFD results for UTP and DTP are averaged and figured out at Fig. 2(a) and (d) subsequently. According to Fig. 2(a) and (d) the area under the curve represents the APFD, and it shows that our DTP method APFD 88.54%, which is higher than UTP APFD 40.77%.
Table 2. APFD based on various percentage of test execution Fig. 2. 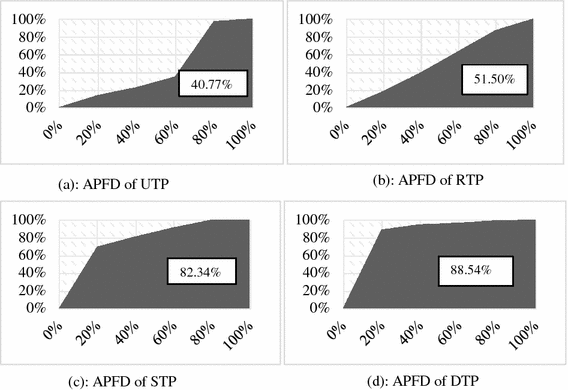
Average APFD of various prioritization schemes
-
ii.
RTP vs DTP:
According to the Table 2 RTP APFD is lower than proposed method DTP. In the experimental analysis for dataset Jodatime v3 the DTP APFD values for different input sizes are 80%, 90%, 100%, 100% and 100% which are always higher than RTP APFD values 17%, 45.60%, 63%, 91% and 100% respectively. The various APFD results for RTP and DTP are averaged and figured out at Fig. 2(b) and (d) correspondingly. According to Fig. 2(b) and (d) the area under the curve represents the APFD, and it shows that our DTP method APFD is 88.54%, which is higher than RTP APFD 51.50%.
-
iii.
STP vs DTP:
In this paper the proposed method DTP detects faults earlier than STP in 66.67% cases which is measure according to the APFD metric. According to the Table 2 for dataset Jodatime v3, the calculative APFD for proposed DTP method for various input size are 80%, 90%, 100%, 100%, 100% where STP APFD is 72%, 88%, 92%, 100% and 100% respectively. The various APFD results for STP and DTP are averaged and figured out at Fig. 2(c) and (d) respectively. According to Fig. 2(c) and (d) the area under the curve represents the APFD, and it shows that our DTP method APFD is 88.54%, which is higher than STP APFD 82.34%.

5 Result Discussion
Table 3 and Fig. 3 show the experimental results of three Dataset JodaTime, Closure and Chart. Table 3 shows that the performance ranking of four different test case prioritization technique is UTP < RTP < STP < DTP in terms of APFD metric calculation. According to Table 3, UTP and RTP test case prioritization techniques APFD value is always lower than our proposed DTP technique where 66.67% cases DTP has higher APFD value than STP. The box-plot of Fig. 3 represents the average APFD value of each test case prioritization method of three projects where DTP has higher value 88.54% compare to UTP, RTP and STP 40.77%, 51.50%, 82.34% value respectively. That means the dissimilar test suite selection can reduce the test execution time and maximize the fault detection rate.

Box plot of several test case prioritization techniques
6 Conclusion
This paper presents a dissimilarity based test case prioritization based on historical failure data analysis. This method considers both old and new version of test cases for prioritization. It calculates the similarity between two test cases and generates several clusters based on those similarity values. Inter cluster test cases ordered using the failure information form old version of test cases. Finally, test cases selected from every distinct cluster create the new dissimilar test suite. This technique has been experimented on Defects4j dataset, and it performs better than untreated, random ad similarity based approaches in terms of early fault detection. Incorporating time constraints or requirement prioritization would be the future direction of this research.
References
Rothermel, G., Untch, R.H., Chu, C., Harrold, M.J.: Prioritizing test cases for regression testing. IEEE Trans. Softw. Eng. 27(10), 929–948 (2001)
Nguyen, C.D., Marchetto, A., Tonella, P.: Test case prioritization for audit testing of evolving web services using information retrieval techniques. In: 2011 IEEE International Conference on Web Services (ICWS). IEEE (2011)
Catal, C.: The ten best practices for test case prioritization. In: Skersys, T., Butleris, R., Butkiene, R. (eds.) ICIST 2012. CCIS, vol. 319, pp. 452–459. Springer, Heidelberg (2012). doi:10.1007/978-3-642-33308-8_37
Rothermel, G., Untch, R.H., Chu, C., Harrold, M.J.: Test case prioritization: an empirical study. In: Proceedings of IEEE International Conference on Software Maintenance (ICSM 1999), 30 Aug – 3 Sept 1999 (1999)
Noor, T.B., Hemmati, H.: Test Case analytics: mining test case traces to improve risk-driven testing. In: SWAN 2015, Montréal, Canada, IEEE (2015)
Konsaard, P., Ramingwong L.: Total coverage based regression test case prioritization using genetic algorithm, IEEE (2015)
Mirarab, S., Tahvildari, L.: A prioritization approach for software test cases based on Bayesian networks. In: Dwyer, M.B., Lopes, A. (eds.) FASE 2007. LNCS, vol. 4422, pp. 276–290. Springer, Heidelberg (2007). doi:10.1007/978-3-540-71289-3_22
Arafeen, M.J., Do, H.: Test case prioritization using requirements-based clustering, In: 2013 IEEE Sixth International Conference (2013)
Siddik, M.S., Sakib, K.: RDCC: an effective test case prioritization framework using software requirements, design and source code collaboration. In: 17th International Conference on Computer and Information Technology (ICCIT), pp. 75–80. IEEE, (2014)
Wang, X., Zeng, H.: History-based dynamic test case prioritization for requirement properties in regression testing. In: IEEE/ACM International Workshop on Continuous Software Evolution and Delivery (CSED), pp. 41–47, 14 May 2016. IEEE (2016)
Kim, J.-M., Porter, A.: A history-based test prioritization technique for regression testing in resource constrained environments. In: International Conference of Software Engineering, ICSE (2002)
Zhao, X., Wang, Z., Fan, X., Wang, Z.: A clustering – Bayesian network based approach for test case prioritization, In: 2015 IEEE 39th Annual International Computers, Software and Applications Conference (2015)
Just, R., Jalali, D., Ernst, M.D.: Defects4J: a database of existing faults to enable controlled testing studies for Java programs. In: Proceedings of the 2014 International Symposium on Software Testing and Analysis. ACM, (2014)
Wang Y., Zhao X., Ding X.: An effective test case prioritization method based on fault severity. In: IEEE (2015)
Marijan, D.: Multi-perspective regression test prioritization for time-constrained environments, In: IEEE International Conference on Software Quality, Reliability and Security (2015)
Siddik, S., Gias, A.U., Khaled, S.M.: Optimizing software design migration from structured programming to object oriented paradigm. In: 16th International Conference on Computer and Information Technology (ICCIT), pp. 1–6. IEEE (2013)
Gao, D., Guo, X., Zhao, L.: Test case prioritization for regression testing based on ant colony optimization. In: 2015 6th IEEE International Conference on Software Engineering and Service Science (ICSESS). IEEE (2015)
Author information
Authors and Affiliations
Corresponding author
Editor information
Editors and Affiliations
Rights and permissions
Copyright information
© 2017 Springer Nature Singapore Pte Ltd.
About this paper
Cite this paper
Abu Hasan, M., Abdur Rahman, M., Saeed Siddik, M. (2017). Test Case Prioritization Based on Dissimilarity Clustering Using Historical Data Analysis. In: Kaushik, S., Gupta, D., Kharb, L., Chahal, D. (eds) Information, Communication and Computing Technology. ICICCT 2017. Communications in Computer and Information Science, vol 750. Springer, Singapore. https://doi.org/10.1007/978-981-10-6544-6_25
Download citation
DOI: https://doi.org/10.1007/978-981-10-6544-6_25
Published:
Publisher Name: Springer, Singapore
Print ISBN: 978-981-10-6543-9
Online ISBN: 978-981-10-6544-6
eBook Packages: Computer ScienceComputer Science (R0)