
Abstract
The majority of coral reefs are found in tropical environments between 25°N and 25°S, where typical seawater temperatures and salinities are between 18°C and 31°C and 34–37 ppt, (Kleypas et al. 1999; Veron 1986). The marine environment of the southeastern Arabian Gulf is singularly harsh; the coral communities in this high-latitude region (i.e. between 24°09′N and 25°40′N) are exposed to natural conditions that exceed threshold limits of corals elsewhere in the world, with temperature ranges between 14°C and 36°C (Kinzie III 1973; Shinn 1976) and salinities above 40 ppt. Less than one-third of the scleractinian species that are found in the neighboring Gulf of Oman have adapted to survive in the Arabian Gulf (e.g. Acropora spp., Porites spp., faviids and siderastreids) (Riegl 1999; Coles 2003; Rezai et al. 2004; Claereboudt 2006). Other benthic taxa that are common in the Gulf of Oman but are absent from the Arabian Gulf include the coral genera Montipora, Pocillopora, and Goniopora spp., fungiids, oculinids, alcyonaceans, and massive sponges. The adaptations of some taxa to extremes of temperature and salinity and the exclusion of other taxa are of interest to scientists studying the impacts of global climate change on coral reefs and other marine organisms.
Access provided by Autonomous University of Puebla. Download chapter PDF
Keywords
These keywords were added by machine and not by the authors. This process is experimental and the keywords may be updated as the learning algorithm improves.
4.1 Introduction
The majority of coral reefs are found in tropical environments between 25°N and 25°S, where typical seawater temperatures and salinities are between 18°C and 31°C and 34–37 ppt, (Kleypas et al. 1999; Veron 1986). The marine environment of the southeastern Arabian Gulf is singularly harsh; the coral communities in this high-latitude region (i.e. between 24°09′N and 25°40′N) are exposed to natural conditions that exceed threshold limits of corals elsewhere in the world, with temperature ranges between 14°C and 36°C (Kinzie III 1973; Shinn 1976) and salinities above 40 ppt. Less than one-third of the scleractinian species that are found in the neighboring Gulf of Oman have adapted to survive in the Arabian Gulf (e.g. Acropora spp., Porites spp., faviids and siderastreids) (Riegl 1999; Coles 2003; Rezai et al. 2004; Claereboudt 2006). Other benthic taxa that are common in the Gulf of Oman but are absent from the Arabian Gulf include the coral genera Montipora, Pocillopora, and Goniopora spp., fungiids, oculinids, alcyonaceans, and massive sponges. The adaptations of some taxa to extremes of temperature and salinity and the exclusion of other taxa are of interest to scientists studying the impacts of global climate change on coral reefs and other marine organisms.
The southeastern Arabian Gulf encompasses the coastal and offshore environments of the United Arab Emirates (UAE) and eastern Qatar (Fig. 4.1). The shallow-water coral communities are situated on discontinuous patches along the Qatari and Emirati coasts, near offshore islands and atop limestone domes. Assessments of the coral communities and their respective marine environments were conducted between 2005 and 2009 at multiple sites within Study Area “A”, located offshore Qatar and Abu Dhabi (Fig. 4.1, Table 4.1a). These assessments have provided data that describe (i) the typical environmental regimes to which the corals are exposed and (ii) the structure of the recovering coral communities a decade after the mass mortality associated with the 1996 elevated temperature anomaly (Riegl 2002, 2003; Sheppard and Loughland 2002). Similar assessments were conducted in the adjacent northwestern Gulf of Oman within Study Area “B” (Fig. 4.1, Table 4.1b) where the same coral species as those in the Arabian Gulf, along with 60–70 additional species, are found.

Map of monitoring station locations. (left) Map of Arabian Gulf and surrounding region, study areas are outlined; (center) Study area “A” locations in the southeastern Arabian Gulf; (right) Study area “B” locations in the northwestern Gulf of Oman. Circles indicate monitoring station locations. Triangles indicate sites with temperature recorders only
4.2 Environmental Setting
4.2.1 Temperatures
Temperature extremes have been recorded at various locations around the Arabian Gulf (Table 4.2), but little information is available regarding the “normal” conditions to which coral communities are exposed. As part of the assessments described herein, temperature recorders were deployed within Study Areas “A” and “B” approximately 0.5 m above the benthos. Daily mean temperature profiles for ten sites in the southeastern Arabian Gulf and two sites in the northwestern Gulf of Oman are shown in Figs. 4.2, 4.3, and 4.4. The data for the individual sites were combined to provide regional temperature profiles for the southeastern Arabian Gulf and the northwestern Gulf of Oman (Figs. 4.5 and 4.6). Spring cooling rates, autumn warming rates, maximum summer temperatures and minimum winter temperatures are listed in Table 4.3. Results indicated the following with respect to normal temperatures at sites in Study Area “A”:
-
Minimum daily means varied between the individual sites during the winter season (December 21–March 20), ranging from 16.5°C to 19.5°C (Figs. 4.2 and 4.3). The minimum daily mean for the southeastern Arabian Gulf region was 16.5°C, although this was not reached every year (Figs. 4.5 and 4.6). These data suggests that the southeastern Arabian Gulf gets colder in the winter than does the central Gulf for which Sheppard et al. (2010) presented HadSST1 data indicating a lower temperature limit of 20°C.
-
Daily mean temperatures for the southeastern Arabian Gulf region during the winter season were typically within the range of 18.5–21.0°C (Table 4.3).
-
The minimum hourly temperature recorded during this study was 14.9°C at Al Hiel in February 2008 (Table 4.3).
-
The mean warming rates during the spring (March 21–June 20) were typically 0.09–0.13°C per day. The warming rates were nearly uniform across the individual sites in a given year. (Table 4.3)
-
Temperature data collected near Yasat Island indicated that a thermocline formed during Spring 2008 as shallow waters warmed faster than deeper waters (Fig. 4.7). The lower water layer was 1–4°C colder than the upper water layer. Mixing of the thermally stratified layers was evident by rapid temperature declines in the upper layer during the late spring/early summer, after which the thermocline was no longer present. Similar rapid reductions in temperature occurred at the other sites during the same timeframe (June–July 2008) and during the other years (Fig. 4.2), indicating that the mixing of warmer surface waters with cooler deeper water is an annual and regional phenomenon.
-
Maximum daily means varied between the individual sites during the summer season (June 21–September 20), ranging from 34.0°C to 35.5°C (Figs. 4.2 and 4.3). The maximum daily mean for the southeastern Arabian Gulf region was 35°C, although this was not reached every year (Figs. 4.5 and 4.6). These data suggests that the southeastern Arabian Gulf gets hotter than does the central Gulf which Sheppard et al. (2010) presented HadSST1 data indicating an upper temperature limit of 33°C.
-
Daily mean temperatures for the southeastern Arabian Gulf region during the summer season were typically 33.4–33.9°C (Table 4.3).
-
The maximum hourly temperature recorded during this study was 37.2°C at Al Hiel in August 2007 (Table 4.3).
-
The mean cooling rates during the winter (December 21–March 20) were typically 0.10–0.15°C per day (Table 4.3). The cooling rates were nearly uniform (i) among the individual sites within a given season (Table 4.3) and (ii) throughout the water column (Fig. 4.7).
-
The annual temperature ranges at the individual sites and for the southeastern Arabian Gulf region were 15–19°C and 18.5°C, respectively (Figs. 4.2 and 4.3). These ranges are wider than the 13°C range recorded in the Central Gulf (Sheppard et al. 2010).
-
Daily temperature ranges of less than 1°C were recorded at the coastal Abu Dhabi sites (i.e. Dhabiya, Saadiyat, Ras Ghanada), one of the Abu Dhabi offshore islands (Yasat) and the Qatari offshore island (Shra’aw). The other Abu Dhabi offshore islands (Makaseb, Delma, Bu Tinah, Al Hiel) experienced daily temperature ranges between 1.0°C and 2.5°C. (Fig. 4.4)
Table 4.2 Temperature extremes recorded from Arabian Gulf coral communities Fig. 4.2 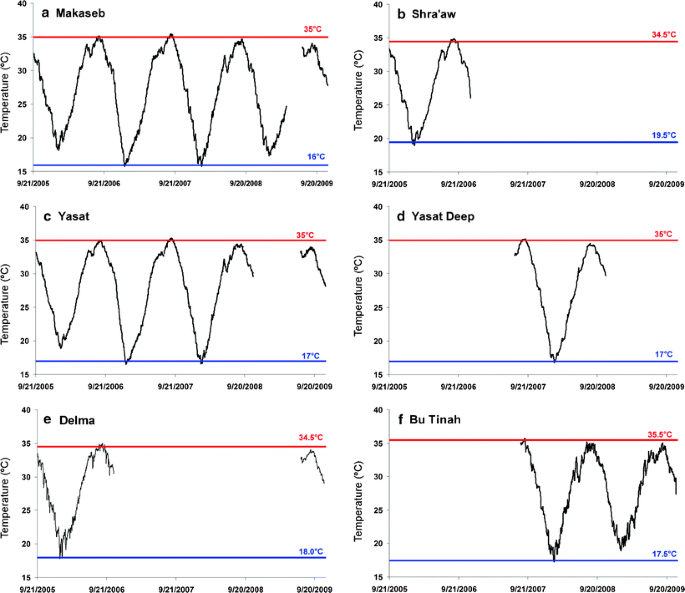

(a–f) Daily mean temperature profiles (2005–2009) – sequential. Daily mean temperatures based on hourly records between 00:00 and 23:59 each calendar day. Upper horizontal lines indicate the normal summer (June 21–September 20) maximum temperatures. Lower lines indicate the normal winter (December 21–March 20) minimum temperatures. Temperature loggers were deployed at Abu Dhabi offshore islands (a, c, e, f); at a Qatar offshore island (b); and at a buoy marking the Yasat marine protected area boundary in Abu Dhabi waters (d) Fig. 4.2 (continued) (g–l) Daily mean temperature profiles (2005–2009) – sequential. Daily mean temperatures based on hourly records between 00:00 and 23:59 each calendar day. Upper horizontal lines indicate the normal summer (June 21–September 20) maximum temperatures. Lower lines indicate the normal winter (December 21–March 20) minimum temperatures. Temperature loggers were deployed at an Abu Dhabi offshore island (g); along Abu Dhabi coasts (h–j); and along Fujairah coasts (k, l)
Fig. 4.3 

(a–f) Daily mean temperature profiles (2005–2009) – overlapping. Daily mean temperatures based on hourly records between 00:00 and 23:59 each calendar day. Upper horizontal lines indicate the normal summer (June 21–September 20) maximum temperatures. Lower lines indicate the normal winter (December 21–March 20) minimum temperatures. Temperature loggers were deployed at Abu Dhabi offshore islands (a, c, e, f); at a Qatar offshore island (b); and at a buoy marking the Yasat marine protected area boundary in Abu Dhabi waters (d) Fig. 4.3 (continued) (g–l) Daily mean temperature profiles (2005–2009) – overlapping. Daily mean temperatures based on hourly records between 00:00 and 23:59 each calendar day. Upper horizontal lines indicate the normal summer (June 21–September 20) maximum temperatures. Lower lines indicate the normal winter (December 21–March 20) minimum temperatures. Temperature loggers were deployed at an Abu Dhabi offshore island (g); along Abu Dhabi coasts (h–j); and along Fujairah coasts (k, l)
Fig. 4.4 

(a–f) Mean daily temperature ranges by season (2005–2009). Temperature range is the difference between the maximum and minimum hourly records between 00:00 and 23:59 for each calendar day. Seasons are defined as spring (March 21–June 20); summer (June 21–September 20); autumn (September 21–December 20); and winter (December 21–March 20). Temperature loggers were deployed at Abu Dhabi offshore islands (a, c, e, f); at a Qatar offshore island (b); and at a buoy marking the Yasat marine protected area boundary in Abu Dhabi waters (d) Fig. 4.4 (continued) (g–l) Mean daily temperature ranges by season (2005–2009). Temperature range is the difference between the maximum and minimum hourly records between 00:00 and 23:59 for each calendar day. Seasons are defined as spring (March 21–June 20); summer (June 21–September 20); autumn (September 21–December 20); and winter (December 21–March 20). Temperature loggers were deployed at an Abu Dhabi offshore island (g); along Abu Dhabi coasts (h–j); and along Fujairah coasts (k, l)
Fig. 4.5 
Regional daily mean temperature profiles (2005–2009) – sequential. Daily mean temperatures based on hourly records between 00:00 and 23:59 each calendar day, averaged across all sites (Arabian Gulf = 10 sites; Gulf of Oman = 2 sites). Upper horizontal lines indicate the normal summer (June 21–September 20) maximum temperatures. Lower lines indicate the normal winter (December 21–March 20) minimum temperatures
Fig. 4.6 
Regional daily mean temperature profiles (2005–2009) – overlapping. Daily mean temperatures based on hourly records between 00:00 and 23:59 each calendar day, averaged across all sites (Arabian Gulf = 10 sites; Gulf of Oman = 2 sites). Upper horizontal lines indicate the normal summer (June 21–September 20) maximum temperatures. Lower lines indicate the normal winter (December 21–March 20) minimum temperatures
Table 4.3 Spring warming rates, autumn cooling rates, maximum summer temperatures and minimum winter temperatures (2005–2006) Fig. 4.7 
Shallow and deep temperature profiles – Yasat (2007–2008). Thick line represents temperatures at the reef (3.0–4.7 m depth). Thin line represents temperatures in deep water (31 m)


The coral communities in the southeastern Arabian Gulf did not experience mass mortalities during exposure to the lower and upper temperature limits described above, indicating acclimatization to these conditions. Small-scale bleaching and disease were observed on individual corals during the summer months (Fig. 4.8) but subsequent visits in late autumn, when water temperatures had cooled, indicated that (i) bleached corals had returned to normal coloration without mortality and (ii) disease resulted in mortality of affected polyps while the remainder of the colonies survived.

Examples of individual diseased and bleached corals. (a–c) Yellow band disease in Saadiyat, July 2007; (d) bleaching at Abu Dhabi breakwater, July 2007
The Gulf of Oman has a different temperature regime compared to the Arabian Gulf (Figs. 4.2, 4.3, 4.4, 4.5, and 4.6, Table 4.3). The temperature extremes are milder in the Gulf of Oman, where daily mean temperatures range between 22°C and 32°C throughout the year. However, the coral communities in the Gulf of Oman may be exposed to extreme daily temperature oscillations, especially during the summer when temperatures can fluctuate up to 9°C within a single day due to the rise and fall of a strong thermocline that forms between the heated surface and cool upwelling waters (Rezai et al. 2004). The data collected between 2007 and 2008 indicated that “normal” mean daily temperature ranges in the Gulf of Oman were less than 3°C, with a maximum daily range of 7.1°C recorded. The coral communities did not experience mass mortalities during exposure to these daily temperature fluctuations, indicating acclimation to these conditions.
4.2.2 Sea Urchins
Algal turfs can limit the free space that is available for coral settlement and can increase mortality of recruits by overgrowth, shading, and abrasion (Sammarco 1980, 1982). Sea urchin grazing of algal turf has been positively correlated to coral recruitment and survival (Birrell et al. 2005; Carpenter and Edmunds 2006). Sea urchin densities (Diadema and Echinometra spp.) were determined as part of the site assessments described herein (Figs. 4.9 and 4.10). Sea urchin densities were typically less than 7 urchins per m2 in both the southeastern Arabian Gulf and in the northwestern Gulf of Oman. The exception to this was at Al Hiel, where densities up to 12 urchins per m2 were measured. Al Hiel has a noticeably higher macroalgae cover than the other sites, which can support its slightly larger population of sea urchins.

Sea urchin densities (2006–2009). Sea urchins densities include Diadema and Echinometra spp. (site codes in Table 4.1)

Sea urchins around Yasat Island
4.2.3 Topographical Complexity
Rugosity is a measure of topographical complexity, defined as the ratio of the reef surface contour distance to linear distance (Fig. 4.11) (e.g. a completely flat substrate would have a rugosity of 1.0). Changes in rugosity may be used to quantify reef growth or decline (e.g. increases in rugosity may be the result of coral colony growth; decreases in rugosity may be the result of bioerosion). Rugosities in Study Area “A” ranged between 1.2 and 1.8 (Fig. 4.12).

Rugosity: ratio between contour distance and linear distance

Rugosities of coral communities in the southeastern Arabian Gulf (site codes in Table 4.1)
4.3 Coral Community Structure
Elevated sea surface temperature anomalies impacted the southeastern Arabian Gulf region in 1996, 1998 and 2002; during which temperatures were 2–4°C above the typical summer maximum (Sheppard and Loughland 2002; Riegl 2003). The 1996 event caused widespread coral bleaching and mortality, with a subsequent reduction of 98.7% of framework-building Acropora corals in some areas (Riegl 2002). The 1998 and 2002 anomalies had only minor effects on the remaining coral communities, possibly because the surviving colonies were not susceptible to the elevated temperatures (Riegl 2002). The coral communities in Study Area “A” (Fig. 4.1) were monitored between 2006 and 2009 (i.e. 10–13 years after the mass coral mortality event and 3–7 years after the most recent elevated temperature anomaly). Similar assessments were conducted in the adjacent northwestern Gulf of Oman within Study Area “B” (Fig. 4.1), which did not experience the elevated temperature anomalies or the associated coral mortality.
4.3.1 Taxa Inventories
Nine genera of coral were observed during taxa inventories within the southeastern Arabian Gulf (Table 4.4) between 2006 and 2009. Taxa were inventoried by genus to allow rapid and repeatable identification, regardless of the taxonomic knowledge of those executing the monitoring program. Results indicated the following with respect to taxa inventories at sites in Study Area “A”:
-
Porites spp. were found at all sites. The most abundant species was P. harrisoni. Other species included P. nodifera, P. lutea and P. solida.
-
Two sites (Fasht Al-Ghabi and Hawksbill Reef) were comprised solely of Cyphastrea sp. and Porites spp. Other genera occurred, but were rare and outside the monitoring sites.
-
Favia, Favites and Platygyra spp. were common coral taxa found at all sites except at Halul East, Fasht Al-Ghabi and Hawksbill Reef.
-
Acropora spp. were found at both Qatar sites (Halul East and Halul South), around Delma Island and at the three Abu Dhabi coastal sites (Dhabiya, Saadiyat, and Ras Ganada) (Fig. 4.13). Acroporids were not observed in the vicinity of any of the other Abu Dhabi sites.
-
Three species of acroporids were observed; A. clathrata, A, downingi, and A. arabensis. Other subordinate Acropora species (e.g. A. tenuis, A. valida, A. pharaonis, A. florida) remain unobserved in the southeastern Arabian Gulf, including in waters offshore Dubai (Burt et al. 2008), suggesting local extirpation.
-
Other coral taxa that have been reported offshore Dubai after the elevated temperature anomalies (i.e. Acanthastraea, Psammacora, Psuedosiderastrea spp. (Burt et al. 2008)) were not observed at the Qatari or Abu Dhabi sites.
-
Other benthic taxa were found among the coral communities including crustose coralline algae, macroalgae, oysters and bryozoans (Fig. 4.14).

Examples of Acropora spp. in the southeastern Arabian Gulf (see also Chap. 11, for taxonomic information). (a–b) A. clathrata near Halul Island; (c, d, f) juvenile colonies at Ras Ghanada; (e) A. arabensis near Saadiyat

4.3.2 Live Coral Cover
Photo transects were taken at each site for subsequent image analysis. Coral Point Count (CPCe) (Kohler and Gill 2006) was used to trace the colony perimeters and calculate surface areas (Fig. 4.15). Average surface areas at the sites ranged from 62 to 500 cm2. The largest colonies are Porites spp., followed by Platygyra spp.

Average coral colony surface areas (site codes in Table 4.1)
The surface area data for all images within a given year were combined to provide percent live coral cover within the belt transects at each site (Fig. 4.16). Results indicated the following with respect to live coral cover at the sites in Study Area “A”:
-
The offshore island sites (Halul, Makaseb, Yasat, Delma, Bu Tinah, Al Hiel) (Fig. 4.17) were sparsely populated, with live coral cover ranging from 1.9% to 17.1%.
-
Fasht Al-Ghabi, the only site surveyed along the coast of Qatar, had a sparsely populated coral community (1.3% live cover) consisting of small Cyphastrea spp. on old dead coral that was partially covered by crustose coralline algae (Fig. 4.18).
-
The sites along the Abu Dhabi coast (Dhabiya, Saadiyat, Ras Ghanada) (Fig. 4.19b–d) were moderately populated, with live coral cover ranging from 27.5% to 46.5%. The sites most closely resembled the live cover at the northwestern Gulf of Oman sites (Fig. 4.16), which ranged from 23.0% to 44.9%.
-
Hawksbill Reef, the only site situated on a limestone dome, had a densely populated coral community (62.2% live coral cover) comprised solely of Porites harrisoni.

Percent live coral cover (2006–2009) (site codes in Table 4.1)

Landscape views of sparsely-populated “near-island” sites. (a) Halul South; (b) Makaseb; (c) Yasat; (d) Delma; (e) Bu Tinah North; (f) Al Hiel

Planar view of sparsely-populated coastal site (Fasht Al-Ghabi, Qatar)

Landscape views of densely- and moderately-populated sites. (a) Hawksbill Reef; (b) Dhabiya; (c) Saadiyat; (d) Ras Ghanada
The majority of the coral communities were comprised of several common families; poritids, faviids, acroporids, and siderastreids. Other families were either uncommon or unobserved at the sites. The composition of a particular family may be described as dominant (>50% of the coral cover), common (20–50%), uncommon (<20%) or unobserved. Results indicated the following with respect to the composition of live coral cover at the sites in Study Area “A”:
-
Poritids were dominant at all sites except around the Qatar sites. Poritids were common at Halul South, Halul East. Poritids comprised 100% of the coral cover at Hawksbill Reef.
-
Faviids were (i) dominant at Halul South and Fasht Al-Ghabi, (ii) common at Al Hiel and Ras Ghanada and (iii) uncommon or unobserved at the remaining locations.
-
Acroporids were present at six of the thirteen sites: they were (i) dominant at Halul East; (ii) common at Halul South; and uncommon at Delma, Dhabiya, Saadiyat and Ras Ghanada.
-
Siderastreids were uncommon at five sites (Halul East, Halul South, Al Hiel, Saadiyat and Ras Ghanada) and unobserved at the remaining locations.
-
Corals in the “Other families” category were uncommon at three sites (Dhabiya, Saadiyat and Ras Ghanada) and unobserved at the remaining locations. The “other” corals were all from the dendrophyllid family, specifically Turbinaria spp. No other coral families were observed.
4.3.3 Coral Density
Digital photos were taken along belt transects at each site for subsequent image analysis. The number of corals within the belt transects were combined provide coral density (i.e. the number of corals per m2) for each site (Fig. 4.20). Results indicated the following with respect to coral density at the sites in Study Area “A”:
-
The offshore island sites (Halul, Makaseb, Yasat, Delma, Bu Tinah, Al Hiel) (Fig. 4.17) were sparsely populated, with coral densities for these sites range from 1.2 to 8.0 corals per m2.
-
Fasht Al-Ghabi, the only site surveyed along the coast of Qatar, had a sparsely populated coral community with a coral density of 1.1 corals per m2.
-
Two of sites along the Abu Dhabi coast (Dhabiya, Saadiyat) and Hawksbill Reef were moderately populated, with coral densities ranging from 12.5 to 16.9 corals per m2.
-
Ras Ghanada, the third site located along the Abu Dhabi coast, was a densely populated coral community with a coral density >24 corals per m2.

Coral colony densities (2006–2009) (site codes in Table 4.1)
4.4 Conclusions
The information presented in this chapter described (i) the typical environmental setting to which the Arabian Gulf corals were exposed and (ii) the structure of the recovering coral communities a decade after the mass mortality associated with the 1996 elevated temperature anomaly. These descriptions, as summarized below, may serve as baselines for normal conditions within the southeastern Arabian Gulf and as benchmarks of extreme conditions to which certain coral species are capable of adapting.
-
The normal temperature range within the southeastern Arabian Gulf was 16.5°C–35.0°C. Temperature anomalies may, therefore, be defined as conditions that are 2–3°C below this minimum or above this maximum.
-
The spring warming and autumn cooling rates were uniform across the region, ranging between 0.09–0.13°C per day and 0.10–0.15°C per day, respectively. A 1–4°C thermocline formed in the spring and dissipated in early summer. Autumn and winter thermoclines have not been recorded.
-
The mean daily temperature range in the southeastern Arabian Gulf was <2.5°C. The same coral species found in the Arabian Gulf withstood normal daily temperature fluctuations up to 7.1°C, as measured in the adjacent Gulf of Oman.
-
Sea urchin densities were typically below 7 urchins per m2.
-
The coral communities exposed to the above conditions were dominated by Porites, followed by Favia/Favites and Platygyra spp. Each of the six other coral genera that were inventoried within the communities comprised <1% to the regional population.
-
Three species of acroporids were observed in the region following the 1996 mass mortality event; A. clathrata, A. downingi, and A. arabensis. The live coral cover for these species represented <1% of the coral cover in the southeastern Arabian Gulf, indicating that recovery to pre-event levels (>40%) had not occurred more than a decade later. The coral community structure has shifted from Acropora to Porites dominance. Other acroporid species that were recorded prior to 1996 were not observed and may now be regionally extinct.
-
Live coral cover and coral density varied among sites, with ranges of 1.9–62.2% and 1.1–36.5 colonies per m2, respectively. The locations near the Abu Dhabi coast and Hawksbill Reef (on top of a limestone dome) had higher live coral covers and densities than those locations near the Abu Dhabi and Qatar islands and the Qatar coast.
References
Birrell CL, McCook LJ, Willis BL (2005) Effects of algal turfs and sediment on coral settlement. Mar Pollut Bull 51:408–414
Burt J, Bartholomew A, Usseglio P (2008) Recovery of corals a decade after a bleaching event in Dubai, United Arab Emirates. Mar Biol 154:27–36
Carpenter RC, Edmunds PJ (2006) Local and regional scale recovery of Diadema promotes recruitment of scleractinian corals. Ecol Lett 9:271–280
Claereboudt MR (2006) Reef corals and coral reefs of the Gulf of Oman. The Historical Association of Oman, Sultanate of Oman
Coles SL (2003) Coral species diversity and environmental factors in the Arabian Gulf and the Gulf of Oman: a comparison to the Indo-Pacific region. Atoll Res Bull 507:497–508
Coles SL, Fadlallah YH (1991) Reef coral survival and mortality at low temperatures in the Arabian Gulf: new species-specific lower temperature limits. Coral Reefs 9:231–237
Downing N (1985) Coral reef communities in an extreme environment: the northwestern Arabian Gulf. In: Proceedings of the fifth international coral reef congress, Tahiti, pp 343–348
Kinsman DJJ (1964) Reef coral tolerance of high temperatures and salinities. Nature 202:1280–1282
Kinzie RA III (1973) The zonation of West Indian gorgonians. Bull Mar Sci 23:93–155
Kleypas JA, McManus JW, Menez LAB (1999) Environmental limits to coral reef development: where do we draw the line? Am Zool 39:146–159
Kohler KE, Gill SM (2006) Coral Point Count with Excel extensions (CPCe): a visual basic program for the determination of coral and substrate coverage using random point count methodology. Comput Geosci 32:1259–1269
Rezai H, Wilson SC, Claereboudt MR, Riegl B (2004) Coral reef status in the ROPME Sea area. In: Wilkinson, C.R. (Ed.), Status of Coral Reefs of the World. Australian Institute of Marine Science, Townsville, pp 155–170.
Riegl B (1999) Coral in a non-reef setting in the southern Arabian Gulf (Dubai, UAE): fauna and community structure in response to recurring mass mortality. Coral Reefs 18:63–73
Riegl B (2002) Effects of the 1996 and 1998 positive sea-surface temperature anomalies on corals, coral diseases and fish in the Arabian Gulf (Dubai, UAE). Mar Biol 140:29–40
Riegl B (2003) Climate change and coral reefs: different effects in two high-latitude areas (Arabian Gulf, South Africa). Coral Reefs 22:433–446
Sammarco PW (1980) Diadema and its relationship to coral spat mortality: grazing, competition, and biological disturbances. J Exp Mar Biol Ecol 45:245–272
Sammarco PW (1982) Echinoid grazing as a structuring force in coral communities: whole reef manipulations. J Exp Mar Biol Ecol 61:31–55
Sheppard CRC, Loughland R (2002) Coral mortality and recovery in response to increasing temperature in the southern Arabian Gulf. Aquat Ecosyst Health Manag 5:395–402
Sheppard CRC, Al-Husiani M et al (2010) The Gulf: a young sea in decline. Mar Pollut Bull 60:13–38
Shinn EA (1976) Coral reef recovery in Florida and the Persian Gulf. Environ Geol 1:241–254
Veron JEN (1986) Corals of Australia and the Indo-Pacific. University of Hawaii Press, Singapore
Acknowledgements
The authors thank the following for support related to the work presented herein: Dolphin Energy; Emirates Wildlife Society in association with the World Wide Fund for Nature (EWS-WWF); National Coral Reef Institute (NCRI), Florida, USA; Environmental Agency – Abu Dhabi (EAD); Supreme Council for the Environment and Natural Resources (SCENR), Qatar; Dibba Marine Centre of the Ministry of Environment and Water; Dibba-Fujairah Municipality; Fujairah Municipality, and Fujairah Marina Club. Integral team members during the field work associated with this project include Dr. Christophe Tourenq (EWS-WWF), Maral Shuriqi (Fujairah Municipality), Ebrahim Baqla (EAD) and Debra Rein. All reef images in this chapter are single frames taken from underwater videos shot by Dr. Greg Foster.
Author information
Authors and Affiliations
Corresponding author
Editor information
Editors and Affiliations
Rights and permissions
Copyright information
© 2012 Springer Science+Business Media B.V.
About this chapter
Cite this chapter
Foster, K., Foster, G., Al-Cibahy, A.S., Al-Harthi, S., Purkis, S.J., Riegl, B.M. (2012). Environmental Setting and Temporal Trends in Southeastern Gulf Coral Communities. In: Riegl, B., Purkis, S. (eds) Coral Reefs of the Gulf. Coral Reefs of the World, vol 3. Springer, Dordrecht. https://doi.org/10.1007/978-94-007-3008-3_4
Download citation
DOI: https://doi.org/10.1007/978-94-007-3008-3_4
Published:
Publisher Name: Springer, Dordrecht
Print ISBN: 978-94-007-3007-6
Online ISBN: 978-94-007-3008-3
eBook Packages: Earth and Environmental ScienceEarth and Environmental Science (R0)