
Abstract
Understanding people’s activities and travel behaviors has gained attention in service research field as well as in transportation research field. Recently, there are a lot of studies utilizing GPS (Global Positioning System) trajectory data to analyze travel behaviors after identifying each trip. Although transportation service level (e.g., travel time or waiting time) and our travel behaviors would change due to weather and seasonal factors, there is no research to evaluate an automated detection/identification model for GPS trajectory data. In this study, we compare a trip frequency (trip purpose of shopping and health, which are nonmandatory trips) and an accuracy of the detection/identification model by using long-term person trip survey data, which is conducted for each 4 months in summer and winter in Hakodate city, Japan. From the results, we confirm that a variation of car trip frequency is small and a tendency of mode change from bicycle in summer to walking in winter is strong due to snowy roadside condition. Moreover, random forest method as the detection/identification model has small effect to seasonal variations if multi-seasonal data is combined.
Access provided by CONRICYT-eBooks. Download conference paper PDF
Keywords
1 Introduction
Understanding people’s activities and travel behaviors is important not only in transportation planning but also in service planning. Person trip (PT or household travel) survey has been conducted as an official survey in Japan to observe traffic volume and analyze travel behaviors in urban area. However PT survey has several problems such as high survey cost and low frequency of update. Currently, traffic data getting from a traffic counter or a railway IC (integrated circuit) card are available more easily due to information-communication technology, and some studies tried to analyze such “big data.” Mobile technologies for activity-travel data collection is a remarkable example as an alternative or a complementary of conventional travel survey method, since it is easy to collect trajectories by using cell phone equipped with GPS (Global Positioning System) device [1, 2].
In order to analyze travel behaviors from the massive trajectory data, it is efficient to detect automatically a trip information (i.e., to judge staying or moving and to identify transportation mode by a machine learning method). For analyst, bigger sampled and continuous trajectory data is a desirable one. If data of travel behaviors can be collected for a long time (e.g., during multi-season), transportation service level (e.g., travel time) and our travel behaviors would change due to weather and seasonal factors. However, there is no study to evaluate the automated detection/identification model for GPS trajectory data.
This study aims to compare the trip frequency (trip purpose of shopping and health, which are nonmandatory trips) and the accuracy of the detection/identification model by using a long-term GPS trajectory data, which is conducted for each 4 months in summer and winter season in Hakodate city, Japan.
2 Smartphone-Based Travel Survey
2.1 Study Area
We conducted travel survey at Hakodate city, Hokkaido, Japan, shown in Fig. 1. Hakodate city is located in the southwestern part of Hokkaido and is a regional city with approximately 300,000 population. Although Hokkaido is famous as a heavy snowfall area, Hakodate city is a relatively little snowfall area, but it is not unusual to be less than below-zero 10°. Because snowfall is also observed constantly, a road-surface condition greatly changes, and it seems that individual travel behaviors are greatly influenced by seasonal factors.


Study area
Hakodate city has a bus location system which can record arrival and departure time. From this record we can calculate a delay time from 350 million data. Figure 2 shows calculated delay time depending on the weather. Horizontal axis represents which number bus stop they are from the first station and vertical axis represents delay time, and it becomes longer at further bus stops. The big difference is not shown in the delay time on sunny day and rainy day, but the delay time of snowy day becomes extremely longer. Change of service level due to weather also affects individual traffic behavior in Hakodate city.


Delay time of the bus every weather
2.2 Probe Person Travel Survey (PP Survey)
Road traffic conditions in Hakodate city greatly changed in winter season due to snowfall observed constantly every year. Therefore it is necessary to conduct a long-time travel survey for a comparison between the condition in summer and winter. The comparison makes it possible to analyze individual travel behaviors.
Nakashima et al. [3] conducted PP survey for each 4 months in summer (June–October, 2013) and winter (December, 2012–February, 2013) in Hakodate city. This survey collects data by having subjects carry a smartphone whose GPS device was put on for a long term. And smartphone application (android version) to reduce burden on subjects is developed.
2.3 Smartphone Application for PP Survey
The smartphone application that Nakashima et al. developed can get trip purpose, destination, transportation mode, and trajectory data by carrying and operating a smartphone. The outline is described as follows.
2.3.1 Input of a Plan
After having started the application, the subject inputs an activity plan. Specifically, the trip purpose, destination, and transportation mode are input. Table 1 shows selectable purpose, destination, and transportation mode by this application.
2.3.2 Deriving of GPS Trajectory Data
After inputting plans, the application starts to derive the positional information at about 30 s interval if user has tapped an observation start button. In addition, to protect the user’s privacy, a measurement of the positional information comes to be stopped by tapping the end button.
2.4 Implementation of the Survey
PP survey was carried out using the smartphone application described in Sect. 2.2. Nakashima et al. left the smartphone which installed application in two subjects, a man in his 60s and a woman in her 40s. Moreover, questionnaires that asked the gender, age, presence of a driver’s license, and so on were carried out at the time the survey started. Table 2 shows the questionnaire results.
3 Data Preparation
3.1 Making Training Data
The final purpose of this research is to generate a trip automatically by detecting, staying or moving, and identifying transportation mode by utilizing GPS trajectory data. Therefore it is necessary to make a training data input into models such as random forest model. The making procedures of training data are as follows:
-
1.
Plot a movement trace on Google Earth based on the coordinate derived from the PP survey (refer to Fig. 3).
Fig. 3 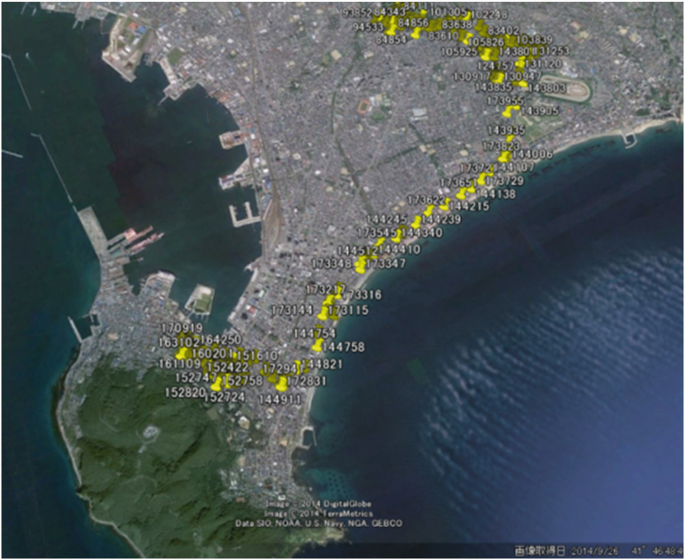
Visualization of trajectory data
-
2.
Delete the data of a period staying at home.
-
3.
If there are poor data (e.g., data with input omission and that a trace is not recorded normally), the day including the data is rejected.
-
4.
Detect the origin, destination, and route to the destination by following a trace by viewing.
-
5.
Identify a transportation mode based on input data of the subject, trace, and moving average speed.
-
6.
Identify a trip purpose based on the input data of the subject’s plan and the attribute of the destination.


We carried out a process of (1) to (6) on all the data for each 8 months in summer and winter and made the “ground truth” for training data. The number of sample data which could be used for a basic analysis and model analysis finally is 618 trips during 165 days for subject A and 470 trips during 118 days for subject B.
3.2 Destination Distribution
Figures 4, 5, 6, and 7 show all destinations that subjects visited during an investigation period and show the frequency of visits.


Subject A’s destinations and frequency in summer


Subject A’s destinations and frequency in winter


Subject B’s destinations and frequency in summer


Subject B’s destinations and frequency in winter
Subject A particularly often visits to offices and fitness club. There are several offices and visit frequency of each office differs greatly. Subject B often visits to an office and supermarkets. Contrary to subject A, subject B has extremely steady life cycle because subject B goes to the same office and seldom changes frequency of visit to the office and supermarkets between summer and winter.
4 Basic Analysis
A basic analysis was done by using all training data. Specifically, we divide it into every season and weather and evaluate what kind of impact those factors have on individual travel behaviors by adding up the data about trip purpose and mode.
4.1 Seasonal Impact Analysis
4.1.1 Subject A
Table 3 shows subject A’s count results of the number of the trips according to the trip purpose. The trip purposes of subject A can be classified in seven kinds of activity shown in Table 3 mainly (others are excluded). The average number of trips per day in summer is 3.87 and in winter is 3.59. It means that summer is higher in a going-out rate.
It is one of the characteristics that a lot of “exercise” activity is observed. Subject A goes to the fitness club regularly, and all the destinations of the trip of “exercise” were in the same fitness club. Generally, “exercise” activity at fitness club is one of the leisure activities; thus, such activity and physiological requisite activity (e.g., sleep, meal) or obligatory activity (e.g., labor, studies) are incompatible. It is interesting that such activity was accomplished at high frequency regardless of season. Moreover, the average number of the “commute” trips per day in winter became about a half of that in summer. On the other hand, the average number of the “shopping,” “meal,” and “recreation” trips per day in winter increased. It means that subject A changed behaviors depending on the season.
Transportation mode is also evaluated. Figure 8 shows a ratio of each transportation modes among all trips of subject A. It is remarkable that trips on foot that accounted for 54.1 % in winter decreased to 9.7 % in summer, and, on the contrary, the trips by bicycle which was 0 % in winter increase to 43.5 % in summer. It means that transportation mode is considerably influenced by the seasonal factors. In a heavy snowfall area like Hakodate city, those who move by bicycle in summer have no choice but to convert on foot in winter because there is snow in the edge of the road including sidewalk, and also road surface freezes up. In addition, subject A used a bus and a tram equally during the winter, but the use of the bus decreases, and the use of the tram increases during the summer. Although we expected that the use of a bus decreased in winter because the delay time of the bus became very big on a snowy day as shown in Fig. 2, the results were completely the opposite. Subject A went to the office by tram, bus, or car mainly. Although subject A often worked in the workplace where it was easy to access by tram during summer, he worked not only there but also in the workplace where it was easy to access by bus during winter. Therefore he came to use tram much in summer and also use a bus much in winter inevitably.


Mode comparison between two seasons (subject A)
4.1.2 Subject B
Table 4 shows subject B’s count result of the number of the trips according to the trip purpose, and Fig. 9 shows a ratio of each transportation modes among all trips of subject B. Table 4 shows the trip purposes of subject B can be classified into five kinds of activity, and the average number of trips per day in summer is 4.01 and in winter is 3.92. It means that summer is higher in a going-out rate. Subject B had very high shopping frequency, and she went shopping more than once a day regardless of a season.


Mode comparison between two seasons (subject B)
Contrary to subject A, subject B has consistent lifestyle such as commuting, going shopping after work, and going back home because commute trips are observed a lot and offices are fixed as showed in Figs. 6 and 7. There are little travel behavior differences between summer and winter as shown in Table 4.
Figure 9 shows that subject B uses a car for most of her travels, while subject A hardly changed transportation mode depending on the season. Although Hakodate city has a lot of snow and frozen roads, they are taken measures to meet these situations. Accordingly, those who use cars wouldn’t change transportation mode to another one because of road change.
4.2 Weather Impact Analysis
Weather also affects travel behavior. This study focuses on trips for exercise different from physiological requisite activity and obligatory activity by subject A who is relatively free.
The number of average trips decreases both in winter and summer on the raining days (including snowing days) as shown Table 5. Accordingly, precipitation affects individual travel behavior.
Figures 10 and 11 represent days of weeks at horizontal axis and number of trips at vertical axis, and they explain if there were trips for exercise and if there was precipitation more than 0 mm/h or accumulated snow more than 10 cm. They show that trips for exercise aren’t affected by weather although it isn’t an obligatory activity because there are many trips for exercise even if there was rain and snow.


Weather impacts for activity in summer


Weather impacts for activity in winter
5 Transportation Mode Identification
5.1 Aggregate Information of Trips
We analyze two persons’ GPS data in Hakodate, Hokkaido, Japan, during the 8 months (including summer and winter). Totally, there are 1,036 trips, 648 trips in summer and 388 trips in winter. The transportation modes utilized during the 8 months include private car/taxi, bicycle, bus, street car, and walk. Private car and taxi are combined due to their similar features.
5.2 Attribute Selection
The attributes used for transportation mode identification include variables related to temperature and trip and activity. Table 6 shows the detailed information of attributes selected for analysis. Temperature-related attributes are in bold.
5.3 Methodology
Random forest method is used to identify transportation mode in a machine learning way. The advantage of random forests is that it not only provides the accuracy on training set and test set, but also shows the importance of each attribute.
Python and scikit-learn toolbox [4] are used as the platform of random forests.
5.4 Scenarios and Results
5.4.1 Scenarios
In order to assess the necessity that training data set and testing data set should select from the same season or not, four scenarios are set. The details of scenarios present in Table 7. Generally, there will be an accuracy decrease from training set to test set when using the same machine learning method. In order to demonstrate the accuracy difference that is caused by transformation from training to testing or weather-related variables, there are more than one test set in each scenario.
5.4.2 Results and Discussion
The accuracy of random forest on training set and test set in each scenario is shown in Table 8.
Accuracy of identification in training set in each scenario is very high, almost 100 %. However, if accuracy of test sets is concerned, it varies sharply among sets. It is clear that when data in single season, like scenarios 1 and 2, the accuracy in test set of the other season will drop extremely; however, the accuracy in the test set of the same season drops not as sharply as the other season. It means that using one season data for training and the other season for predicting is not appropriate.
When using 70 % whole data for training in scenario 3, no matter the accuracy of test set of summer or winter, the accuracy is very satisfying. But the accuracy of test set of the other 30 % whole data is not close to the former two test sets. Training set owning almost 70 % of the same data in test sets 1 and 2 is probably the reason. It can be also proved by the results in scenario 4 in which training set and test set do not overlap each other. It demonstrates that using both seasons as training data, no matter the test set is single season data or mixed season data, the accuracy is almost the same.
The importance of each attribute in each scenario is shown in Table 9. It is clear that average speed during the trip is the most important attribute for identifying transportation mode. Trip distance, time spent during the trip, and average distance from trip end to home/workplace are other important attributes. Regarding weather-related attributes, they show a generally medium importance during the identification process.
6 Conclusions
This study analyzes how season and weather affect individual travel behavior from probe person survey data in Hakodate and tries to identify which transportation mode is used by using random forest model. Moreover, combined data between training data and test data is used for evaluation of which combination shows highest accuracy. Knowledge from this study is shown below:
-
The change of the personal travel action caused by season or weather was clarified.
-
It was found that trips by bicycle, walk, and bus are especially dependent on a road state change.
-
Model which is overlapped in both data in summer and winter showed highest accuracy in both estimations in summer and winter when random forest model is used for transportation mode distinction.
-
In addition, average speed of the trip was the most important as a characteristic to contribute to transportation mode detection. Furthermore, weather condition such as weather, temperature, and precipitation also contributed to some extent.
Future works are shown as follows:
-
We performed basic analysis and model analysis from the GPS trajectory data of only two persons. It is useful to increase samples from now and analyze in future.
-
We identify only transportation mode by random forest model, but should also detect moving/staying location and trip purpose.
-
We will build the mode choice model of the personal level in the Hakodate urban area based on automatic formed trip data.
References
Soora Rasouli and Harry Timmermans, 2014, “Mobile Technologies for Activity-Travel Data Collection and Analysis”, Information Science Reference.
Miao Lin and and Wen-Jing Hsu, 2014, “Mining GPS data for mobility patterns: A survey”, Pervasive and Mobile Computing, 12, 1–16.
Shoji Sano, Ryo Kanamori, Keiji Hirata and Hideyuki Nakashima, 2013, “Smart City Hakodate Project: Traffic Behavior Reports for a Traffic Flow Simulator”, WSSIT2013.
Pedregosa, F., Varoquaux, G., Gramfort, A., Michel, V., Thirion, B., Grisel, O., and Duchesnay, É., 2011, “Scikit-learn: Machine learning in Python” The Journal of Machine Learning Research, 12, 2825–2830.
Author information
Authors and Affiliations
Corresponding author
Editor information
Editors and Affiliations
Rights and permissions
Copyright information
© 2017 Springer Japan
About this paper
Cite this paper
Araki, M., Kanamori, R., Gong, L., Morikawa, T. (2017). Impacts of Seasonal Factors on Travel Behavior: Basic Analysis of GPS Trajectory Data for 8 Months. In: Sawatani, Y., Spohrer, J., Kwan, S., Takenaka, T. (eds) Serviceology for Smart Service System. ICServ 2015. Springer, Tokyo. https://doi.org/10.1007/978-4-431-56074-6_41
Download citation
DOI: https://doi.org/10.1007/978-4-431-56074-6_41
Publisher Name: Springer, Tokyo
Print ISBN: 978-4-431-56072-2
Online ISBN: 978-4-431-56074-6
eBook Packages: EngineeringEngineering (R0)