
Abstract
This article is a continuation and extension of the Authors’ work on the ways to ensure safety of aerodrome’s traffic in the aspect of aeronautical data quality at the stage of its final operational use. The subject of the research is the ILS system, which is a critical element of airport CNS devices (communication, navigation and surveillance). Ensuring the quality and continuity of ILS is not only a legal requirement, but also an operational and business goal of the airport managing body. In the article the ILS system was characterized and special attention was paid to operational objectives, technical specifications as well as integrity and continuity of ILS service. The issues of reliability and availability of the operational ILS system were considered. A study of the objectives and the business continuity management standard were carried out. Then objectives and context were established and a study of methods for operational risk management in aerodrome’s traffic was conducted. Using the selected methods (including the Shewhart control chart), ILS continuity analysis was performed. Based on the results obtained, conclusions were formulated regarding the possibility of selected statistical methods’ practical application for management of the ILS system’s operational continuity.
Access provided by CONRICYT-eBooks. Download conference paper PDF
Keywords
1 Instrument Landing System’s Characteristics
1.1 General Description
Instrument Landing System (ILS) is one of the aerodrome standard radio navigation aids, used to perform operations of precision approach and landing. The detailed specification and description of this system can be found in [4], that is why in this paper only the basic information is presented.
The main ILS technical parameter is Difference in Depth of Modulation (DDM), which is (according to the definition [4]) the percentage modulation depth of the larger signal minus the percentage modulation depth of the smaller signal, divided by 100.
The ILS system consists of the following basic components:
-
a.
localizer equipment (LOC) with the associated monitor system, remote control and indicator equipment; where LOC is a VHF two-frequency system, in which coverage is achieved by the use of two independent radiation field patterns spaced on separate carrier frequencies within the particular localizer VHF channel. The radiation from the localizer antenna system shall produce a composite field pattern, which is amplitude modulated by a 90 Hz and a 150 Hz tone, emitting a course sector with one tone predominating on one side of the course and with the other tone predominating on the opposite side.
-
b.
glide path equipment (GP) with the associated monitor system, remote control and indicator equipment; where GP is a UHF two-frequency system, in which coverage is achieved by the use of two independent radiation field patterns spaced on separate carrier frequencies within the particular glide path channel. The radiation from the UHF glide path antenna system shall produce a composite field pattern, which is amplitude modulated by a 90 Hz and a 150 Hz tone, to be arranged to provide a straight line descent path in the vertical plane containing the centre line of the runway, with the 150 Hz tone predominating below the path and the 90 Hz tone predominating above the path to at least an angle equal to 1.75 θ.
-
c.
VHF marker beacons (respectively: outer – OM, middle – MM and inner – IM), or distance measuring equipment (DME), together with associated monitor system, remote control and indicator equipment while marker beacons shall operate at 75 MHz with a frequency tolerance of ±0.005% and shall utilize horizontal polarization. The system is expected to provide coverage over the following distances, measured on the ILS glide path and localizer course line:
-
inner marker (where installed): 150 m ± 50 m (500 ft ± 160 ft),
-
middle marker: 300 m ± 100 m (1 000 ft ± 325 ft),
-
outer marker: 600 m ± 200 m (2 000 ft ± 650 ft).
To sum this short description up it can be said that the ILS-LOC emits the course line into the aerodrome airspace, which means the locus of points nearest to the runway centre line in any horizontal plane at which the DDM is zero, while the ILS-GP emits the glide path into the aerodrome airspace, which in practice means the locus of points in the vertical plane, containing the runway centre line at which the DDM is zero. The principle of ILS operational use is the measurement of angular displacement, i.e. the ratio of measured DDM to the corresponding angular displacement from the appropriate reference line, and in the case of LOC also the ratio of measured DDM to the corresponding lateral displacement from the appropriate reference line [4].
Instrument Landing Systems are divided into three categories based on the operating minima:
-
a.
ILS Cat I – system which provides guidance information from the coverage limit of the ILS to the point at which the localizer course line intersects the ILS glide path at a height of 60 m (200 ft) or less above the horizontal plane containing the runway threshold;
-
b.
ILS Cat II – system which provides guidance information from the coverage limit of the ILS to the point at which the localizer course line intersects the ILS glide path at a height of 15 m (50 ft) or less above the horizontal plane containing the runway threshold;
-
c.
ILS Cat III – system which, with the aid of ancillary equipment where necessary, provides guidance information from the coverage limit of the facility to, and along, the surface of the runway.
The ILS shall be constructed and adjusted so that, at a specified distance from the threshold, similar instrumental indications in the aircraft represent similar displacements from the course line or ILS glide path as appropriate, irrespective of the particular ground installation in use.
To ensure an adequate level of safety, the ILS shall be so designed and maintained that the probability of operation within the performance requirements specified is of a high value, consistent with the category of operational performance concerned.
The installation and parameters of the ILS system are based in particular on the determination of certain special points (“T” and: “A”, “B”, “C”, “D”, “E”) for which the required LOC and GP characteristics are specified (see Fig. 1).

LOC and GP bend amplitude limits [own study based on 4]
The mentioned points can be defined as follows:
-
a.
ILS reference datum (Point “T”) is a point at a specified height located above the intersection of the runway centre line and the threshold and through which the downward extended straight portion of the ILS glide path passes located on the runway threshold i.e. the beginning of that portion of the runway usable for landing [5];
-
b.
ILS Point “A” – a point on the ILS glide path measured along the extended runway centre line in the approach direction a distance of 7.5 km (4 NM) from the runway threshold;
-
c.
ILS Point “B” – a point on the ILS glide path measured along the extended runway centre line in the approach direction a distance of 1 050 m (3 500 ft) from the runway threshold;
-
d.
ILS Point “C” – a point through which the downward extended straight portion of the nominal ILS glide path passes at a height of 30 m (100 ft) above the horizontal plane containing the runway threshold;
-
e.
ILS Point “D” – a point 4 m (12 ft) above the runway centre line and 900 m (3 000 ft) from the threshold in the direction of the localizer;
-
f.
ILS Point “E” – a point 4 m (12 ft) above the runway centre line and 600 m (2 000 ft) from the stop end of the runway in the direction of the runway threshold [4].
1.2 Measures of Reliability
For radio navigation aids, such as the ILS system, the International Civil Aviation Organisation (ICAO) defined the following measures of reliability:
-
facility reliability – the probability that the ground installation operates within the specified tolerances;
The general formula of the ILS reliability (for which the failures follow a Poisson distribution) – R (as a percentage), defined as a probability that the facility will be operative within the specified tolerances for a time t, is expressed as in (1) [4]:
where:
-
e - base of natural logarithms;
-
t - time period of interest;
MTBF - mean time between ILS failures - the actual operating time of a facility divided by the total number of failures of the facility during that period of time.
-
signal reliability, which is according to its definition the probability that a signal-in-space of specified characteristics is available to the aircraft;
-
facility availability – the ratio of actual operating time to specified operating time.
The general formula of the ILS availability – A (as a percentage), may be expressed as a probability that the ILS will be operative within the specified tolerances for a time t, by formula (2):
where:
-
ATO - actual time operating;
-
SOT - specified operating time;
-
a - operating period;
-
n - number of operating periods;
-
s - scheduled shutdown period;
-
m - number of scheduled shutdown periods;
-
f - failure period;
-
l - number of failure periods;
-
(s and f - non-operating periods),
-
and can be presented on the following scheme (see Fig. 2):
Fig. 2. 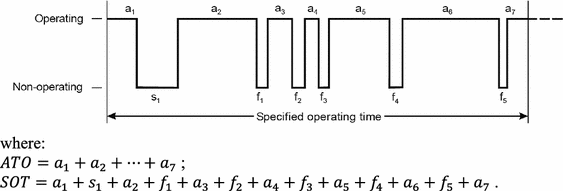
Exemplary evaluation of ILS availability and reliability [4]

and the MTBF parameter can be described as:
2 Instrument Landing System Continuity Issue
The reliability of ILS operations at the aerodrome determines the continuity and regularity of air traffic service, regardless of the current meteorological flights conditions (MFC). That is why it can be stated that assurance of the ILS continuous service and compliance with the requirements, can be considered both in terms of safety and the economic interest of the aerodrome’s operator as well as of air carriers and passengers.
The issue of compliance with the requirements concerns the technical characteristics of the ILS operation and aerodrome operating minima, which express the limits of an aerodrome’s usability for the operations of:
-
take-off, expressed in terms of RVR (Runway Visual Range) or visibility and cloud conditions;
-
landing, expressed in terms of RVR and DH (Decision Height) or minimum descent height (MDH) and cloud conditions as appropriate to the category of the operation [3]);
as well as the completeness and correctness of signals received by aircrafts on-board navigational devices. This can be considered in the aspect of information quality assurance [17] in the final use of aeronautical data and information, what was the subject of the Authors’ previous works [1, 2, 16].
At the same time the issue of ILS continuity can be considered in terms of the reliability and impact of breaks (failure periods) as well as planned technical maintenance (scheduled shutdown periods) on the volume of traffic and air transport, what was the subject of the Authors’ previous work [14, 15] as well.
The basic quality and reliability parameters of ILS operational usage, defined by ICAO, are:
-
ILS integrity – that quality which relates to the trust which can be placed in the correctness of the information supplied by the facility. The level of integrity of the localizer or the glide path is expressed in terms of the probability of not radiating false guidance signals [4]; and
-
ILS continuity of service – that quality which relates to the rarity of radiated signal interruptions. The level of continuity of service of the localizer or the glide path is expressed in terms of the probability of not losing the radiated guidance signals [4].
Thus, a significant issue of ILS activities continuity assessment appears. Certain methods for analysing the continuity and integrity of ILS have already been published by ICAO [2, 4, 5]. However, these methods are mainly focused on the assessment of technical reliability and quality (the compliance of selected parameters with the requirements), for example - the 95% of maximum amplitude specification is the allowable percentage of total time interval in which the course/path bend amplitude must be less than the amount specified in Fig. 1 for the period being evaluated.
Figure 3 presents a typical example of the method that can be employed to evaluate the course/path bend amplitude at a particular facility.

Evaluation of LOC/GP bend amplitude [own study based on 4]
If the sum of the time intervals t1, t2, t3, t4, in which the given specification is exceeded (±2σ i.e. maximum deflection amplitude at point K), is equal to or less than 5% of the total time T, the region that is being evaluated is acceptable. Therefore:
Guidelines for the production, installation and certification of ILS are set out in ICAO EUR Doc 012 [6]. It seems natural to install the system on a site that is reasonably clear of any obstructions, which could affect the radiated signals. That is why extensive ground and flight tests should be made to ensure that all parameters of the radiated signal are compliant with ICAO Annex 10 SARPs. Guidelines for such tests as well as for evaluation of their results are provided in other ICAO documents [4, 7] but such tests should be carried out at both extremes of the environmental conditions. And in order to confirm the stability of key parameters in the operational environment long term performance measurements should be made.
As the Continuity of a new ILS system’s performance cannot be established in the operational environment, according to requirements [4, 6, 7] it must be demonstrated, to a high degree of confidence, that the system, or type of system, possesses the required reliability. At the same time the analysis showing that the theoretical continuity of service is at least twice that required in operational service is necessary. In case of system’s integrity the manufacturer should provide evidence that the system meets all the non-site-specific requirements and the requirement for the intended category of use. As integrity cannot be verified by field tests, it is essential that this is verified by detailed analysis. This will normally be carried out using techniques such as Fault Tree Analysis (FTA) and Failure Modes, Effects and Criticality Analysis (FMECA) [13]. The Authors point out that the indicated methods of analysis are in fact methods of risk analysis, defined in the ISO 31010 standard [12]. This is therefore in accordance with the general rule of applying in civil aviation only tools and methods such as analytical or certified standards defined in international ICAO or ISO.
As the Authors’ practical experience shows, assurance of ILS’ continuity is a complex issue that can be considered in the aspects of quality and reliability both technical as well as operational. In practice of airport’s operation management the aspect of investments’ economic profitability and the subsequent ILS maintenance and reconfiguration are also important as they determine the operating minima of the aerodrome. Considering this, it should be borne in mind that the economic results also depend on the operated air traffic’s structure and the variability of meteorological flight conditions (FMC). This confirms the legitimacy of the approach adopted by the Authors based on integrated risk management and business continuity as stated in ISO standards [10, 11] and can be acknowledged by the cited ICAO publications.
The business continuity risk management process is based on two analytical components:
-
1.
business impact analysis (BIA) that provides an analysis of how key disruption risks may affect organization’s operations and identifies and quantifies the capabilities that are required to manage it [10, 12], and
-
2.
risk assessment (RA) – the overall process of risk identification, risk analysis and risk evaluation [10, 11].
BIA is a formal and documented evaluation process for determining continuity and recovery priorities, objectives and targets. This process shall include assessing the impacts of disrupting activities that support the organization’s products and services. BIA shall include the following:
-
a.
identifying activities that support the provision of products and services;
-
b.
assessing the impacts over time of not performing these activities;
-
c.
setting prioritized timeframes for resuming these activities at a specified minimum acceptable level, taking into consideration the time within which the impacts of not resuming them would become unacceptable; and
-
d.
identifying dependencies and supporting resources for these activities, including suppliers, outsource partners and other relevant interested parties [10].
The most important “ILS BIA” outputs are documented results of financial and operational impacts from a loss of the ILS operating usage and outage time frames for the ILS operating and maintenance process.
RA is a formal documented risk assessment process that systematically identifies, analyses, and evaluates the risk of disruptive incidents to the organization [11]. The organizational RA process shall, according to [10, 12]:
-
a.
identify risks of disruption to the organization’s prioritized activities and the processes, systems, information, people, assets, outsource partners and other resources that support them,
-
b.
systematically analyse risk,
-
c.
evaluate which disruption related risks require treatment, and
-
d.
identify treatments commensurate with business continuity objectives and in accordance with the organization’s risk appetite [10].
The most important “ILS RA” outputs are documented results of technical and operational incidents impacts considering ILS reliability, availability and integrity aspects.
Adequate methods of BIA and RA are specified in the ISO 31010 standard [12].
The limitation in the practice of overall ILS business continuity management using standard analytical risk management methods is that they mainly relate to independent events and random incidents. This is not sufficient because in the operational use process as well as ILS operational and technical maintenance next to the failure periods, there are also scheduled shutdown periods, when planned control and maintenance procedures are implemented, which can additionally be designed to change the parameters i.e. category, quality, availability, reliability and continuity, MTBO, MTBF, according to existing needs and changing requirements. That is why the Authors proposed the concept of the ILS continuity analysis method described in the following chapter.
3 The Concept of Continuity and Integrity Analysis
Taking into account the above-mentioned rule of implementing only certified or standard methods, the developed concept was based on ISO standards, with appropriate consideration of ICAO SARPs.
The first stage of the proposed method is the execution of the aerodrome’s “BIA ILS”. It is not a difficult or time-consuming task, but requires possession of the adequate input data. The quality of the obtained BIA results can be significantly increased if customers and stakeholders, i.e. air carriers and air traffic service providers participate in the BIA process.
The second stage of the proposed concept is the evaluation of the ILS integrity and continuity assurance based on the statistical process management methods’ implementation, in particular with the use of the modified Shewhart control charts method. As mentioned in Sect. 2 of this paper the basic quality and reliability parameters of the ILS system are integrity and continuity. In the elaborated concept preparation of modified Shewhart control charts for these two parameters is proposed. The requirements according to their values can be found in ICAO Annex 10 [4] and are generally shown in Table 1. For the purpose of the elaborated concepts’ description in Table 2 requirements/recommendations for the ILS system – Cat III (as the most frequently installed in large airports) were presented and further analysed.
Based on the data, presented in Table 2, it can be stated that required and recommended values for localizer (LOC) and glide path (GP) are equal. As two components (integrity and continuity) are considered, it can be said that the analysed parameters are:
-
the probability Pi of not radiating false guidance signals in any one landing (component - integrity),
-
the probability Pc of not losing the radiated guidance signals in any one landing (component – continuity),
both for the localizer and the glide path.
Therefore, it can be said that the required value of Pi parameter (for LOC and GP) must be not less than (1 – 0.5 * 10−9), what can be written as:
wherein:
At the same time the required value of Pc parameter (for LOC as well as GP) should be:
wherein:
In fact it is the number of incompatibilities (understood as radiated false guidance signals or the lost guidance signals) that should be monitored and then compared to the requirements. That is why for the purpose of ILS integrity and continuity of service monitoring the Authors propose to apply one of the Shewhart control charts for attribute data with introduced modifications. These cards allow the presentation of the observations obtained by recording whether the examined unit meets certain requirements or not, or whether it has a specific feature or not. The assessment is therefore carried out in a zero-one manner, which means that these cards are usually simpler to execute and do not require large amounts of work. For the analysed ILS parameters, to assess the fraction of non-compliant units (radiated false guidance signals or the lost guidance signals), the U-type chart seems to be the most suitable. It indicates the mentioned index of incompatibilities – u [9], which is the ratio of the number of inconsistencies c to the size of the entire sample – in the analysed case the number of all landings n.
whereby the value n may be characterized by 25% variability. Moreover, in case of the selected chart, it is assumed that the quality defects in the process are rare and control limits are determined on the basis of Poisson distribution. In the ILS system under investigation, in order to ensure the overriding objective of flight operations safety [8], the number of inconsistencies should aim for 0 (u → 0). The u parameter can have values within the range <0, 1>, where u = 1 means that all radiated guidance signals were false or lost. This situation is naturally unacceptable.
The control limits and the central line of the U chart are determined on the basis of the formulas, presented in Table 3.
where:
-
\( \bar{n} \) – the average number of landings,
-
\( \bar{u} \) – the average number of false/lost guidance signals in the analysed period,
-
c1, c2, …, ck – the number of false/lost guidance signals in the following days of the analysed period,
-
n1, n2, …, nk – the number of landing operations in the following days of the analysed period
As the probabilities Pi and Pc stated in Annex 10 ICAO [4] have the form of an equation 1 − x (where x is the variable presented in Table 2 and characterizing the number of incompatibilities), it is proposed to implement on the modified Shewhart control chart the value (1 − u), as described in the following part of the article.
In the developed solution it was assumed that:
-
a.
ILS integrity and continuity of service parameters will have separate U control charts, however the rules for their creation will be similar;
-
b.
as a period of subsequent control charts’ creation a 30-days interval is assumed, as according to the requirements [7] periodic inspections of the ILS system should be performed at least every 30 days, so it is proposed to create one modified Shewhart control U-chart for each operation period;
-
c.
one control chart should contain all consecutive days of the given (usually 30-days) period, wherein each analysed day will constitute a separate subgroup k; this means that k parameter should be equal to or at least close to 30;
-
d.
sample (subgroup) size, which for the considered case in fact is n (the number of landing operations in the following days of the analysed period) for one chart should be constant for all days of the given operating period, which means for all k subgroups; should the number of landing operations vary (within 25% tolerance range) from day to day, control limits must be calculated separately for each n value,
-
e.
the classic U control chart should be modified so that the value (1 − u) is presented on the chart,
-
f.
it is proposed to consider and present on the prepared control charts the required value (see Table 2) as the UCL from ICAO SARP’s and the recommended value (see Table 2) as the “warning limit”.
The developed and described solution is shown on Figs. 4 and 5.

Modified U-type control chart for ILS continuity assessment [own study] (note: due to very small values the proportions on the figure are not preserved)

Modified U-type control chart for ILS integrity assessment [own study] (note: due to very small values the proportions on the figure are not preserved – idea figure)
In the developed solution, the algorithm for creating U-type control chart is the following:
-
a.
based on the collected data in the evaluated operating cycle, determine the number of landing operations - parameter n and check whether its value is constant for all days of the analysed period, in case when the n value changes from day to day, it will be necessary to calculate the control limits repeatedly (the UCL limit will not be a straight line),
-
b.
calculate the values of incompatibilities’ indexes – u1, u2, …, uk for the consecutive days of the analysed period,
-
c.
prepare the U-type chart, marking the incompatibility indexes for each day of the analysed ILS operational period in the form of (1 − uk), then draw on the prepared card the control limits from Annex 10: the required value as UCL and the recommended value as the warning line,
-
d.
analyse the results.
As soon as the appropriate data set is recorded it will be possible to calculate also the upper and lower control limits (UCL and LCL) based on the formulas presented in Table 3. The way of their introduction on the obtained control chart will be the subject of Authors’ further work. However, it must be borne in mind that the calculated limits are narrower than the ones from ICAO Annex 10. Still calculation of the control limits, based on the presented formulas and their location in relation to already marked lines, resulting from the provisions of Annex 10, will be a verification of the operational effectiveness of the analysed ILS system.
4 Conclusion
The operation of ILS system is influenced by numerous, random and time-varying disturbing factors. As practical experience shows, their impact may be intensified alike in the first phase after installation as well as in subsequent exploitation stages, leading to non-compliance with technical and operational requirements.
The elaborated concept goes beyond the frameworks of ILS reliability and continuity analysis. As based on international standards, described solution seems to form an universal method, which takes into account the legal requirements of technical and operational character as well as economic, exploitational and meteorological factors. Thanks to this, in its practical implementation on the basis of the obtained results it will be possible to decide primarily about:
-
changes and reconfiguration of ILS technical and reliability structure,
-
operating parameters and ILS operational use,
-
changes in plans and procedures concerning ILS system’s actual state’s verification.
In a way that increases the ability to continuously meet requirements as well as optimize the continuity of aerodrome’s operation in the commercial and economic aspect. However, the Authors draw attention to the fact that a significant factor, determining the adequacy of the obtained analysis results, and thus the efficiency and effectiveness of the decisions made on their basis, are the results of BIA analysis [14, 15]. Mentioned issues will be subject of Authors’ further work.
References
Dudek, E., Kozłowski, M.: Koncepcja zastosowania metodyki DMAIC do zapewnienia jakości danych lotniczych. In: Kwasiborska, A. (ed.): Transport lotniczy i jego otoczenie, Wydział Transportu Politechniki Warszawskiej, ss. 67–78 (2016)
Dudek, E., Kozłowski, M.: The concept of a method ensuring aeronautical data quality. J. KONBiN 1(37), 319–340 (2016)
ICAO Annex 6 to the Convention on International Civil Aviation, Operation of Aircraft, Part I: International Commercial Air Transport – Aeroplanes, July (2001)
ICAO Annex 10 to the Convention on International Civil Aviation, Aeronautical Telecommunications, Volume I: Radio Navigation Aids, July (2006)
ICAO Annex 14 to the Convention on International Civil Aviation, Aerodromes, volume I, Design and Operation, International Civil Aviation Organization, July (2009)
ICAO EUR Doc 012 European Guidance Material on Continuity of Service Evaluation in Support of the Certification of ILS & MLS Ground Systems, December (2002)
ICAO Doc 8071 Manual on Testing of Radio Navigation Aids (2000)
ICAO Doc 9859, Safety Management Manual (SMM) (2013)
ISO 7870-2:2013 Control Charts - Part 2: Shewhart Control Charts (2013)
ISO 22301:2012 Societal Security – Business Continuity Management Systems – Requirements (2012)
ISO 31000:2009 Risk Management – Principles and Guidelines (2009)
ISO 31010:2010 Risk Management – Risk Assessment Techniques (2010)
ISO/IEC 60812:2006 Analysis Techniques for System Reliability, Part 2 Procedure for Failure Mode and Effects Analysis (FMEA) (2006)
Kozłowski, M.: Aspect of reliability in airport business continuity management. J. KONBiN 3(35), 43–50 (2015)
Kozłowski, M.: The concept of method for determining the minimum level of airport business continuity. J. KONBiN 1(37), 5–22 (2016)
Kozłowski, M., Dudek, E.: Risk analysis in air transport telematics systems based on aircraft’s airbus A320 accident. In: Mikulski, J. (ed.) TST 2017. CCIS, vol. 715, pp. 385–395. Springer, Cham (2017). https://doi.org/10.1007/978-3-319-66251-0_31
Siergiejczyk, M.: Assessing transport telematic systems in terms of data services quality. In: Mikulski, J. (ed.) TST 2012. CCIS, vol. 329, pp. 356–363. Springer, Heidelberg (2012). https://doi.org/10.1007/978-3-642-34050-5_40
Author information
Authors and Affiliations
Corresponding author
Editor information
Editors and Affiliations
Rights and permissions
Copyright information
© 2018 Springer Nature Switzerland AG
About this paper

Cite this paper
Dudek, E., Kozłowski, M. (2018). The Concept of the Instrument Landing System – ILS Continuity Risk Analysis Method. In: Mikulski, J. (eds) Management Perspective for Transport Telematics. TST 2018. Communications in Computer and Information Science, vol 897. Springer, Cham. https://doi.org/10.1007/978-3-319-97955-7_21
Download citation
DOI: https://doi.org/10.1007/978-3-319-97955-7_21
Published:
Publisher Name: Springer, Cham
Print ISBN: 978-3-319-97954-0
Online ISBN: 978-3-319-97955-7
eBook Packages: Computer ScienceComputer Science (R0)