
Abstract
Border cells are a cluster of cells that migrate from the anterior tip of the Drosophila egg chamber to the border of the oocyte in stage 9. They serve as a useful model to study collective cell migration in a native tissue environment. Here we describe a protocol for preparing ex vivo egg chamber cultures from transgenic flies expressing fluorescent proteins in the border cells, and using confocal microscopy to take a multi-positional time-lapse movie. We include an image analysis method for tracking border cell cluster dynamics as well as tracking individual cell movements.
Access provided by CONRICYT – Journals CONACYT. Download protocol PDF
Key words
1 Introduction
A general review of the anatomy and development of Drosophila ovaries can be found elsewhere [1]. Here we focus on stage 9 egg chamber s (Fig. 1), which are composed of 1 oocyte and 15 nurse cells surrounded by several hundred epithelial follicle cells . At each end of each egg chamber, a special pair of cells called polar cells develops. The anterior polar cells recruit four to eight follicle cells to surround them and form a cluster called the border cell s . In early stage 9 egg chambers (Fig. 1a), the border cell cluster rounds up, detaches from the anterior follicle cell layer , and migrates in between the nurse cells. As the cluster approaches the oocyte (Fig. 1b), it turns dorsally and stops close to the oocyte nucleus in late stage 9. Border cell migration serves as a useful model to study collective cell migration in a native environment [2]. The development of live imaging of border cell migration ex vivo [3] has opened the door to studying the dynamics of this process and has revealed new insights into the molecular and cellular mechanisms underlying this behavior (e.g., [4, 5]).

Illustration of border cell cluster migration in stage 9 egg chamber s. (a) Border cell cluster (green) surrounding anterior polar cells (red) detaching from the outer follicle cell layer during early stage 9. (b) Border cell cluster reaching oocyte border during late stage 9. Arrows indicate the direction of movement. Anterior is to the left and dorsal is up
Here we describe a protocol for preparing stage 9 egg chamber s with fluorescently labeled border cell s for multi-positional time-lapse confocal imaging followed by 3D analysis to track the whole cluster as well as individual cell movements. Oxygen, pH, and nutrients are critical factors for ensuring healthy ex vivo egg chamber development. Key factors to consider during imaging include avoiding phototoxicity and dynamic adjustment to keep the region of interest in focus. For image analysis , it is necessary to perform a drift correction to adjust for egg chamber motion and growth.
2 Materials
2.1 Fly Stocks That Express Fluorescent Reporters in Border Cells
-
1.
Slbo-Gal4 can be used to drive UAS-fluorescent reporters in border cell s [6] (Fig. 2a, c). An advantage of slbo-Gal4 is that it is expressed relatively specifically during oogenesis and is viable in combination with many transgenes, such as dominant-negative Rac, that are lethal in combination with most other Gal4 drivers. A disadvantage of slbo-Gal4 however is that its expression in border cells is relatively weak at the beginning of their migration and becomes stronger and stronger during the migration, so that exposure times need to be adjusted throughout the course of the experiment. Slbo-Gal4 also drives expression in a small group of posterior follicle cells and in centripetal follicle cells later in stage 10. Other Gal4 lines such as c306-Gal4 also drive high expression in border cells [7] (Fig. 2b, d). The advantage of c306-Gal4 is that the expression level does not change much during stage 9. A disadvantage of c306-Gal4 is that it drives expression earlier in development and is lethal in combination with many RNAi transgenes or transgenes driving dominant-negative proteins. This problem can be circumvented by combining c306-Gal4 with Gal80ts and growing the flies at 18 °C followed by a shift to 30 °C to inactivate Gal80ts. We note that c306-Gal4 drives expression in a larger subset of follicle cells as compared to slbo-Gal4, which may be an advantage or a disadvantage, depending on the experiment.
Fig. 2 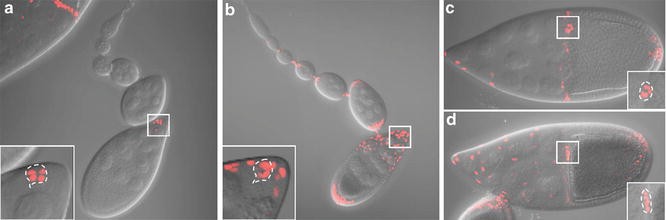
Expression patterns of slbo-Gal4 and c306-Gal4. Maximum intensity projection of z stacks showing fluorescence superimposed on DIC images for slbo-Gal4 (a and c) or c306-Gal4 (b and d) driving UAS-dsRednls expression. The germarium through early stage 9 is shown in (a) and (b). Stage 10 egg chamber s are shown in (c) and (d). Inset shows the magnified view of the boxed area with maximum intensity projection of the cropped z stacks for the border cell cluster . The outline of the border cell cluster is shown by the dashed line
-
2.
After choosing the Gal4 driver, one needs to decide on the fluorescent protein to express. Nuclear fluorescent proteins such as dsRednls are useful to track individual cells, while F-actin -associated fluorescent proteins such as GFP ::moesin and lifeact are useful to track the morphology of the whole cluster. Fluorescent reporters such as His2Av-mCherry for labeling all nuclei, or fluorescent dyes such as FM4-64 for labeling cell membrane , may also be used. We have generated transgenic flies expressing fluorescent proteins under the direct control of the slbo enhancer, which allows the use of Gal4 for other purposes. The lines we have found to be most useful are summarized in Table 1.
Table 1 Useful fluorescent labels for live imaging -
3.
Fly food vials.
-
4.
Dry yeast.

2.2 Imaging Medium
-
1.
Schneider’s Drosophila medium (Invitrogen, cat. no. 11720).
-
2.
Fetal bovine serum (FBS; Invitrogen, cat. no. 16140).
-
3.
Insulin (Sigma, cat. no. I1882).
-
4.
HCl (1 M).
-
5.
0.22 μm filter (Millipore, cat. no. SCGP00525).
-
6.
Dissection medium: Schneider’s medium + 20 % FBS.
-
7.
Live imaging medium: Dissection medium + 0.2 mg/ml insulin.
2.3 Dissection Tools
-
1.
Anesthesia: CO2 blow gun and fly pad.
-
2.
Paintbrush.
-
3.
2-Well depression glass slides (Fisher Scientific, cat. no. 12-565B).
-
4.
Dissecting microscope.
-
5.
Dumont tweezers #5 Dumoxel (WPI, cat. no. 14098).
-
6.
Transfer pipets (Thermo Scientific, cat. no. 231).
2.4 Mounting Tools
-
1.
Micropipettes with disposable tips (2–20 μl, 20–200 μl, 100–1000 μl).
-
2.
Lumox hydrophilic culture dishes (50 mm) (Sarstedt, cat. no. 94.6077.410).
-
3.
Glass cover slips (Fisher, cat. no. 12-542-B, 12-545-C).
-
4.
Kimwipe tissue.
-
5.
Halocarbon oil 27 (Sigma, cat. no. H8773).
2.5 Imaging Tools
In order to take a 3D time-lapse movie, fast imaging speed is required for acquiring a z stack of the entire border cell cluster in less than 1 min. Border cell migration will be affected by phototoxicity; therefore a sensitive detector is needed so low light can be used. Because border cells are located 50–100 μm below the surface of the egg chamber and compression of the egg chamber will impede migration , a long-working-distance objective is needed. Also, water immersion is a more suitable medium than air or oil because it matches the refractive index of the mounting medium and tissue. The software should be able to handle live adjustment of the focus and location in a time series. We use the system below in the following Subheading 3 although we have been able to acquire live imaging on Nikon, Leica, and Zeiss 510 and Zeiss 710 laser scanning confocal systems, as well as a Zeiss Axioplan 2 widefield microscope. Confocal imaging gives substantially better results. We have not had success using spinning disk microscopy, which for reasons that are not entirely clear seems more phototoxic.
-
1.
Zeiss 780 34Ch Spectral Confocal System with scanning stage.
-
2.
40× LD water objective (LD C-Apochromat 40×).
-
3.
Zen software.
-
4.
Multitime macro.
2.6 Data Analysis Tools
ImarisTrack or other segmentation software
3 Methods
3.1 Fatten Flies
-
1.
Collect newly eclosed flies (8–12 females and a couple of males) of the desired genotype in a fresh vial with fly food and dry yeast for 2–3 days at room temperature (RT) or 25 °C (see Note 1 ).
-
2.
The day before the experiment, transfer the flies to a fresh vial with fly food and dry yeast, put in 29 °C incubator for 16–18 h to increase the Gal4-driven gene expression level (see Note 2 ).
3.2 Prepare Live Imaging Medium
-
1.
Aliquot 40 ml Schneider’s medium in a 50 ml tube in a cell culture hood and store at 4 °C, aliquot 10 ml FBS per 15 ml tube in a cell culture hood, and store at −20 °C (see Note 3 ).
-
2.
Make dissection medium: Warm Schneider’s medium and FBS to room temperature, calibrate pH meter, and then measure pH of the mixed medium. The desired range is 6.85–6.95. Add HCl or NaOH if pH is too high or too low (see Note 4 ).
-
3.
Filter sterilize and aliquot to 1.7 ml tubes in a cell culture hood to avoid contamination over multiple usages (see Note 5 ). Label with the date and store at 4 °C for up to 20 days.
-
4.
Prepare insulin stock solution. Make acidified water (12 μl 1 M HCl to 1 ml of H2O). Prepare 10 mg/ml insulin (5 mg powder to 500 μl acidified water). Aliquot 10 μl per 0.6 ml tube. Store at −80 °C.
-
5.
Make live imaging medium: Before dissection, add 490 μl dissection medium to 10 μl of 10 mg/ml insulin. Final concentration of insulin is 0.2 mg/ml.
3.3 Dissect Ovary and Pull out Ovarioles
-
1.
Clean up dissection bench using ethanol. Prepare wet tissue pad for disposal of fly body and unwanted ovary tissues. Fill the depression slide with dissection medium using the transfer pipette and place under a stereomicroscope.
-
2.
Anesthetize flies using CO2. Use forceps to pick up one female by its wing and hold it down in the middle of the depression well. Use one forcep to gently immobilize the body and the other forcep to pinch a small piece of abdominal cuticle and pull toward the posterior (Fig. 3a, b). The pair of ovaries should pop out (Fig. 3c, d). Discard the remaining carcass by wiping it onto the moist tissue pad. Carefully remove any undesired tissue and leave only the ovaries in the depression well. Dissect several flies until you get three to four ovary pairs (Fig. 3g, h) (see Note 6 ). Well-fattened ovaries are bigger than poorly fattened ones. A third of the ovaries should be composed of egg chamber s stage 10 or younger in well-fattened ovaries (Fig. 3g). Well-fattened ovaries should not have more than one mature egg chamber per ovariole (Fig. 3h), nor should they contain egg chambers that are degenerating.
Fig. 3 
Dissection of stage 9 egg chamber s. (a and b) Hold the fly body and pinch the abdominal cuticle. (c and d) Pull until the ovaries come out. (e and f) Pull ovarioles out of muscle sheath. Arrow points to a stage 9 egg chamber emerging from the ovary. (g) In well-fattened ovaries, the anterior 1/3 of the volume of the ovaries should be composed of young egg chambers, which are not as opaque as mature eggs (bracket). (h) Ill-fattened ovaries are usually smaller, have less early-stage egg chambers, and have more mature egg chambers sometimes in the anterior tip of the ovary (arrow). (i) Different stage egg chambers. Stage 9 is characterized by the size of the egg chamber, outer follicle cell arrangement, oocyte proportion, and the amount of yolk deposits in the germ cells. Asterisk points to an ovariole that remains in muscle sheath
-
3.
Use one pair of forceps to anchor the posterior part of the ovary where stage 10 and later egg chamber s are located, and use the other forceps to pinch the anterior tip of the ovary where the germarium and early-stage egg chambers are located. Pull very slowly and the string of egg chambers will pop out of the muscle sheath (Fig. 3e, f). Repeat this procedure one ovariole at a time (see Note 7 ). Aim for early stage 9 egg chambers (Fig. 3i). Repeat this to get 20–30 ovarioles.
-
4.
Separate ovarioles that are joined at the tip and egg chamber s older than stage 9.
-
5.
Move 20–30 desired ovarioles to one side of the slide and collect with a transfer pipette. Transfer to a 0.6 ml tube.
-
6.
Let the egg chamber s sink to the bottom, remove supernatant, and add 90 μl of live imaging medium (see Note 8 ).

3.3.1 Mount Egg Chambers
-
1.
Break a 22 × 22 mm cover slip into half using the blunt end of the forceps, and remove glass debris.
-
2.
Decide whether to mount on the inner side or bottom of the Lumox dish depending on the use of an upright or inverted microscope. Place two 5 μl drops of live imaging medium on the 50 mm Lumox dish separated by ~18 mm.
-
3.
Put a cover slip fragment on each of the two small drops with the smooth edge facing the center. Tap and nudge the cover slip until there are no air bubbles in between the dish and the cover slip. Properly space the cover slip bridge so they are 18 mm apart. Use a Kimwipe to wick away excess medium (see Note 9 ).
-
4.
Remove all but a few microliters of medium from the tube containing the egg chamber s, then add 90 μl of fresh live imaging medium, pipet up and down gently a few times, then take up the egg chambers, and expel them onto the Lumox dish in a circular motion so they are not crowded or too close to the edge.
-
5.
Use one forceps to pick up a 22 × 40 cover slip and another forceps end to guide one edge of the cover slip to line up with the bridge fragments. Slowly lower the cover slip right on top of the bridge. Gently tap the dish to let medium spread evenly between the cover slip and the membrane.
-
6.
Remove excess medium from the two sides of the bridge. Apply a thin layer of halocarbon oil and remove any excess oil with tissue paper (Fig. 4) (see Note 10 ).
Fig. 4 
Mounted egg chamber s in Lumox dish

3.4 Confocal Imaging
Potential image acquisition problems that might be encountered and their solutions are summarized in Table 2.
3.4.1 Locate Positions
-
1.
Turn on the microscope following Zeiss procedures. Log on to the computer and load the Zen software.
-
2.
Load the Lumox dish into the sample holder.
-
3.
Select configuration: “Acquisition” tab: Open acquisition configuration “Live_Pos_1.” Check “Positions” and pull up the positions list (see Note 11 ).
-
4.
Locate positions using the 10× objective lens: “Locate” tab: Use brightfield to focus, and then use GFP to find the desired egg chamber s that are intact, early stage 9, and in which border cell s are just detaching (Fig. 5). Egg chamber s should not be too close to a germarium or have residual muscle sheath attached. If the scanner head cannot be rotated, then a horizontally positioned egg chamber is preferable because it is faster to scan than a vertically positioned one. “Add” locations in the position list (see Note 12 ).
Fig. 5 
DIC images with GFP and nuclear dsRed channels superimposed. (a) Early stage 9 egg chamber with normal morphology and border cell cluster detaching. (b) Stage 9 egg chamber with slightly delayed border cell migration . Note that the outer follicle cells and the proportion of the oocyte indicate that the egg chamber is at a later stage than (a), but the border cells are less detached. In this particular example, the border cells never detached indicating abnormal development
-
5.
Fine adjust position: Change to the 20× objective. Lower the illuminator brightness at higher magnifications. “Update” positions for four to six best egg chamber s that show a clear front protrusion, which is a characteristic of normal migrating border cell cluster during early stage 9. “Save” a copy of the positions to prevent accidental deletion.
-
6.
Switch to the 40× water objective. Manually move the objective to the side to put on water or immersion fluid, rotate the objective back, and make sure that the immersion water touches the cover slip (see Note 13 ). Remove any location that moves when adjusting the focus. It is best to select egg chamber s that are relatively close to each other to avoid large stage movements between positions, which can cause the egg chambers to move and no longer be at the marked position.

3.4.2 Set Acquisition Configuration
-
1.
Modify acquisition settings: “Acquisition” tab: Move to the first position, and set scan area to “0.6” and frame size to “512 × 512.”
-
2.
Center the sample: “Live” and “Stop,” and click “Stage” to center the egg chamber .
-
3.
Define z stack: Check “Z-Stack” and select “First/Last.” “Live” and set first and last and then go to center, “Stop.” Select “Center” and set interval to “1.5” and slices to “28.” The z stack acquired will be larger than the border cell cluster to allow for movement of the cluster in the z direction over time.
-
4.
Adjust laser power and pinhole: Go to range indicator and adjust the laser power so that the signal is bright but not saturated. If the laser power is already at the upper limit for not inducing significant phototoxicity, increase the pinhole if the signal is not bright enough (see Note 14 ).
-
5.
Crop the sample: Click “Crop” and set scan area to “0.6” and frame size to “512 × 512.” Crop to select the egg chamber . “Update” position and “Save” configuration.
-
6.
Repeat for all other samples you have and save as different configurations.
3.4.3 Set Mutlitime Macro
-
1.
Select Multitime macro: A new window should pop up. Hit “refresh.”
-
2.
“Saving” tab: Enter the base file name and select folder.
-
3.
“Acquisition” tab: Choose “Scan Configuration” for each location, and check “Z Stack.”
-
4.
“Timing” tab: Enter wait interval and number of repetition.
-
5.
Check “Recipe Summary” and then go back to “Saving,” and hit “Start” and “Open Original Folder.”
-
6.
Adjust focus and field of view during the time course: Check how much you need to adjust. Wait till the wait interval countdown, “Pause,” move to the location you want to adjust, adjust z position in the “Focus” window, and adjust x y position in the “Stage” window, “Replace XYZ.” Move to the first location, “Resume.”
-
7.
“Finish” if you want to finish the time series early. “Stop” if you do not want to save the experiment.
3.5 Imaris Analysis
3.5.1 Correct Egg Chamber Drift
-
1.
OPEN raw data in Imaris and SAVE AS an “ims” file.
-
2.
Crop TIME to remove unwanted frames.
-
3.
FREE ROTATE to position egg chamber anterior to the left (Fig. 6a–d) (see Note 15 ).
Fig. 6 
Stage 9 slboGal4; UASmCD8GFP, UAS-dsRednls egg chamber s at four time points in a time-lapse series. From left to right are images showing border cell s detaching, in the first half of migration , in the second half of migration, and reaching oocyte border. (a–d) Before drift correction . (e–h) After drift correction. (i–l) Track of the border cell cluster . (m–p) Tracks of border cell nuclei
-
4.
Start the SPOTS algorithm. Select Track Spots over time.
-
5.
Select the region of interest to cover main body follicle cell nuclei with dsRed signal that you plan to use as immobile spots.
-
6.
Choose the channel for follicle cell nuclei, estimate the diameter of the nuclei, and enter a number.
-
7.
Adjust the quality filter so that the majority of the follicle cell nuclei you plan to track are detected automatically over the time course.
-
8.
Use Brownian motion as the tracking algorithm.
-
9.
The number of tracks should match the number of border cell nuclei. Finish the Spots algorithm.
-
10.
Go to the Edit Tracks tab. Each track should represent one follicle cell nuclei. Select one track at a time and go frame by frame through the movie to ensure that the spots localize to the same nuclei over each frame. Sometimes when there is a sudden drift due to change of focus or position when imaging, the tracks will be incorrect. Manually disconnect and reconnect the right spots to get the correct track.
-
11.
Correct drift and choose the “Translational and rotational drift” algorithm. Select “Include entire result” (Fig. 6e–h).

3.5.2 Track Border Cell Cluster and Nuclei
-
1.
CROP 3D to select only the egg chamber .
-
2.
Create SURFACES to track border cell cluster . (Fig. 6i–l).
-
3.
Start the SPOTS algorithm. Select Track Spots over time.
-
4.
Select the region of interest to cover the border cell migration path over the time course.
-
5.
Choose the channel for the border cell nuclei, estimate the diameter of the nuclei, and enter a number.
-
6.
Adjust the quality filter so that the majority of the border cell nuclei are detected automatically over the time course. Write down the time frames when there is a problem in nuclei detection. If the problem is that some nuclei are not detected in some time frames, try going back to step 3 and enter a smaller number for the diameter and vice versa. Adjust estimate diameter and quality filter so that most of the border cell nuclei can be detected automatically.
-
7.
Edit spots for the time frames that have problems in nuclei detection. Use ESC to switch between the viewing and editing mode. Use Shift + Left click to add or delete a spot in the editing mode.
-
8.
Use Brownian motion as the tracking algorithm.
-
9.
The number of tracks should match the number of border cell nuclei. Finish the Spots algorithm.
-
10.
Go to the Edit Tracks tab. Each track should represent one border cell nuclei at each time frame. Manually added spots will show up as a nick in the track. Select one track at a time and go frame by frame through the movie to ensure that the spots localize to the same nuclei over each frame (Fig. 6m–p).
4 Notes
-
1.
Always include a wild-type control when analyzing mutants .
-
2.
If fattening needs to be done for longer than 18 h, flip once more halfway through incubation time.
-
3.
Opened bottle of Schneider’s medium tends to have salt precipitates over time. Aliquoting reduces the chance of contamination and salt composition change due to precipitation.
-
4.
Freshly opened bottles of Schneider’s medium usually have lower pH while the pH increases upon storage. pH of mixed medium can range from 6.6 to 7.1. After adding 1 N HCl or 5 N NaOH, mix thoroughly before measuring pH again.
-
5.
To avoid contamination of the live imaging medium, these precautions should be taken: (1) Before using the cell culture hood, UV sterilize for 30 min. (2) Use sterile tips and tubes that have not been previously opened outside the hood. (3) When transferring materials to the hood, use ethanol to completely sanitize gloves and the outside of other materials. (4) Filter sterilize the medium in the cell culture hood.
-
6.
Be careful with the sharp tip of the forceps. Do not press or drop on any hard surface as it will bend the tip and render the forceps useless.
-
7.
If you pull too fast, the ovarioles will not come out of the muscle sheath, or will break off too soon. If you anchor the ovary too far at the posterior of the ovary, later stage egg chamber will also come out and will take time to separate later. When two to three ovarioles come out at once, there is usually more muscle sheath attached which should be avoided. Never touch the stage 9 egg chambers with the forceps because this will cause damage.
-
8.
Keep stage 9 intact. Do not collect debris or broken egg chamber s as they will affect the clarity of the buffer. Crowding and too many older stage chambers are undesirable as the stage 9 will not get sufficient nutrients and oxygen.
-
9.
Do not touch the Lumox membrane with sharp edges of the cover slip or forceps. If the Lumox membrane of the dish breaks, do not use.
-
10.
Avoid big bubbles in between the cover slip and membrane as they will affect the imaging. Too much medium will be bad for imaging while too little medium will be bad for the egg chamber s. Stage 9 egg chambers should be able to move slowly when the dish is tilted. Halocarbon oil prevents evaporation. Make sure that the edges are sealed completely. Do not use excess oil as it will cause sample drift. Lumox dish has a gas-permeable base to help oxygen transfer. It can be reused multiple times as long as the membrane is still intact. After the experiment, lift the cover slip carefully, wash away the oil with Windex, and rinse thoroughly in distilled water. Air-dry the membrane and keep in a clean box.
-
11.
Acquisition configuration: To increase speed: use simultaneous instead of sequential scanning of the 488 and 561 lasers, use bidirectional scanning, decrease frame size, use higher scan speed and less averaging, and crop the area of interest. To reduce phototoxicity: use sensitive detector, use lower laser power, open up pinhole, and increase gain. To improve resolution and image quality: increase frame size, reduce scan speed, and decrease gain. To monitor the morphology of the egg chamber and outer follicle cells : use T-PMT.
-
12.
To reduce bleaching, adjust brightness of the illuminator, and close the shutter when not using the eye pieces.
-
13.
Make sure not to mix different types of immersion solutions and use appropriate immersion solution for the objective.
-
14.
To test for phototoxicity, compare samples imaged and not imaged. Also the fluorescent intensity of Slbo-Gal4-driven reporters should increase over time. If signal is reduced over time then photobleaching has occurred.
-
15.
If you have a large file which takes a long time to render, choose a single time point and perform a 3D crop on this point to see if it works. If it does, then apply it to the whole image.
References
Spradling AC (1993) Developmental genetics of oogenesis. In: Martinez-Arias B (ed) The development of Drosophila melanogaster. Cold Spring Harbor Laboratory, Cold Spring Harbor, NY, pp 1–70
Montell DJ, Yoon WH, Starz-Gaiano M (2012) Group choreography: mechanisms orchestrating the collective movement of border cells. Nat Rev Mol Cell Biol 13:631–645
Prasad M, Jang AC, Starz-Gaiano M et al (2007) A protocol for culturing Drosophila melanogaster stage 9 egg chambers for live imaging. Nat Protoc 2:2467–2473
Wang X, He L, Wu YI et al (2010) Light-mediated activation reveals a key role for Rac in collective guidance of cell movement in vivo. Nat Cell Biol 12:591–597
Cai D, Chen SC, Prasad M et al (2014) Mechanical feedback through E-cadherin promotes direction sensing during collective cell migration. Cell 157:1146–1159
Rørth P, Szabo K, Bailey A et al (1998) Systematic gain-of-function genetics in Drosophila. Development 125:1049–1057
Manseau L, Baradaran A, Brower D et al (1997) GAL4 enhancer traps expressed in the embryo, larval brain, imaginal discs, and ovary of Drosophila. Dev Dyn 209:310–322
Acknowledgements
This work was supported by NIH grants R01-GM046425 and R01-GM073164 to DJM.
Author information
Authors and Affiliations
Corresponding author
Editor information
Editors and Affiliations
Rights and permissions
Copyright information
© 2016 Springer Science+Business Media New York
About this protocol
Cite this protocol
Dai, W., Montell, D.J. (2016). Live Imaging of Border Cell Migration in Drosophila . In: Jin, T., Hereld, D. (eds) Chemotaxis. Methods in Molecular Biology, vol 1407. Humana Press, New York, NY. https://doi.org/10.1007/978-1-4939-3480-5_12
Download citation
DOI: https://doi.org/10.1007/978-1-4939-3480-5_12
Published:
Publisher Name: Humana Press, New York, NY
Print ISBN: 978-1-4939-3478-2
Online ISBN: 978-1-4939-3480-5
eBook Packages: Springer Protocols