
Abstract
An important task in education field is discovering student behavioural patterns to take timely action to improve student activities or grades. Sometime students may fell into depression due to misunderstanding of subjects or due to low grade which leads into abnormal behaviour, and by identifying such abnormal behaviour, institutions can take necessary steps to improve student’s condition. For this research, questionnaire method is used which includes collecting student data through survey and analyse students’ behavioural patterns. However, results by this method are not effective or accurate as this method largely relies on feedback data. So to solve this problem, an unsupervised clustering approach can be used. This produces relatively accurate results. The proposed framework integrates two unsupervised clustering approaches, i.e. density-based spatial clustering of applications with noise (DBSCAN) and k-means. The students data is collected from Kaggle data sets. The proposed framework extracts necessary behaviour features by statistics and entropy to find both anomalous behavioural patterns and main stream patterns. To predict whether the student is low active or high active or medium active, we can use supervised techniques as unsupervised clustering approaches are meant to form clusters. These findings can help students to improve their grades and personality and organization can also take appropriate steps to help students by providing better services and administrations such as psychological consultations and academic advices.
Access provided by Autonomous University of Puebla. Download conference paper PDF
Keywords
1 Introduction
Educational organizations should understand behavioural patterns of students and should take best steps to improve students’ behaviour. For example, finding correlation between student behaviours and their academic performance [1,2,3,4]. First, correlation between sleeping habits and academic performance. According to the recent research by Arne H. Eliasson, Christopher J. Lettier and Arn. H. Eliason, student performance is effected by total sleep time of students. A questionnaire is conducted in October 2007 which includes questions related to study habits, number of sleeping hours, academic performance and reasons for wakefulness. As it is observed that there is no significance difference in total time of sleep of both low-graded and high-graded students, it is concluded that sleeping times and wakefulness are more closely correlated to academic performance of students than total time of sleep of students. Second, correlation between eating behaviour and academic performance. This research was performed by M. Valladares, E. Duran and colleagues in Chile. These requested their students to fill the survey which provides them data about students’ eating behaviour and academic performance. Three-factor questionnaire is used to evaluate eating behaviour, and grade point average (GPA) is used to measure academic performance. They concluded that there is a positive correlation between women’s eating behaviour and academic performance than men. Third, students’ course performance in a massive open online course (MOOC). MOOCs in curriculum are developed by a team of doctoral students with mentorship from two professors. They offered two MOOCs, powerful tools for teaching and learning: Digital story telling MOOC and powerful tools for teaching and learning: Web 2. 0 tools on Coursera platform. This paper reports that students whose engagement is actively high in MOOCs performed better in their academics than the students who did not participate. Lastly, correlation between procrastination behaviour of students and their academic performance. Research on this was done by D. Hooshyar, M. Pedaste and Y. Yang. They used linear support vector machine classifier to classify the students based on their amount of procrastination. It is concluded that the students who procrastinate more had low academic performance than the students who procrastinates their work less.
Most researchers used a questionnaire method to complete these studies (correlation between students’ behaviour patterns and their academic performances). As a part of questionnaire, they collected specific students data from specific universities with specific features. However, this method of collecting student data has some consequences which may lead to false predictions of students category identification. First, as surveys are conducted on a scheduled day, i.e. either one per academic year or semester, it is not possible to collect students’ current data in timely manner. If the anomalous behavioural patterns of students are not detected timely, it may lead to serious consequences [5,6,7] such as early dropouts of students. Second, false information can be provided during survey like students with anomalous behaviour may give normal answers to the questions in survey which make them appear as mainstream students and mainstream students may not fill the survey carefully due to their personal problems or any other reasons. This leads to false conclusions and bias the analysis results. Third, to analyse students’ behavioural patterns, rich expert knowledge is required to prepare questionnaire that can collect enough and correct information about student’s behaviour. These consequences make the questionnaire method unreliable and uneffective.
Machine learning techniques can give accurate results than questionnaire method. Machine learning approaches are categorized as supervised, semi-supervised and unsupervised methods. Supervised learning is an approach, where an input data that has been labelled for particular output is trained. Model is trained until relationships between input data and output labels are detected to determine which class a never-before-seen student belongs to. Semi-supervised learning is an approach in which training data consists of small amount of labelled data and large amounts of unlabelled data. Unsupervised learning is used to clusters the data of students. As students behaviour keeps evolving, model must be updated timely which may not be possible using supervised and semi-supervised so unsupervised approaches are used widely in practical applications.
The rest of this paper is organized as follows: in Sect. 2, we discussed the proposed clustering framework. We then describe the algorithms we used in the proposed work in Sect. 3. Next, we describe the experimental results Sect. 4. Finally, we conclude our work and propose future work in Sect. 5.
2 Framework of Study
See Fig. 1.

Framework
2.1 Data Set Collection
Data set we used here is taken from Kaggle website. We used xAPI-Edu-Data. csv. This data set consists of 480 samples and 17 features. Gender, Nationality, Place of Birth, stageId, GradeId, SectionId, Topic, Semester, Relation, raised hands, VisITed Resources, Announcements View, Discussion, Parent Answering Survey, Parent school Satisfaction, Student Absence Days, Class. Below screen is showing records of student performance data set (Fig. 2).

Screen shot of code which is displaying features in taken data set
2.2 Feature Extraction
In above data set, some columns contain non-numeric values and clustering algorithm will not take non-numeric values so we will be applying reprocessing technique to convert non-numeric values to numeric by replacing MALE with 0 and FEMALE with 1 in gender column. Data set contains 17 columns and all columns are not important so we apply principal component analysis (PCA) algorithm which calculate importance of each features and select only those important features, and by applying this algorithm, we are selecting best 4 features from data set. Those 4 features are raised hands, VisITed Resources, Announcements, Discussions.
As shown in framework in this proposed work, we used statistics, entropy, variance and Pearson correlation to extract features. Statistics are categorized into central tendency which includes mean, mode, median and dispersion which includes variance and standard deviation. Entropy is used to measure the randomness in the information provided in data set. Entropy can be calculated by the formula.
where p(i) indicates probability of ith behaviour event. Higher the entropy, it is difficult to draw conclusions from the provided data, for example: flipping a coin. Select high variance features and remove reductant, small variance features. To find how two features are correlated, we used Pearson correlation coefficient. Value of Pearson correlation coefficient is generally represented by ‘r’. value of ‘r’ ranges from −1 to 1. If r = 0, it indicates there is no relation between those features. If r > 0, then the two features have positive relationship. If r < 0, they have negative relationship, i.e. their values are inversely proportional (Fig. 3).

Graph showing the behaviour of Pearson correlation
2.3 Clustering Analysis
Density-based spatial clustering of applications with noise (DBSCAN) [8] and k-means are two unsupervised approaches which are used efficiently in daily applications. In initial step, DBSCAN is applied on data set to get clusters. Anomalous behaviour students go to noise clusters, and main stream students go to normal clusters. As the mainstream students cluster size is large, they may further contain anomalous behaviour students; so by applying k-means clustering, the single normal cluster can be reduced to small sized multiple clusters. The cluster with least size is considered as anomalous behavioural students records.
2.4 Prediction
To predict the class of never-before-seen student, we trained the data by using supervised approach. This takes four features, namely raised hands, VisITed Resources, Announcements, Discussions and predict the class of student, i.e. whether that particular student belong to low active or medium active or high active. As accuracy of random forest algorithm is more when compared to other supervised algorithms, random forest algorithm is used to predict the never-before-seen student’s class (Fig. 4).

Graph showing accuracy of various supervised algorithms
2.5 Visualization
The clusters formed by DBSCAN and k-means are visualized so that anyone can easily differentiate the students class.
3 Algorithms
3.1 Initial Clustering Using Density-Based Spatial Clustering of Application with Noise(DBSCAN)
DBSCAN is one of the unsupervised approaches that is used widely in daily applications. Unlike others, it deals with noise data. Irrelevant data that effects data analysis significantly is termed as noise data. DBSCAN algorithm automatically filters noise and outliers. It requires two parameters eps and minPts. Eps defines the neighbourhood of a given radius, and minPts defines minimum number of samples that every cluster should contain. MinPts must be greater than or equal to number of dimensions in data set to get accurate results. Based on the values of minPts and eps, the data points are categorized into three types core, border and noise.
3.2 Subdivision Clustering Using K-Means
K-means is used to subdivide the data set into k number of clusters. So it acts as complement to DBSCAN. To determine the value of k, the elbow method is used. Elbow method uses within cluster sum of square (wcss) for each k value. Wcss is also known as k_inertia. Plots a graph between wcss and k-means, the bend point which looks like arm is considered as optimal value of k (Fig. 5).

Elbow method graph to calculate accurate K value
3.3 Random Forest Algorithm
Random forest is popular supervised approach which used effectively to predict the class of never-before-seen data. Rather than relying on single decision tree, it takes prediction from multiple decision trees, based on majority votes it predicts the final output (Fig. 6).

Random forest algorithm
4 Experimental Results
We used Python language to implement machine learning models. We followed steps given below.
-
(1)
We uploaded data set which is available in Kaggle (Fig. 7).
Fig. 7 
Screenshot of code in which data set is uploading

-
(2)
Feature extraction is done by using entropy, Pearson correlation coefficient and variance.
-
(3)
Clustering analysis (Fig. 8).
Fig. 8 
K-means graph

-
As we discussed earlier about elbow method by which we got optimal value of k as 3 so by applying k-means 3, clusters are formed. WCSS (inertia) is the distance between data point and centroid (Fig. 9).
Fig. 9 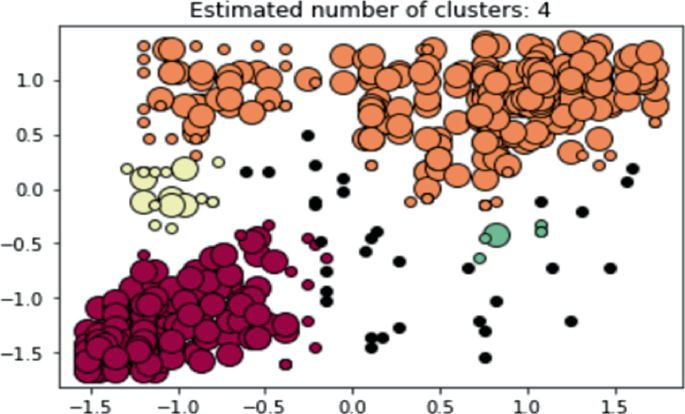
DBSCAN graph

-
The above is the visualization of DBSCAN. Black coloured data points are the anomalous students records
-
(4)
Prediction (Fig. 10).
Fig. 10 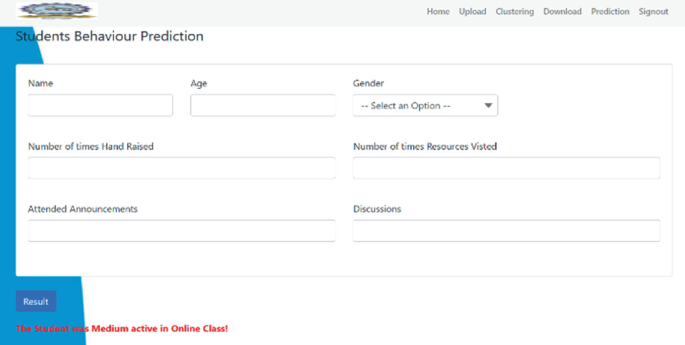
Prediction screen

By taking the student details, it provides us the information about the student’s class whether he belong to low active or high active or medium active class.
5 Conclusions
This paper proposed an ensemble unsupervised approach for analysis of students’ behaviour patterns and a supervised approach to predict the class of never-before-seen student’s class. We extracted four features from the data set we collected from Kaggle. This proposed work can detect both anomalous and mainstream students records. Based on the clustering analysis results, the educational organizations and management can take necessary measure to improve students grade and personality. For better clustering analysis, future work should include the following (1) Extract more meaningful multisource behavioural data. (2) For high-dimensional feature spaces design, a new distance measures to make proposed work more effective. (3) Study the relationship between students’ academic performance, psychological state and employment domain.
References
Eliasson AH, Lettieri CJ, Eliasson AH (2010) Early to bed, early to rise! Sleep habits and academic performance in college students. Sleep Breathing 14(1):71–75. https://doi.org/10.1007/s11325-009-0282-2
Valladares M, Duran E, Matheus A, Duran-Agueero S, Obregon AM, Ramirez-Tagle R (2016) Association between eating behavior and academic performance in university students. J Amer College Nutrition 35(8):699–703. https://doi.org/10.1080/07315724.2016.1157526
Phan T, McNeil SG, Robin BR (2016) ‘Students’ patterns of engagement and course performance in a massive open online course. Comput Edu 95:36–44. https://doi.org/10.1016/j.compedu.2015.11.015
Hooshyar D, Pedaste M, Yang Y (2019) ‘Mining educational data to predict Students’ performance through procrastination behavior. Entropy 22(1):12. https://doi.org/10.3390/e22010012
Iam-On N, Boongoen T (2017) Improved student dropout prediction in Thai university using ensemble of mixed-type data clusterings. Int J Mach Learn Cybern 8(2):497–510. https://doi.org/10.1007/s13042-015-0341-x
Harwati I, Virdyanawaty R, Mansur A (2015) Drop out estimation students based on the study period: comparison between naive Bayes and support vector machines algorithm methods. In: Proceeding ICET4SD. Yogyakarta, IN, USA
Aparicio-Chueca P, Maestro-Yarza I, Domínguez-Amorós M (2016) Academic profile of students who drop out a degree. A case study of faculty of economics and business, UB. In: Proceeding EDULEARN. Barcelona, Spain
Ester M, Kriegel H, Sander J, Xu X (1996) A density-based algorithm for discovering clusters in large spatial databases with noise. In: Proceeding 2nd international conference knowledge discover data mining, pp 226–231
Author information
Authors and Affiliations
Corresponding author
Editor information
Editors and Affiliations
Rights and permissions
Copyright information
© 2023 The Author(s), under exclusive license to Springer Nature Singapore Pte Ltd.
About this paper

Cite this paper
Krishna Rao, L.V., Gowthami, B.V., Hema, B., Sai Saketh, A., Narendra Babu, G. (2023). Analysis of Student Behavioural Patterns by Machine Learning. In: Fong, S., Dey, N., Joshi, A. (eds) ICT Analysis and Applications. Lecture Notes in Networks and Systems, vol 517. Springer, Singapore. https://doi.org/10.1007/978-981-19-5224-1_7
Download citation
DOI: https://doi.org/10.1007/978-981-19-5224-1_7
Published:
Publisher Name: Springer, Singapore
Print ISBN: 978-981-19-5223-4
Online ISBN: 978-981-19-5224-1
eBook Packages: EngineeringEngineering (R0)