
Abstract
The construction of global high-precision atmospheric delay model is the key and bottleneck problem for global PPP-RTK applications. In order to overcome the problems of large-scale construction of ground stations as well as difficulties in building stations at sea, a global PPP-RTK method based on GRO (GNSS Radio Occultation) and LRO (LEO Radio Occultation) is proposed. Firstly, the mathematical model of occultation events is studied, and then the number distribution and spatio-temporal resolution of GRO and LRO events are analyzed. The proposed LEO constellation can cover the area of 60°S–60°N in real time with the spatio-temporal resolution for GRO and LRO occultation events, and finally the PPP-RTK positioning is verified based on the atmospheric delay model of GRO and LRO, GNSS and GNSS+LEO convergence time are reduced by 58% and 46%, respectively compared with the PPP positioning.
Access provided by Autonomous University of Puebla. Download conference paper PDF
Keywords
1 Introduction
The new generation of intelligent technology and industrial revolution characterized by “unmanned, intelligent, and connected” has driven significant changes in the users and demand for GNSS high-precision services. As a typical representative of the emerging users, the users and market scale of autonomous driving are growing rapidly. Since GNSS can provide absolute location information, it is an indispensable technology to realize fully autonomous driving. Fully autonomous driving requires GNSS high-precision services that converges to a horizontal accuracy of 0.1 m (95%) within seconds, and even convergence times of thirty or forty seconds are intolerable [1]. Therefore, a large number of users and the market urgently need rapid convergence GNSS high-precision services.
Among the current GNSS high-precision services, PPP (Precise Point Positioning) can meet the accuracy requirements but the convergence time is as long as one or twenty minutes [2, 3], while the convergence time is also around one minute when using LEO satellites to broadcast signals for augmentation [4, 5]. In contrast, RTK (Real-time Kinematic) is able to meet the accuracy and convergence time requirements, but its coverage is small [6]. Therefore, PPP-RTK, which combines the advantages of both PPP and RTK technologies, is the current research focus and development trend in the field of GNSS high accuracy and has a very large application potential and market in the field of real-time dynamics [7]. The basic concept of PPP-RTK is using the data from regional Continuously Operating Reference Stations (CORS) to refine the solution of parameters such as UPD (Uncalibrated Phase Delay) and atmospheric delay, while modeling and broadcasting these errors to the user to achieve real-time dynamic positioning based on the PPP model. For PPP-RTK services, a highly accurate atmospheric delay model is the key to achieve rapid convergence positioning [8].
At present, the global PPP-RTK method is still in the initial stage of research, and the atmospheric delay model cannot meet the global coverage and high accuracy at the same time. The main reasons are: if a dense CORS network is deployed globally to achieve global high-precision atmospheric delay modeling, the cost is too huge and the construction period is too long, meanwhile it is very difficult to build stations in the ocean area, so the current PPP-RTK service can only be applied to regions; if the PPP-RTK application range is extended, the existing global troposphere and ionosphere models cannot achieve global fast convergence PPP-RTK service due to the accuracy and update frequency limitations. Therefore, how to achieve high accuracy atmospheric modeling with global coverage and low cost is the core problem that global PPP-RTK methods need to break through urgently.
In summary, a global PPP-RTK method based on GRO (GNSS Radio Occultation) and LRO (LEO Radio Occultation) is proposed. Firstly, the mathematical model of occultation events is analyzed, then the number distribution, spatio-temporal resolution of GRO and LRO events are summarized, and finally the positioning accuracy and convergence time of PPP-RTK are verified based on the atmospheric delay model of GRO and LRO. It provides a reference for the feasibility of subsequent occultation data for precision positioning.
2 Mathematical Model for Occultation Events
Radio Occultation (RO) technology was first used for atmospheric exploration of solar system planets, and later, with the development of GNSS, GNSS-based RO (GRO) technology has made great progress and launched many RO satellites, including COSMIC, Feng Yun 3C, etc. The vertical distribution of ionosphere and neutral atmosphere can be inverted by GRO, where it is widely used in military weather assurance, ionospheric modeling, space weather and climate research, earthquake detection and other fields [9]. And then LEO satellite radio occultation (LRO) was proposed by many scholars and national space missions. With the features of global coverage, all-weather and high vertical resolution, Satellite-based RO can effectively compensate the deficiency of ground-based RO and obtain atmospheric delay information with global coverage [10, 11].
The signals transmitted by GNSS or LEO satellites pass through the Earth’s atmosphere and are detected by the LEO satellites receivers. An occultation event occurs when the relative motion of the transmitting signal satellite and the receiving satellite achieves a scanning observation of the atmosphere (top-down or bottom-up) (as shown in Fig. 1) [11].
In order to improve the simulation efficiency, the 3D ray tracing method used for occultation data inversion is simplified, and the mathematical model of occultation events occurring in GNSS or LEO is reduced to the following two determination bases.

GNSS and LEO satellites RO events
-
(1)
Let \(\delta_{\min }\) be the angle between the line of the receiving satellite and the geocenter and the tangent line where between the receiving satellite and the Earth’s surface. Let \(\delta_{{{\text{m}} {\text{ax}}}}\) be the angle between the line of the receiving satellite and the geocenter and the tangent line where between the receiving satellite and the top of the atmosphere. Let the angle between the line of the receiving satellite and the transmitting satellite and the line of the receiving satellite and the geocenter be \(\delta\), and \(\delta_{\min } \le \delta \le \delta_{\max }\) when an occultation event occurs (as shown in Fig. 2).
Fig. 2. 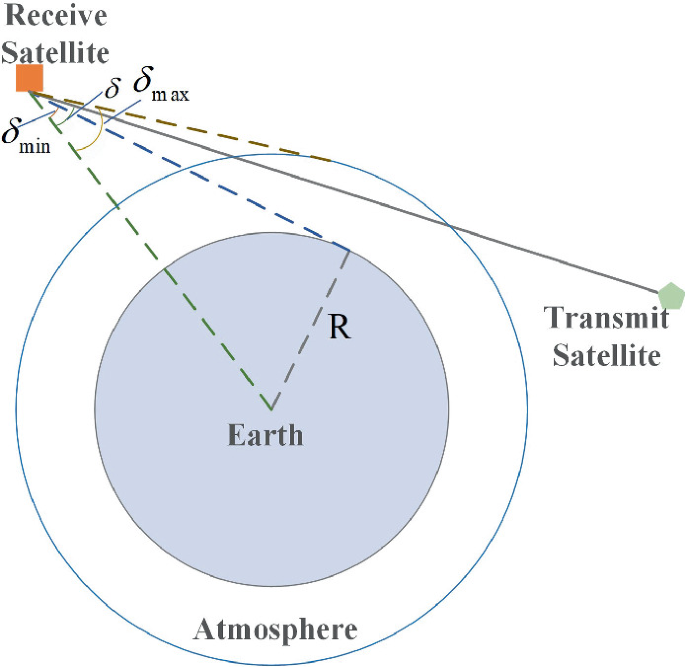
Mathematical model for occultation event determination
-
(2)
Let \(\lambda\) be the arrival angle from the transmitting signal to the receiving satellite, and if the signal from the transmitting satellite needs to be received, then \(\lambda \le \lambda_{Ant}\) must be satisfied, where \(\lambda_{Ant}\) denotes the field of view of the receiving satellite antenna, and the horizontal and pitch angles of the field of view of the occultation antenna can be set according to the corresponding antenna.

When the GNSS or LEO occultation satisfies the above conditions, the occultation event can be judged, and the latitude, longitude and altitude range of the corresponding tangent point can be calculated based on the corresponding orbits of the transmitting and receiving satellites, so that the occultation event can be counted and analyzed.
3 GRO and LRO Event Analysis
3.1 GRO and LRO Event Models
Unlike GRO, which navigation signals broadcasted by GNSS satellites was directly used, LRO requires LEO satellites to be able to transmitting signals, which undoubtedly increases the cost of LRO. However, with the rapid development of commercial space NEW SPACE and various LEO satellite constellations in recent years, the number of LEO satellites has shown an explosive growth, especially with the development of LEO navigation augmentation constellations and LEO Internet constellations [12,13,14], and LRO has also entered a rapid development phase.
Using the satellite model in patent [15], it is first assumed that GNSS satellites broadcast navigation signals, LEO satellites have the ability to transmit and receive navigation signals (without considering the problem of transceiver isolation), and LEO satellites can either transmit GNSS-like navigation signals as well as receive navigation signals broadcast by GNSS or LEO satellites. Figure 3 provides a detailed comparison and analysis of the similarities and differences between GRO and LRO. Satellites 1, 2, and 3 are located in low orbits and GNSS satellites are located in medium orbits, and the times in Fig. 3(a) (b) are kept consistent and \(t_{1} = t_{0} + \Delta t\), set \(\Delta t\) to 1 min.
At time \(t_{0}\) (shown in blue): The GRO event shown in Fig. 3(a), satellite 1 and satellite 2 are able to receive GNSS navigation signals that pass through the atmosphere, and the atmospheric information can be obtained by inversion; satellite 3 is within the line of sight of GNSS satellites, but it is omitted because its signals do not pass through the atmosphere; The LRO event shown in Fig. 3(b), the three LEO satellites are visible to each other while the signals pass through the atmosphere, generating the occultation data, which are drawn as two-way arrows because the satellites have transmitting and receiving capabilities.
At time t1 (shown in red): The GRO event shown in Fig. 3(a), since the MEO satellite orbital period is about 12 h, its position did not change significantly during the time set, and satellite 1, although within the line of sight of the GNSS satellite, did not produce valid data because the GNSS signal did not pass through the atmosphere, and only satellite 2 produced occultation data; The LRO event shown in Fig. 3(b), the three satellites, although the satellite position changed, again maintained the visual relationship, and the signal passed through different positions in the atmosphere, providing new occultation data.
As it can be seen from the occultation event model above, since the orbital period of GNSS satellites is much larger than that of LEO satellites, the frequency and number of GRO events will be less than the number of LRO events, so is it possible to achieve real-time modeling of the global atmosphere using only LRO events? It is further analyzed below.

Comparison between GRO and LRO
3.2 GRO and LRO Events Simulation
A corresponding simulation scenario is built to further illustrate the GRO and LRO events. GNS S consists of satellites that are currently in orbit and providing effective services for GPS, Beidou-3, and Galileo, and the orbital parameters of the satellites are obtained through TLE (Two-Line Element). The LEO navigation augmentation constellation consists of three LEO sub-constellations with different inclination angles.
Table 1 shows the constellation parameters of the simulation scenario, and Fig. 4 shows the GNSS and LEO navigation augmentation constellations, respectively. In the above simulation scenario, the same satellite model as in the previous section is used, while the half-power angle of the LEO satellite occultation receiver antenna is set to 10° in the pitch direction and 60° in the horizontal direction.
Figure 5 shows the global location distribution of GRO and LRO events within 5 min, in which more than 4000 GRO events and more than 9000 LRO events occurred within 5 min. Due to the high density of the LEO satellite constellation, the number of GRO and LRO events is numerous, and the projection of GRO and LRO events corresponding to the Earth basically achieves global coverage.
Figure 6 shows the latitude distribution of GRO and LRO events within 5 min. Since the LEO navigation augmentation constellation mainly takes into account the navigation augmentation performance in densely populated areas, the GRO and LRO events based on this constellation are mainly distributed between latitudes 60°S–60°N. At the same time, due to the LEO satellites orbit altitude and fast speed, the change between the transmitting and receiving satellites is faster, and the distribution of LRO is not as uniform as GRO in that time period.
In summary, the orbital period of MEO satellites is around 12 h, which limits the rate of change of the observation vector, while the orbital period of LEO satellites is around 90 min, so the spatio-temporal resolution of GRO monitoring of the atmosphere is not as much as that of LRO. However, the distribution of LRO events in a short period of time is not as uniform as that of GRO, while the number of GRO events grows rapidly when the number of LEO satellite constellations increases to a certain level. Therefore, it is not ideal to rely on GRO or LRO alone to achieve atmospheric exploration, and in order to improve the efficiency of occultation exploration, GRO and LRO need to be combined to achieve real-time exploration of the earth atmosphere.

GNSS and LEO constellation in the simulation scenario

Global distribution of GRO and LRO events within 5 min

Latitude statistics of GRO and LRO events within 5 min
3.3 Spatio-Temporal of GRO and LRO Events
As can be seen from the above event model and simulation scenario, the GRO and LRO, which were generated by the higher density LEO satellite constellation, can basically provide real-time atmospheric analysis imaging.
In order to measure the uniformity and real-time of the combined GRO and LRO exploration, the globe is gridded with a spatial spacing of 1°, 2°, and 3° in latitude and longitude, respectively, and a certain time period as the time interval, and the corresponding gridded network is generated. If the projection of the occultation event in that time interval is within the grid, then the grid is considered to have achieved coverage.
The following Fig. 7 show the distribution of global GRO and LRO occultation events when the spatio-temporal resolutions are \(1^{ \circ } \times 1^{ \circ } \times 15\min {\text{s}}\), \(2^{ \circ } \times 2^{ \circ } \times 15\min {\text{s}}\), and \(3^{ \circ } \times 3^{ \circ } \times 15\min {\text{s}}\), respectively. The color indicates the number of events, and the black indicates that the number of occultation times is 0, where no coverage is achieved. It can be seen that within 15 min, the temporal resolution of \(1^{ \circ } \times 1^{ \circ }\) and \(2^{ \circ } \times 2^{ \circ }\) does not achieve global coverage, and the spatial resolution of \(3^{ \circ } \times 3^{ \circ }\) basically achieves full coverage in 60°S–60°N, which is also the region of population concentration.

Global distribution of the number of occultation events at different spatial resolutions
Figure 8(a) shows the coverage of GRO and LRO events at different spatial resolutions in the global range with temporal resolutions from 5 min to 60 min. As the temporal resolution decreases, the coverage of \(2^{ \circ } \times 2^{ \circ }\) and \(3^{ \circ } \times 3^{ \circ }\) occultation events tend to be the same, and the global lack of coverage is mainly concentrated in the north and south poles. Figure 8(b) shows the coverage rates at different spatio-temporal resolutions in the range of 60°S–60°N. At the 15-min temporal resolution, the \(3^{ \circ } \times 3^{ \circ }\) spatial coverage rate is 96.1%, which basically achieves the coverage within the region, while at the 1-h resolution, with \(2^{ \circ } \times 2^{ \circ }\) and \(3^{ \circ } \times 3^{ \circ }\) both achieve 100% coverage of the region.
From the above analysis, it can be seen that the GRO and LRO occultation events in the simulation scenario can basically achieve real-time coverage in the range of 60°S–60°N. The atmospheric delay information in the vertical direction of the corresponding tangent point can be obtained through the inversion calculation, so that a high-precision atmospheric delay model with corresponding s spatio-temporal resolution can be obtained.

Occultation event coverage at different spatio-temporal resolutions
4 PPP-RTK Based on GRO and LRO Atmosphere Inversion
To simplify the simulation process, it is assumed that the atmospheric delay at the tangent point of the occultation event has been calculated by Abel integration and related inversion methods. It is also assumed that the corresponding precision orbit and clock, UPD (Uncalibrated Phase Delay), have been obtained from space-based monitoring of LEO satellites, and these augmentation information are coupled with the atmospheric delays obtained by inversion with sufficient internal consistency to eliminate errors and recover the integer properties of the ambiguity.
In the previous section, the GRO and LRO occultation events are able to cover the range of 60°S–60°N in real time at a spatio-temporal resolution of \(3^{ \circ } \times 3^{ \circ } \times 15\min {\text{s}}\). The following simulation of PPP-RTK positioning is performed at this spatial and temporal resolution. The stations shown in Fig. 9 are selected, the triangles represent user stations, and the dots are known stations. It is assumed that the dot station is the location where the occultation event occurred, and the atmospheric delay update period is 15 min.
The ionospheric and tropospheric delays of the user station are first obtained using the inverse distance-weighted interpolation method.
\(\omega_{n}\) in the above equation is shown in the following equation.
\(\varphi_{n}\), \(\lambda_{n}\) denotes the latitude and longitude where the occultation event occurred, and \(\varphi_{m}\), \(\lambda_{m}\) denotes the latitude and longitude corresponding to the user station. The ionospheric oblique delay of each satellite is calculated by the projection function.

Distribution of stations used for PPP-RTK verification
The constellations shown in Table 1 were used, and Fig. 10 shows the positioning results of user PPP and PPP-RTK at a certain time (the results of PPP on the left and PPP-RTK on the right). Figure 10(a) shows the positioning results using GNSS only, and user PPP-RTK achieves convergence in more than 40 s, while PPP takes about 5 min. Figure 10(b) shows the results of positioning using GNSS+LEO satellites, where the user PPP-RTK positioning achieves convergence in 10 s, while PPP takes 40 s.

PPP and PPP-RTK positioning results for a certain time period at the user station
In order to further analyze the speed of user PPP-RTK positioning convergence at this temporal resolution, 6 h of data were selected while dividing it into small 5-min data segments, and the PPP and PPP-RTK convergence times for each segment were counted, and Fig. 11 shows the proportion of data segments with PPP-RTK positioning convergence to all data segments at each time point. It can be seen that due to the time resolution of about 15 min, the lag of the atmospheric delay model in some time segments causes the accelerated convergence of the atmospheric model is not obvious, but overall it is able to shorten the convergence time of users, 69% of the time segments of GNSS can achieve convergence within one minute, and 88% of the time segments of GNSS and LEO can achieve convergence within 30 s. Compared to PPP positioning, the convergence time is reduced by 58% for GNSS and 46% for GNSS+LEO.

PPP-RTK positioning convergence ratio statistics
5 Summary
A global PPP-RTK method based on GRO and LRO is proposed, and the following conclusions are drawn through relevant studies.
-
(1)
The speed of LEO satellites is much larger than that of GNSS satellites, so the frequency and number of LRO events are greater than those of GRO, but the distribution of LRO events in a short period of time is not as uniform as that of GRO. In order to improve the efficiency of occultation exploration, it is suggested to combine GRO and LRO to achieve real-time exploration of the Earth’s atmosphere.
-
(2)
When the density of the LEO satellite constellation is high (more than 200 satellites), the corresponding projection of LRO and GRO events can basically achieve real-time global coverage, and the LEO satellite constellation in this paper can achieve real-time coverage of occultation events in the range of 60°S–60°N with the resolution of the LRO.
-
(3)
Using the atmospheric delay models generated based on GRO and LRO, the convergence times of GNSS and GNSS+LEO positioning are reduced by 58% and 46%, respectively, compared with those of PPP at the spatial and temporal resolutions.
The method proposed in this paper has some reference significance for the application and development of occultation and PPP-RTK techniques.
References
Reid, T.G.R., Chan, B., Goel, A., et al.: Satellite navigation for the age of autonomy. In: 2020 IEEE/ION Position, Location and Navigation Symposium (PLANS), pp. 342–352. IEEE, Portland (2020)
Li, X., Li, X., Yuan, Y., et al.: Multi-GNSS phase delay estimation and PPP ambiguity resolution: GPS, BDS, GLONASS, Galileo. J. Geodesy 92(6), 579–608 (2017)
Jin, S., Su, K.: PPP models and performances from single- to quad-frequency BDS observations. Satell. Navig. 1(1), 1–13 (2020). https://doi.org/10.1186/s43020-020-00014-y
Reid, T.G.R., Gunning, K., Perkins, A., et al.: Going back for the future: large/mega LEO constellations for navigation. In: Proceedings of the 32nd International Technical Meeting of the Satellite Division of The Institute of Navigation (ION GNSS+ 2019), pp. 2452–2468 (2019)
Reid, T.G.R., Walter, T., Enge, P.K., et al.: Navigation from low earth orbit: part 1: concept, current capability, and future promise. In: Position, Navigation, and Timing Technologies in the 21st Century: Integrated Satellite Navigation, Sensor Systems, and Civil Applications, pp. 1359–1379 (2020)
Laurichesse, D., Mercier, F., Berthias, J.P., et al.: Real time zero-difference ambiguities fixing and absolute RTK. In: Proceedings of the 2008 National Technical Meeting of The Institute of Navigation (2008)
Zhang, X., Hu, J., Ren, X.: New progress of PPP/PPP-RTK and positioning performance comparison of BDS/GNSS PPP. Acta Geodaetica et Cartographica Sinica, 49(9), 1084–1100 (2020). (ch)
Wübbena, G., Schmitz, M., Bagge, A.: PPP-RTK: precise point positioning using state-space representation in RTK networks. In: Proceedings of the 18th International Technical Meeting of the Satellite Division of the Institute of Navigation (ION GNSS 2005), pp. 13–16. Long Beach Convention Center, Long Beach, CA (2005)
Liu, J., Zhao, Y., Zhang, X.: Current situation and expectation of inversion of ionospheric GNSS occultation. Geomat. Inf. Sci. Wuhan Univ. 35(6), 631–635 (2010). (ch)
Wang, S., et al.: Simulation study on GRO and LRO events. Chin. J. Space Sci., 37(2), 207–213 (2017). (ch)
Liang, B., Wang, J., Li, C., Wei, S.: Design of multi GNSS occultation sounding satellite constellation. J. Astronaut. 37(3), 334–340 (2016). (ch)
Pfandzelter, T., Hasenburg, J., Bermbach, D.: Towards a computing platform for the LEO edge. In: Proceedings of the 4th International Workshop on Edge Systems, Analytics and Networking, pp. 43–48 (2021)
Neinavaie, M., Khalife, J., Kassas, Z.M.: Exploiting Starlink signals for navigation: first results. In: Proceedings of the 34th International Technical Meeting of the Satellite Division of The Institute of Navigation (ION GNSS+ 2021), pp. 2766–2773 (2021)
Li, R., Zheng, S.Y., Wang, E.S., et al.: Advances in BeiDou Navigation Satellite System (BDS) and satellite navigation augmentation technologies. Satell. Navig. 1, 12 (2020)
Reid, T.G.R., Manning, B.: Satellite for transmitting a navigation signal in a satellite constellation system: U.S. Patent Application 17/235,479[P]. 2021-8-12
Author information
Authors and Affiliations
Corresponding author
Editor information
Editors and Affiliations
Rights and permissions
Copyright information
© 2022 Aerospace Information Research Institute
About this paper

Cite this paper
Tian, Y., Wang, W., Bian, L., Meng, Y., Zhang, L. (2022). Global PPP-RTK Method Based on GRO and LRO. In: Yang, C., Xie, J. (eds) China Satellite Navigation Conference (CSNC 2022) Proceedings. Lecture Notes in Electrical Engineering, vol 910. Springer, Singapore. https://doi.org/10.1007/978-981-19-2576-4_16
Download citation
DOI: https://doi.org/10.1007/978-981-19-2576-4_16
Published:
Publisher Name: Springer, Singapore
Print ISBN: 978-981-19-2575-7
Online ISBN: 978-981-19-2576-4
eBook Packages: EngineeringEngineering (R0)