
Abstract
Data display resources are interfaces designed for the accessing of data that can be useful for learners in their learning activities. Such resources are best designed to allow learners to use simulated tools to collect some data, and engage in the processes of data organization and analysis in search for patterns, understandings and generalizations that can be applied in their decision making with a learning activity.
Access provided by CONRICYT-eBooks. Download chapter PDF
Keywords
These keywords were added by machine and not by the authors. This process is experimental and the keywords may be updated as the learning algorithm improves.
FormalPara Learning Outcomes:-
Describe what is a data display resource;
-
Discuss differences between information and data displays, and data displays and conceptual resources;
-
Identify data display resources; and
-
Design data display resources.
6.1 What Is a Data Display Resource?
Data display resources are interfaces designed for the accessing of data that can be useful for learners in their learning activities. Such resources are best designed to allow learners to use simulated tools to collect some data, and engage in the processes of data organization and analysis in search for patterns, understandings and generalizations that can be applied in their decision making with a learning activity.
In addition to information (facts and declarative knowledge) and concepts (conceptual knowledge) through the process of working on learning activities, learners can collect and work with data. An effectively designed leaning activity might require learners to engage in the procedure of collecting, organizing, analysing and decision-making based on data. Results of this procedure can further lead to generalizations and abstractions, and subsequent knowledge uses, while the process of working with data can support the development of new literacies. Therefore, these kinds of digital resources for learning target development of procedural knowledge of disciplinary in a specific way in dealing with data in the context of activities such as research and problem solving.
It is important to understand the differences between data and information in the context of this book. Data are unprocessed, disorganized and fragmented measurements, facts, observations and statements collected from an environment, people, or generated by natural or artificial systems. On the other side, information is processed and organized data presented in a form that can be communicated and used directly. An important part of a learning activity should be to engage learners to conduct research, work with data and create information, most desirably, by using digital representational technology to process and organize data in useful formats. In our approach in this book, information useful for learning activities is presented via information display resources, while data are presented via data display resources. A data display resource allows a learner to collect, organize, analyse and use data in decision-making within a learning activity. When data are organized, and presented in a representation (e.g., pie chart, table or a country data on a map), then, that is information rather that a data display resource. However, the most important difference between information and a data display is that in a data display resource, learners are engaged in collecting and working with raw data. Sometimes, specific tools are required to accomplish data collection, while analytical tools are most often deployed within a learning activity.
Important
The design of resources for mobile technology application needs to pay attention to issues including, at least, the design for presentation via small screens and the design for mobile learning uses.
Direct instruction, that is, teaching-centred practice, leads teachers to take ‘shortcuts’, giving ready-made answers and information to learners, and expecting them to remember facts, declarative knowledge and drilled-down procedures. Although, to a certain extent, this might prepare learners for examinations, this does not give full attention to their intellectual development and deep knowledge within disciplines (e.g., concept knowledge). It is important that shortcuts are not taken in contemporary education, and that learners are provided with educational experiences which bring to them an opportunity to use tools, struggle with complexities, think and innovate within and across disciplines. At the same time, students should be given opportunities to develop new literacies (e.g., digital literacy) required by contemporary living, learning, working, and socializing. Engaging students to collect and work with data, conduct analysis, generalize, abstract and use their knowledge to solve problems, will promote these essentials of modern day teaching and learning. Furthermore, working with data, especially in digital formats, will promote the development of aspects of new literacies. We live in the time of ‘Big Data’ and developing literacies are essential to working with data and make sense of them, is an important task for education today.
Activity 6.1
Look at the data displayed at the “Weather Underground” at the https://www.wunderground.com/ . Explore this map and its features, such as searching for a specific location, or identifying your own location. Attend to the following questions:
-
Are there any patterns between geographical locations and weather patterns?
-
What might be the causes to the higher temperatures that this map might reveal?
-
What would be the most desirable place to leave in the world in terms of the consistently high quality of weather?
-
Compare the weather across at least five major cities in China. What can you observe?
-
What other data would be useful to have on this map?
-
Are there any design features you think could be effectively integrated in this map to make it more effective (e.g., winds, air pollution, web cams and blog data from various locations)?
Rather than providing ready-made answers, we should engage students in experiences where they arrive at these answers themselves. However, this process is not arbitrary, rather, it is carefully planned and managed by a teacher whose role in the process is that of a learning designer and a facilitator or learning. That process deploys data, information, knowledge, tools and philosophies of a specific discipline. How disciplines arrive at knowledge differs and is based on their underlining philosophical understanding of what are constituted truths, and how such truths are generated. However, without going any further into this philosophical debate, let us return to our main focus in this book and discuss data display resources.
Important
A learning activity should engage learners to conduct research, work with data and create information, most desirably, by using digital representational technology to process and organize data in useful formats. Learners should be provided with an opportunity to use tools, data, information and knowledge, struggle with complexities, and think and innovate within and across disciplines.
Data display resources are interactive and visual digital resources for learning that allow a learner to collect, access and work with data they need in order to complete their learning activities. More effective data display resources do not simply display data that we want learners to work with. These might not be just interfaces for data access and interrogation, as commonly found in tools for accessing and interrogating data (such as in the “Real-time Air Quality Index Visual Map In Task A). Rather, these might include the following features that specifically have the intension to extend learning:
-
Realistic contexts where data are collected (e.g., data collected from a number of simulated patients in a hospital who display certain symptoms);
-
Tools used to collect and present data (e.g., measuring instruments such as hearth rate, body temperature and blood pressure);
-
Data record, display and organization features (e.g., records with tables and graphs where data from multiple patients are displayed);
-
Some information (declarative knowledge) about key tools and properties might be included, or learners pointing to other resources (e.g., information display resources); and
-
Some analytical features might be included (e.g., how will blood pressure change under specific condition), although this is more characteristic for conceptual resources.
Data should be presented in an authentic way as they emerge from a realistic context. Learners might learn not just about the relationship and properties of that data, but also where data originates, how they are collected and analysed, and how decisions are made based on that data. Data might take many forms, such as numerical measurements, observational data and interview statements, and can be presented authentically with the use of various modalities supported by contemporary representational technologies, such as text, numbers, colours, shapes, audio, video, animation, etc.
Data might be internally stored within a digital resource. This is usually the case when there is a limited and static dataset. Also, data can be generated within the resource based on a learners’ interaction (e.g., throwing a dice and recoding instances of resulting number, or randomly displayed data of water discharge of a river). Alternatively, data can be accessed from external databases via a network. This is the case when we want learners to access data from larger and dynamic databases, whether managed by ourselves or by others, or commercial and non-commercial sources on the Internet. Also, this might be the case when we want learners to collect real-time data from instruments at remote locations accessible via the Internet (e.g., environmental monitoring instruments, remotely-operated telescope/microscope, or web cams). Contemporary technologies allow, so-called, ‘mashing’ which enables data from multiple sources to be mixed and presented in a single resource (e.g., mashing weather data from AccuWether and similar sources with Google Maps from Google, to deliver a bland of data including geographical locations and weather parameters such as temperature, humidity, wind direction and strength, and rainfall). Technologies, such as Google, provide an Application Programming Interface (API) that allows their data to be accessed and reused.
Readers might arrive at the conclusion that such a kind of digital resource for learning is useful only in cases where we deal with hard data (e.g., numerical data that can be manipulated mathematically or statistically), such as in mathematics and science subjects. However, data exist across different disciplines such as in humanities and even languages, and it might be largely available in various soft forms such as interview data, opinions, records, sounds, blog posts, images and videos. Context and tools for the collection and access to different forms of data will differ. These tools are authentic to specific disciplines.
How data are presented within a data display resource is an important factor. Even quantitative data might not be always displayed as numbers alone. For example, the size of a geometric object such as a circular and rectangular bar can correspond to a numeric value; values can be represented through pitch of a sound, or positive and negative values can be represented through blue and red colours. However, usually, these forms of representations are used to supplement raw data or some parameters that are defined based on that data. In the case of a data display resource, focus is on providing learners with authentic data, so that they can organize, manipulate and analyse and use emerging generalizations and abstractions when working on their learning activities. With differences with conceptual resources, data display resources are less concerned with the relationships existing between different aspects of data. It is a learning activity that drives learners to extract these if needed.
Activity 6.2
The UK Department of Transport provides a map with a data count at different count points across the country:
http://www.dft.gov.uk/traffic-counts/cp.php.
Examine the interface to the data, as well as the data provided. Think about and describe what kind of activity you could set up for learners to work with this data and use it to develop certain knowledge.
6.2 Examples of Data Display Resource Designed Specifically for Learning Purposes
The examples presented in Tasks A and B have been developed for general use by anyone interested in accessing the data presented. In this part of the chapter, some examples specifically designed for learning will be presented.
The example in Fig. 6.1 shows a data display resource which presents a scenario (in a form of an image of a lake), allowing a learner to collect water parameters at different locations. After choosing a location on the lake, a learner selects various tools to collect measurements such at temperature, fecal coliform, total dissolved solids, level of phosphorous, acidity level, and turbidity. Learners collect these measurements at different locations on the lake. Once data are captured, they are recorded in the resources and displayed in a summary table that allows a learner to compare data from across different locations on the lake. Descriptive information provided within this environment briefs learners about various tools and data included in the data display resource.

‘Water pollution’ data display resource
An activity might require learners to solve a problem based on specific data extracted from the scenario. As a more immediate step, learners would engage in extracting data from the resources and reorganizing externally for analysis. The data are randomized within possible data-ranges, allowing different learners to work on different combinations of data leading to a variety of conclusions. For example, if a level of dissolved oxygen is low, and level of phosphorous high, this might indicate an algae problem. The following figure shows a screen from the “Water Quality” data display digital resource for learning.
Another example shown in Fig. 6.2 is from a business course with a focus on Cost Accounting. This digital resource for learning shows a floor plan of a virtual company. Learners can navigate different departments of this virtual factory, including general department, administration department, marketing department, supplies department, assembly department, and finishing department, and access data such as, the department’s sections and operations, staff and their salaries, various expenditures such as electricity, material requisitions and costs, machines used in processes and their costs, usage of electricity and required operators, and production output. Learners can use these data to complete a variety of tasks such as to develop a cost information flow diagram, depicting the providers and users of cost information within the organization, and a cost analysis table, and based on these, propose approaches to more effective cost accounting.

‘Virtual factory’ data display resource
We will make note about one more example of a data display resource. This particular resource was developed to allow learners to work with data, which they collected in real-time based on the opinions of their classmates. The resource was developed for postgraduate learners of an education related program. The learners were largely practicing schoolteachers. The main idea was for these learners to examine their collective thinking about the roles of technology in teaching and learning, and through this, to be engaged in identifying conceptual limitations that affect effective technology integration. The students were presented with data that originates from their own community and were collected in real-time. They were presented with the resources shown in Fig. 6.3.

‘What can we do with technology?’ digital resource for learning
This resource presents two sets of questions relevant to technology in education, based on two perspectives, as follows:
-
From a perspective of technology (e.g., Internet, collaborative tools and multimedia content), to indicate the extent to which they see specific affordance as useful for their practice, by dragging the slider from 0 [not useful] to 5-[highly useful]; and
-
From a perspective of their own practice (e.g., lecture, demonstration and practice), indicate the extent to which technology can help them in their work, by dragging a slider from 0 [technology is not useful], to 5 [technology can completely replace a teacher in this activity].
All the data collected from students (across different classes) are summarized in the two graphs as shown below. This can be already considered to be information generated based on the raw data collected (Fig. 6.4).

Summary of data emerging from the ‘what can we do with technology?’ digital resource for learning
The central idea of this experience is to initiate students’ critical reflection and discourse about what they observe from the data, and how their own thinking contributes to this collective understanding. Learners can be engaged in further activities, such as, to discuss in a forum and present their view about issues that affect technology integration has in schools, and apply certain statistics to identify statistically significant relationships. An activity might also require students to develop a proposal for their schools about the directions for adoption of technology, or develop an intervention to help teachers to transform aspects of their thinking.
In this specific example, we can see how a data display resource might be based on non-existent data, that is, data that emerges in the context of a learners’ activity and use of a digital resource for learning. From the perspective of procedural knowledge, students, in this particular instance, learn about the procedure of collecting data to inform education leadership decisions.
With these examples, we see three different ways of how data can be presented to learners. In the first example, hard data (random numerical values for various water quality indicators) are presented. Data are extracted by learners through specific tools used in the process. Data sources are generated based on underlining mathematical logic. Alternatively, data can be extracted from data sources on the Internet. In the second example, there are a bland of soft and hard data presented through the interface. The data are embedded in the resource and displayed based on the learners’ exploration. Learners place attention and use various pieces of data as directed by a learning activity. In this case, learners do not use any specific tools, as data are not measurable, rather they are specified.
Activity 6.3
It is not always easy to distinguishing between different forms of digital resources for learning. Carefully examine the “Digital Multimeter” digital resource for learning illustrated in Fig. 6.5 . Attend to the following questions:

“Digital multimeter” digital resource for learning
-
What would be the main purpose of this resource?
-
What kind of data are available in this resource?
-
How are the data collected?
-
How does the resource support data organization and analysis?
-
Given it all, do you think this digital resource for learning will identify more as a conceptual representation or a data display?
-
Do you have any recommendations for the improved design of this digital resource for learning?
6.3 Designing Data Display Resources
The design of a data display digital resources for learning might occur in the way as explained below. This description is provided as a guide, however, as noted in the design of other forms of digital resources for learning, the process can vary in complexity depending on whether you are designing it, for example, for your own teaching, for your colleagues, for other teachers in your institution, or for an external client and as a part of a larger project development team. In some cases, storyboarding, flowcharting, evaluation and various project documents might be needed and signed off before actual production. In other cases, the process can be completed in a more casual manner. Nevertheless, in here, some key conceptual issues related to the design of data displays are presented.
-
Start by identifying a topic/concept—Usually, this is determined based on some concept from a curriculum that could be developed through a learning activity involving working with data (conceptual knowledge), and/or where learning of a procedure involved in working with data is required to be learnt (procedural knowledge). A topic can be identified by a designer or requested by a client. The purpose of a data display digital resource could be to support the development of conceptual knowledge, or even to support the development of procedural knowledge involved in data capture, collection, management and analysis. Let us use the data display digital resource for learning featured in Fig. 6.1 as an example to illustrate this process. The topic/concept selected for the design and development in this example is “Water Quality” and associated parameters (represented by data) that determines it.
-
Determine data-set to be used in the resource—This might include:
-
Data from a real source (e.g., collected by distant measuring instruments and probes or provided by data providers in real-time);
-
Real data collected by learners and fed to the resource;
-
Data collected by sensors and instruments which are attached or are a part of a device used for delivery;
-
An artificial data set created by a designer based on certain regularities;
-
Data that emerges through the use of a digital resource, e.g., by multiple users providing input to data set based on their interaction and feedback; or
-
An algorithm for mathematically-driven generation of data based on interaction with the resource.
-
-
In the case of “Water Quality” data display resources, an artificial data set is integrated into the resource and includes parameters/indicators and data generated by a mathematical algorithm randomly within possible ranges. These numeric data include the following:
-
Dissolved Oxygen (DO);
-
pH;
-
Fecal Coliform (FC);
-
Biochemical Oxygen Demand (BOD);
-
Temperature (C);
-
Total Phosphates (PO4);
-
Nitrates (NO3-);
-
Turbidity (T); and
-
Total Dissolved Solids (TDS).
-
-
Identify a scenario/context to be used to present data to learners—In the case of the “Water Quality” example, the context is a scenario of a lake. Learners can collect data from various parts of this lake. A certain level of authenticity is always useful as it informs learners about a real context within which specific data emerges.
-
Identify tools needed for the data collection (if any tool is needed)—Each of the data are collected by a specific instrument or extracted by specific test, and in the case of the “Water Quality” example, these include the following:
-
Accu Vac Check for Dissolved Oxygen (DO);
-
Hach Pcket Pal Ph Meter for pH;
-
Colisan EasyGel Test for Fecal Coliform (FC);
-
5 h BOD Test for Biochemical Oxygen Demand (BOD);
-
Thermometer for Temperature (C);
-
Model NI Test for Nitrates (NO3-);
-
Model PO Test for Total Phosphates (PO4);
-
TurbiMeter for Turbidity (T); and
-
TDS Meter for Total Dissolved Solids (TDS).
-
-
In the case of the “Water Quality” data display resource, learners simply select a tool (one of the icons below the lake scenario), and by clicking on a specific target area, they record a measurement/data. The data collected from a specific location of the lake are displayed immediately on the bottom right part of the screen, and stored in the emerging data record (see Fig. 6.1). Some designs of data displays might include simulated instruments and tests so that learners can be exposed to their operation and use.
-
Determine level of analysis if any, and presentation of data (textual, numeric, or/and graphical)—A certain level of data analysis and representation can be included in the data display resource, although the main purpose is to provide data to learners to analyse within their learning activity. For example, data collected as numbers might be represented as graphical objects (e.g., as a bars of a bar chart, or as blue and red colours for positive and negative values). Some level of data analysis can be included (e.g., a pie chart showing proportions and percentages), however, almost always, conclusions/generalizations and abstractions are left open for learners to make, test and refine through their activity. In the case of the “Water Quality” data display resource, data collected are organized and presented in a summary table, making it easier for learners to engage in further analysis and generalization (see Fig. 6.6).
Fig. 6.6 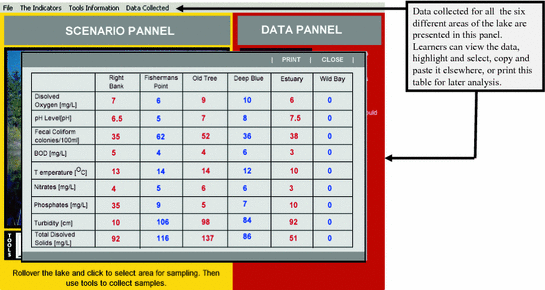
Display of data collected within the “water quality” digital resource for learning
-
Determine any declarative information to include in the resource—Some declarative information might be useful to include in the data display resource. Usually, this includes information about parameters, procedures and tools. In the context of the “Water Quality” data display resources, learners can access declarative information related to each of the parameter and tools. Figure 6.7 demonstrates how declarative information is included in the “Water Quality” data display resource.
Fig. 6.7 
Declarative information displayed within the “water quality” resource
-
Design and prototype data display resource—once all the necessary components are collected, and ideas are clear, a prototype, either a functional one developed with a final development tool (e.g., Flash, HTM5 or App Inventor), or a mock-up of the screens developed with something easier, such as, PowerPoint, can be created and evaluated. Once feedback from the evaluation is collected, a final decision can be articulated in the design before the full production is carried out. Evaluation can focus on the subject matter content, data completeness, accuracy and presentation, interface design and presentation, language, appropriateness for learners, etc.


Activity 6.4
The Air Quality Index (AQI), also called Air Pollution Index (API), informs the public of the local level of air pollution, and the potential health risk it could impose. People use the AQI to help them make decisions, for example, on outdoor activities.
A network of air quality monitoring stations across countries has been set up to measure concentrations of pollutants in the air at fixed time intervals. The national air quality standards will usually be used as the reference for the AQI (e.g., by US Environmental Agency). Some countries, like South Africa, Canada and Hong Kong use a variation of this index. For example, Hong Kong introduced an Air Quality Health Indicator (AQHI) which considers various statistics explicated from actual intervention by health agencies in dealing with people affected by poor air quality (see “Overview of Hong Kong’s Air Quality Health Index” at https://aqicn.org/faq/2015-06-03/overview-of-hong-kongs-air-quality-health-index/ for more information about how this is calculated).
Air pollutants commonly used in AQI include: Nitrogen dioxide (NO 2 ), Sulphur dioxide (SO 2 ), Ozone (O 3 ), Carbon monoxide (CO), suspended particulates smaller than 10 μm in aerodynamic diameter (PM10), and suspended particulates smaller than 2.5 μm in aerodynamic diameter (PM2.5). Some countries also monitor lead (Pb) and visibility (e.g., Australia), and incorporate these into the AQI calculation, while some other countries exclude SO 2 and CO, or O 3 (e.g., China). Calculation of the AQI is usually based on 1-hour, 8-hour, or 24-hour average monitoring data.
World Quality Index project provides data on the air pollutants across the Globe. Access this display at https://aqicn.org/map/world/ and examine data at various locations.
In this activity, you should design a data display resource that can be used by learners in activities that leads them to learn about AQI and various air pollution parameters. Consider what aspects of the https://aqicn.org/map/world/ you can adopt, and how to provide a simplified design that is more relevant for learning. For example, how to integrate an experience of data collection, do you need to integrate any tools, and how to provide more authentic contexts for data collection?
Here some references for you to study, so that you can understand more about the Air Quality Index:
-
Air Quality Index Wikipedia article (Pay attention to US approach to AQI) https://en.wikipedia.org/wiki/Air_quality_index
-
A Beginner’s Guide to Air Quality Instant-Cast and Now-Cast https://aqicn.org/faq/2015-03-15/air-quality-nowcast-a-beginners-guide/
You can conduct your own search to find other resources that can help you to understand the AQI and how best to design your digital resource for learning.
Author information
Authors and Affiliations
Corresponding author
Rights and permissions
Copyright information
© 2017 Springer Nature Singapore Pte Ltd.
About this chapter
Cite this chapter
Churchill, D. (2017). Data Display Resources. In: Digital Resources for Learning. Springer Texts in Education. Springer, Singapore. https://doi.org/10.1007/978-981-10-3776-4_6
Download citation
DOI: https://doi.org/10.1007/978-981-10-3776-4_6
Published:
Publisher Name: Springer, Singapore
Print ISBN: 978-981-10-3775-7
Online ISBN: 978-981-10-3776-4
eBook Packages: EducationEducation (R0)