
Abstract
The long-term effect of tsunami inundation on soil salinisation was assessed following the 2011 Tohoku-oki tsunami in two areas on the Sendai Plain, near Sendai airport in the Miyagi Prefecture and Matsukawa-ura near Soma in the Fukushima Prefecture. Data gathered over four sampling seasons 2, 5, 9 and 11 months after the tsunami near Sendai airport show that the salt content generally decreased with time. Concentrations were nevertheless higher in February 2012 than in October 2011, probably due to capillary action and evaporation following long periods with little precipitation in the winter, while the lower concentrations in October were attributed to dilution due to intense rainfall prior to the sampling period. In February 2012, the area with chloride concentrations over the guidelines for the establishment of rice seedlings still extended for nearly 1 km between 2.45 and 3.33 km inland. Chloride concentrations also reached the guideline values at the land surface 1.71 km inland. This corresponded to the limit of the area deemed not suitable for rice production by local rice farmers. However, recent observations revealed that rice crops were not only halted in 2011 but also in 2012, probably due to high salinisation of soil and/or surface and groundwater. Our study shows that soil salinisation was still recorded to nearly 15 cm depth in areas with fine-grained organic-rich soil ~2.5 km from the shoreline 11 months after the tsunami, and that water-leachable ions were preferentially retained in organic-rich muddy sediment and soil, reflecting the long-term impact of tsunami inundation. In Matsukawa-ura, salt crusts still covered the area flooded by the tsunami in February 2012 and both the soil and muddy tsunami deposit were characterised by high chloride and sulphate concentrations. The latter might also lead to sulphide toxicity. Remediation measures have been implemented in certain areas, but further research needs to be carried out to test the effectiveness of the measures being used to allow rice production to resume.
Access provided by Autonomous University of Puebla. Download chapter PDF
Keywords
10.1 Introduction
The 11 March 2011 Tohoku-oki tsunami generated by a MW 9.0 megathrust earthquake affected ~2,000 km of the Pacific Coast of Japan, and inundated over 400 km2 of land (Mori et al. 2012). The tsunami reached over 5 km inland on the Sendai Plain (Mori et al. 2012), depositing sand and mud, ranging between ~30 cm and a few mm thick (e.g., Goto et al. 2011; Chagué-Goff et al. 2012a; Szczuciński et al. 2012). Seawater ponded over vast areas of farmland, in natural and man-made depressions, as a result of the nearly flat topography on the low-lying Sendai Plain and subsidence associated with the earthquake (e.g., Goto et al. 2011). Research carried out within 2 months of the tsunami (May 2011) along a 5.1 km shore-perpendicular transect north of Sendai airport in the Miyagi Prefecture revealed that not only was the ponded water saline to brackish, mostly due to evaporation, but that the tsunami deposit and the underlying soil had been contaminated by saltwater (Chagué-Goff et al. 2012b). Five months after the tsunami (August 2011), contamination of sediment and soil was still notable (Chagué-Goff et al. 2012b). A marine chemical signature was also reported in May 2011 beyond the extent of the mud deposit up to the limit of tsunami inundation (Chagué-Goff et al. 2012a, b), which matched the limit mapped immediately after the tsunami (Association of Japanese Geographers 2011).
Contamination of the tsunami deposit and underlying soil by metals and metalloids has been reported in Thailand following the 2004 Indian Ocean Tsunami (2004 IOT) (e.g., Szczuciński et al. 2005) and in coastal areas of Honshu Island following the 2011 Tohoku-oki tsunami (e.g., Komai et al. 2012). However, in our study area near Sendai airport on the Sendai Plain, metals and metalloids were found to occur in concentrations within the background levels of uncontaminated Japanese soils, and this was partly attributed to the minimal contribution of offshore marine sediment to the tsunami deposit (Chagué-Goff et al. 2012b; Szczuciński et al. 2012).
Recent studies carried out after the 2004 IOT (e.g., FAO 2005; Szczuciński et al. 2005; UNEP 2005; Raja et al. 2009; McLeod et al. 2010), 2009 South Pacific Tsunami (Chagué-Goff et al. 2011), 2010 Maule Tsunami (Yoshii et al. 2013) and 2011 Tohoku-oki Tsunami (e.g., Fujikawa et al. 2011; Goto and Inagaki 2011; Chagué-Goff et al. 2012b; Komai et al. 2012; Yoshii et al. 2013) have shown that tsunami inundation results in salinisation of both tsunami sediment and underlying soil, or even soil beyond the extent of the tsunami deposit (Chagué-Goff et al. 2012b; Yoshii et al. 2013). Much has been reported on the effects of tsunami inundation on agriculture, including erosion and scouring of top soil, changed land levels and drainage patterns, deposition of sediment and debris on land, contamination by excess salts, increased soil sodicity (amount of available sodium), deterioration of soil fertility due to changes in soil texture and structure (e.g., FAO 2005; UNEP 2005). A few studies also investigated temporal changes in water leachable ions following the 2004 IOT. The high rainfall in the Andaman and Nicobar Islands (>3,000 mm/year) was found to result in leaching of salt in the soil profile to near pre-tsunami levels (Raja et al. 2009). Szczuciński et al. (2007) made a similar suggestion after investigating changes in Thailand, although they focussed their research on the surface tsunami and/or soil layer. As for McLeod et al. (2010), they used soil apparent electrical conductivity to assess soil salinity and leaching processes with time in the Aceh province, Indonesia. Most studies and observations following the 2004 IOT thus revealed that the high rainfall in these tropical climates generally led to relatively fast leaching of salt, although it also depended upon the length of saltwater ponding and other factors, such as soil type and texture (e.g., IAARD and NSW DPI 2008).
Our present study focusses on the effect of tsunami inundation on soil salinisation in a temperate climate characterised by moderate precipitation (~1250 mm/year; NINS 2012) on Honshu Island, Japan, and its impact on rice crops. Further to the May and August 2011 surveys near Sendai airport, two follow-up surveys were carried out in October 2011 and February 2012 to assess the spatial and temporal extent of tsunami inundation on soil salinisation. Samples were also collected from three sites at Matsukawa-ura, near Soma, Fukushima Prefecture in February 2012 and these results are provided as a comparison. This site is located ~42 km N of the Fukushima Daiichi Nuclear Power Plant (FDNPP) that was damaged due to the 2011 Tohoku-oki tsunami, leading to the Fukushima Daiichi nuclear disaster (e.g., Ohnishi 2012). The site was not accessible in May 2011 to the first author, a resident of Australia, as it was inside the 80 km exclusion zone set by the Australian Department of Foreign Affairs and Trade (DFAT 2011) at the time of the first survey. It was however visited in February 2012, when the first author was allowed to travel to the site, as determined by DFAT (2012), and samples could be collected to assess the amount of water-leachable salts in the tsunami deposit and underlying soil. As the aim of this study is to evaluate the effect of tsunami inundation on rice production on the Sendai Plain, data were plotted against the guidelines provided by the Crop Production Division of Miyagi Prefecture (CPDMP) (2011), based on the handbook by the Agricultural and Forestry Department, Chiba Prefectural Government (AFDCPG) (1973). The AFDCPG (1973) guidelines indicate that chloride concentrations of 500–700 mg kg−1 result in brine damage of rice seedlings and CPDMP (2011) also showed that a chloride concentration of 500–700 mg kg−1 corresponds to a soil electrical specific conductivity of 0.3 mS cm−1 (based on a 1:5 soil:water ratio, and assuming that the content of ions in a soil is the same as that of the standard sea water). The electrical conductivity of soil is most often determined to estimate the amount of salt (e.g., FAO 2005; IAARD and NSW DPI 2008), as it is a faster method not requiring analysis. However, in this study, we determined the concentrations of soluble ions. Thus, as we are referring to these guidelines, we focus our results on changes in chloride concentrations, although it is well known that salt contamination is reflected in other parameters, such as increases in sodium and other elements, and increases in pH (e.g., FAO 2005). For example, Goto and Inagaki (2011) reported boron concentrations of 10–20 mg kg−1 in available form in tsunami sediments, which were largely in excess of the optimal concentration of 0.5–2.0 mg kg−1, and were thus likely to result in crop damage.
10.2 Methods
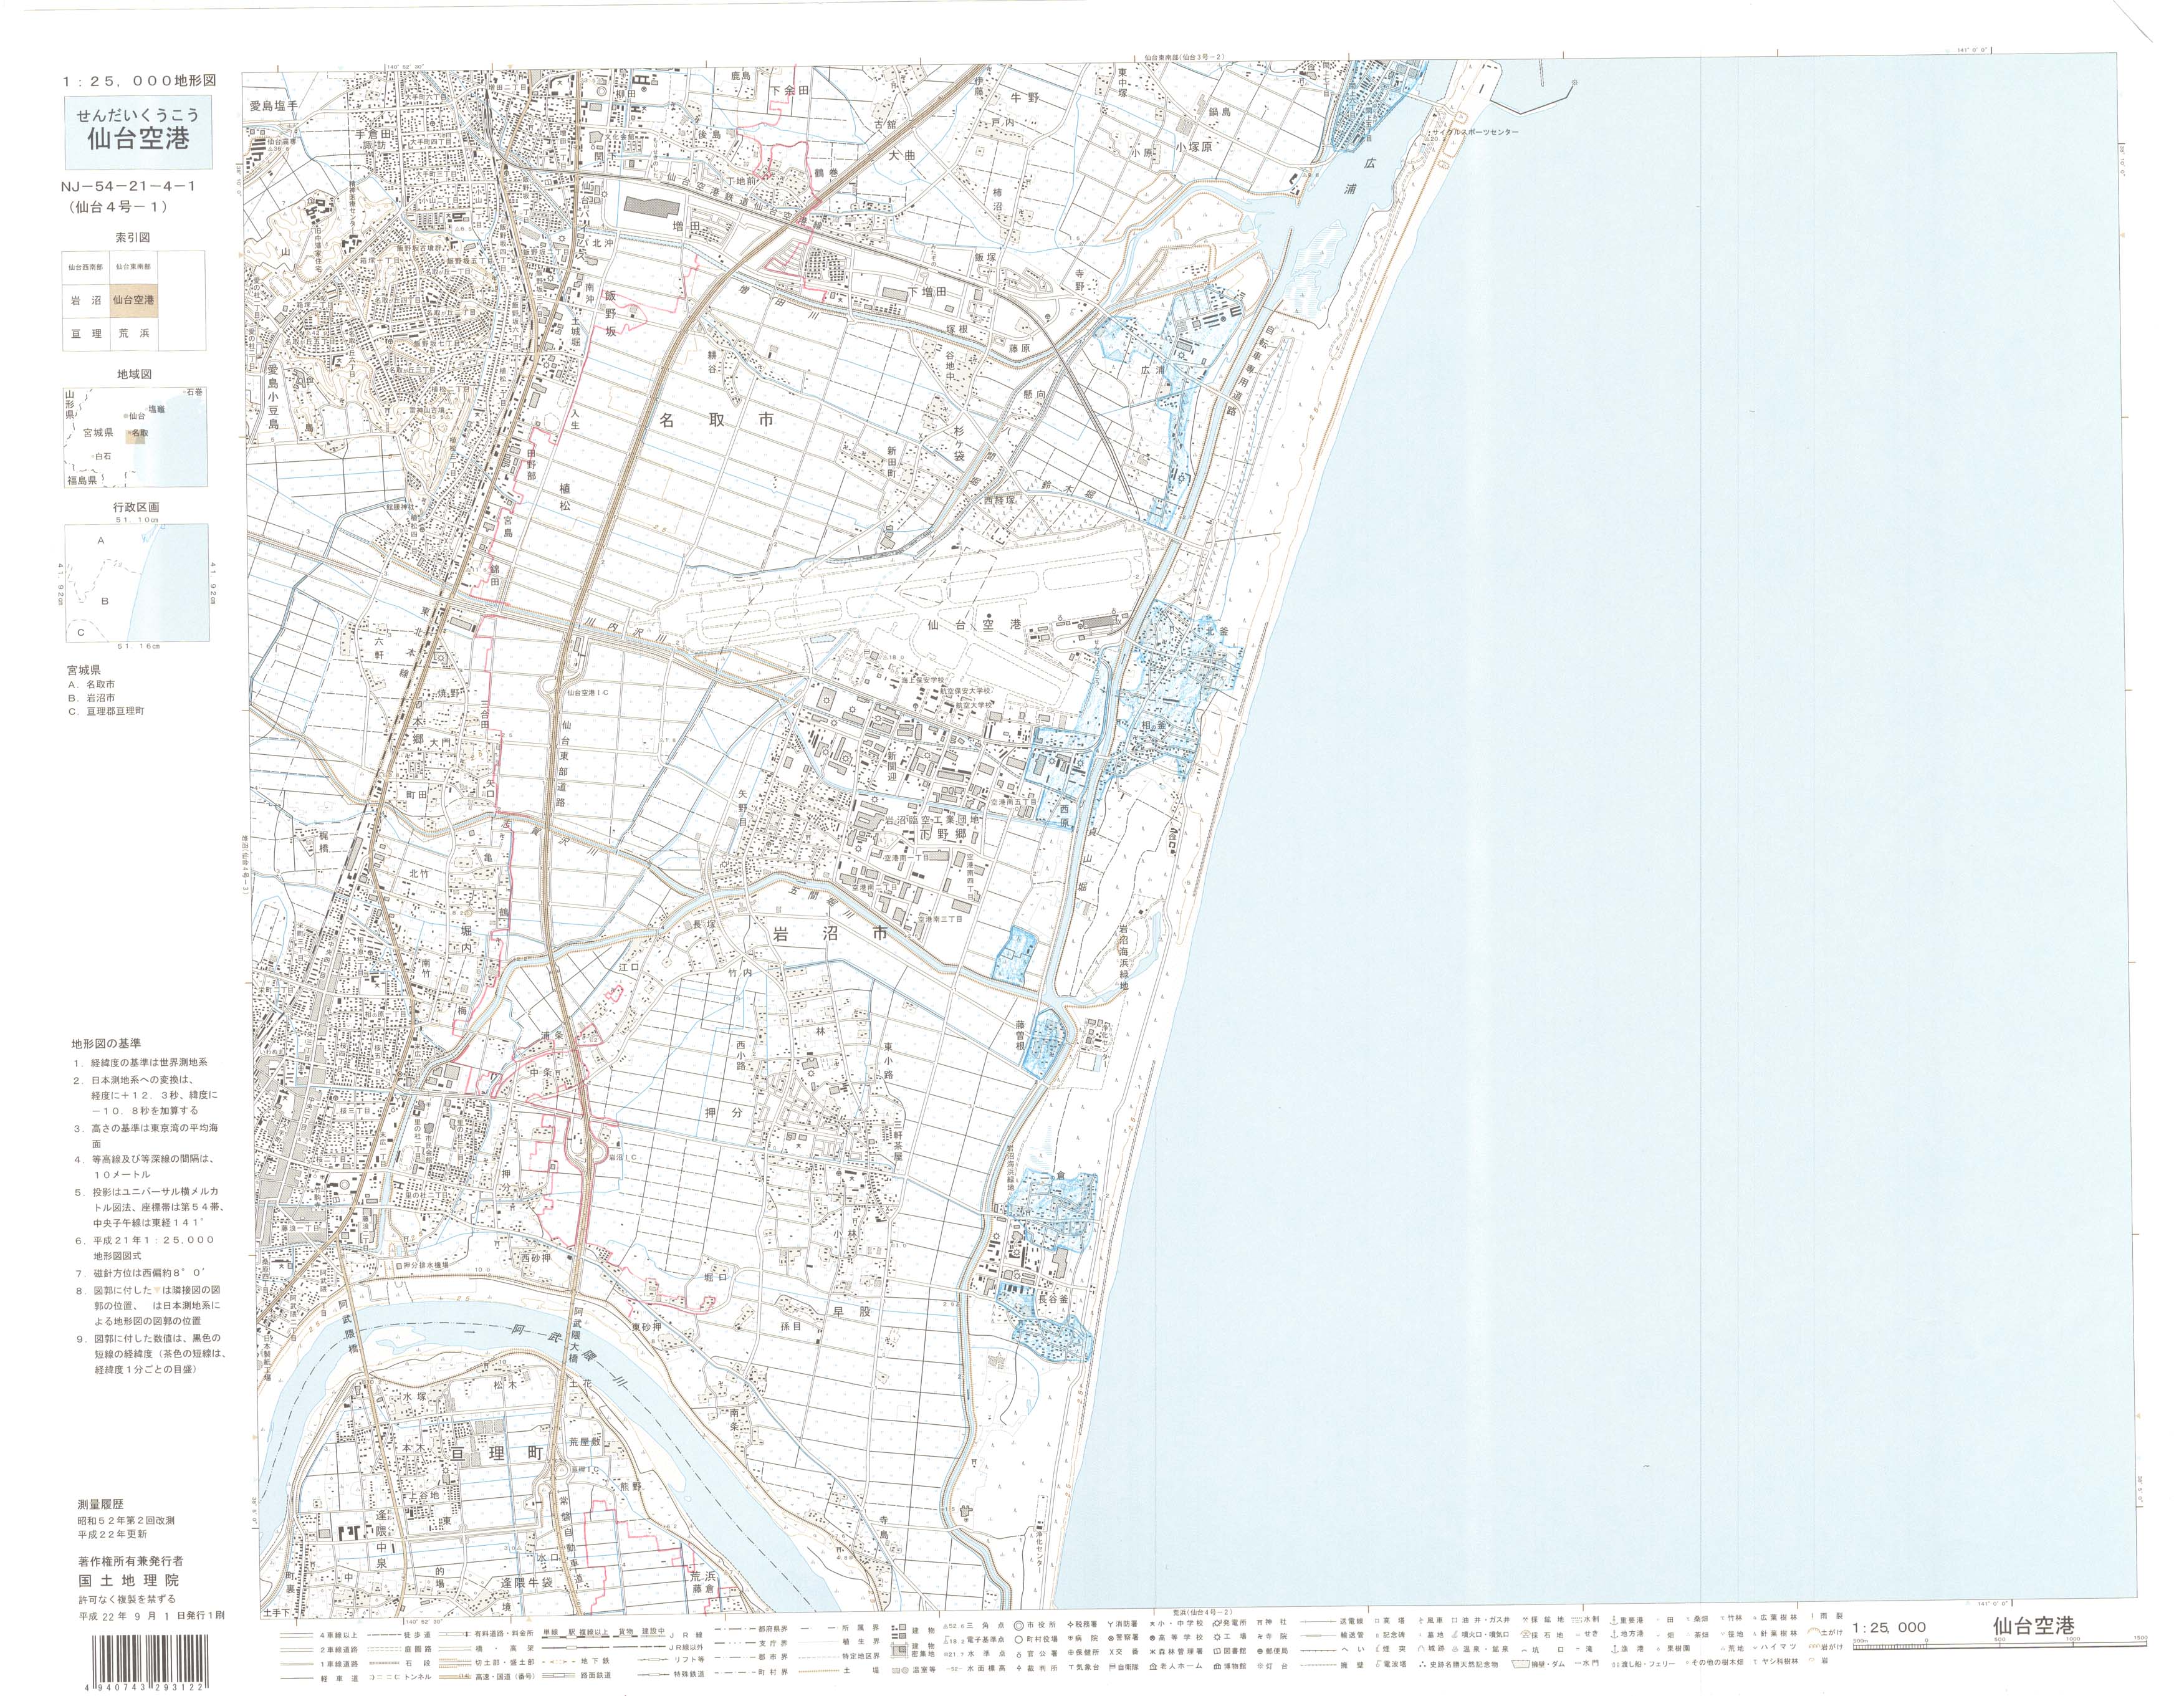
A shore-perpendicular transect extending from the shoreline to c. 5.1 km inland was established north of Sendai airport, in the central part of the Sendai Plain (Fig. 10.1). Samples of tsunami deposit and underlying soil were collected along the transect at 30 sites in May 2011. The sampling depth intervals in the tsunami deposit ranged from 2 mm (mud drapes) to 4 cm. The top 2 cm of the underlying soil was also sampled, as well as soil beyond the landward limit of the tsunami deposit (Fig. 10.1c). In addition, at four sites (WP325, WP326, WP327 and WP329), not only the tsunami deposit (sand, sand and mud, or mud) but also the underlying soil was sampled up to a maximum depth of 20 cm to assess the extent of salt contamination in the soil (Fig. 10.1c). The stratigraphy of the tsunami deposit varies at these four sites, but is typical of the variability observed along the transect. The first 4–5 cm of the soil profile were sampled at 1 cm intervals and the remaining profile every 5 cm. A limited number of sites were sampled again in August 2011, October 2011 and February 2012, in order to assess the temporal changes in the effects of salinisation on the sediment and soil in the area of study. At two of the sites in Matsukawa-ura (Ma1 and Ma2), muddy and sandy intervals of the tsunami deposit ranged between 0.5 and 5 cm, while the top 2 cm of the underlying soil was sampled. Soil samples were also collected beyond the limit of tsunami inundation (Ma3) (Fig. 10.1d).

(a) Map of Japan showing the epicentre of the M 9.0 Tohoku-Oki earthquake and regional map with studies areas. (b) Regional map showing study areas in Miyagi Prefecture near Sendai and in Fukushima Prefecture near Soma (FDNPP = Fukushima Daiichi Nuclear Power Plant). (c) Location map with sampling sites near Sendai airport, Miyagi Prefecture. The extent of rice paddy fields along the transect prior to the 2011 tsunami (between ~1.1 and 4.5 km from the shoreline, although this area also includes roads, canals and residential areas), and the limit of tsunami inundation (LTI) are shown. See text for explanation. (d) Location map of study area at Matsukawa-ura, near Soma, Fukushima Prefecture, with sampling sites. The brown double-ended arrow indicates the area covered by rice paddy fields prior to the tsunami
Grain size analysis of samples collected in May 2011 (n = 133) was carried out by laser diffraction using a Malvern Mastersizer 2000 after pre-treatment with hydrogen peroxide. The instrument can be used for sediment with a grain size <1,400 μm, which represented >98 % of all samples, except at two sites (3-3 and 3-16), where the coarser fraction amounted to 5 % and was analysed using sieves. Results for these samples were combined using corrections due to density and weight/volume percentages. The organic content of all samples collected during the four field surveys near Sendai airport and in Matsukawa-ura (n = 341) was determined by ashing at 550 °C for 4 h after drying overnight at 105 °C. All samples were processed for water-leachable ions, by drying at 105 °C, adding high-purity water (18.2 MΩ cm) (ratio soil:water of 1:10) before being placed on a shaker at 125 rpm for 24 h. The supernatant was then filtered using a 0.2 μm disposable filter and split for anions and cations. Water leachable anions (Cl, Br, F, SO4, NO3, PO4 and NO2) were determined by Dionex DX-600 Ion Chromatograph (IC), while water-leachable cations (Ca, K, Mg, Mn, Na, P, S and Sr) preserved with sub-boiling nitric acid were determined by Varian VISTA AX (axial) CCD Simultaneous ICP-AES (see Chagué-Goff et al. 2012b, for details on all analytical techniques used here). Although a 1:10 soil:water ratio was used in this study to obtain a large enough volume for analysis, as opposed to a 1:5 ratio used for measurements of electrical conductivity (CPDMP 2011), chloride concentrations were calculated by taking the dilution factor into effect and reported on a sediment dry weight basis. Therefore, they can directly be compared to the AFDCPG (1973) and CPDMP (2011) guidelines.
Datasets from each period sampled were analysed using SPSS v. 21 (2012). However, data are only reported for all samples analysed in May 2011 near Sendai airport, and in Matsukawa-ura in February 2012.
10.3 Results
Most ions reported in May 2011 exhibited a similar distribution along the 5.1 km shore-perpendicular transect, with distinctly higher concentrations between 1.55 and 4.03 km inland (between sites 3-30 and 3-80) (see Fig. 10.2 for chloride concentrations, which are representative of the other ions, as shown by high positive correlations between all elements, except for P, PO4, NO3 and F; NO2 data were not included as they are mostly below detection limit; see Table 10.1 and Chagué-Goff et al. 2012b).

(a) Chloride concentrations (May 2011) in the tsunami deposit (red open squares), underlying soil and soil not covered by the tsunami deposit (blue dots) and beach (green triangles) along the transect extending to 5.13 km inland near Sendai airport. The area covered by rice paddy fields (~1.1 to ~4.5 km inland) is marked. (b) Mean grain size of the tsunami deposit (red open squares), underlying soil and soil not covered by the tsunami deposit (blue dots) and beach (green triangles) along the transect. The horizontal dashed line indicates the limit between the sand (mean grain size <4 Φ) and mud (mean grain size >4 Φ). (c) Land elevation (m) above the Tokyo Peil (TP), which is the reference sea level, and flow height (m) above TP, recorded in May 2011 along the transect up to Tobu Highway (4.5 km inland) (Modified after Goto et al. 2011). Data show the nearly flat topography between the coastal forest and Tobu Highway (see Fig. 10.1c for location of transect). n.a. = not available
Results also indicate that concentrations were in general higher at the surface of the tsunami deposits compared to intervals below, in particular where salt crusts were visible (Fig. 10.3; May 2011). Lower concentrations were measured in the sandy tsunami deposit and soil (except ~1.5–1.85 km inland), as well as on the beach from the shoreline to 1.24 km inland (site 3-24) and from 4.27 km inland (site 3-84) to beyond the limit of tsunami inundation. Nevertheless, the soluble chloride content was 100 times higher (~2,000 mg kg−1) within the limit of tsunami inundation (site WP308) than immediately beyond it (~20 mg kg−1, site WP309), despite the fact that the land had been ploughed since the event and no sedimentological evidence nor debris were visible (Chagué-Goff et al. 2012b). Chloride concentrations beyond the limit of tsunami inundation (17–23 mg kg−1, n = 4, at sites WP309 and WP324) are thus used as background concentrations. In February 2012, chloride concentrations were similar and close to background at both sites (8–26 mg kg−1, n = 4).

Photograph of site 3-36 (~1.85 km inland, north of Sendai airport) showing the salt residues on the surface muddy sand, underlain by sand (taken in May 2011). The darker soil can be seen below the tsunami deposit. See Fig. 10.1c for site location
The tsunami deposit and underlying soil generally fined inland, with a discontinuous sand deposit varying in thickness from ~30 to 0.5 cm recorded up to ~2-8-2.9 km inland (Chagué-Goff et al. 2012a; Szczuciński et al. 2012). It consisted mostly of medium to fine sand (Figs. 10.2 and 10.3) overlain by a discontinuous mud drape or cap from ~1.4 km inland. The 3 cm to 1–2 mm thick mud-dominated deposit covered the paddy fields up to 4.65 km inland west of Tobu Highway (site WP307 in Fig. 10.1; see also Chagué-Goff et al. 2012a; Szczuciński et al. 2012). Readers are referred to Szczuciński et al. (2012) for further details on the sedimentological characteristics of the deposit and underlying soil in this area.
In the following, we focus on ion concentrations and temporal changes in the area inundated by the tsunami that was mostly occupied by rice paddy fields before the 2011 event (except for housing, roads and canals), between ~1.1 and ~4.5 km from the shoreline (Fig. 10.1c; from ~100 m seaward of site 3-24 to site 3-88, ~20 m from Tobu Highway). We also provide results for the sites at Matsukawa-ura that were only sampled in February 2012 (Fig. 10.1d).
As shown in Fig. 10.4, chloride concentrations decreased with time, both in the tsunami deposit and underlying soil. Nevertheless, a similar pattern is observed at all sampling times (May, August and October 2011, February 2012). The higher concentrations are recorded between about 2.5 km and 3.5 km inland, with a general decrease from that point both seaward and landward (Fig. 10.4). The dotted line in Figs. 10.4a–d marks 500–700 mg kg−1 chloride concentrations, the AFDCPG (1973) and CPDMP (2011) guidelines. Our data show that the extent of the tsunami deposit and soil characterised by chloride concentrations over 500–700 mg kg−1 is much smaller in February 2012, almost a year after the tsunami, than in May 2011 (2 months after the event). However, it still covers an area nearly 1 km along the transect, extending from 2.45 to 3.33 km inland, where the deposit and soil are mostly mud-dominated. In addition, the surface sample at site WP326 (1.71 km inland), contained 569 mg kg−1 chloride, thus with concentrations that could be detrimental to rice seedlings. It is also interesting to note that chloride concentrations were higher in February 2012 (9,250 mg kg−1 at the surface characterised by fine organic-rich material (algal mat) at site 3-54, 2.8 km inland) (Fig. 10.4d) than in October 2011 (maximum of 3,520 mg kg−1 in the underlying soil at site 3-56, 2.89 km inland) (Fig. 10.4c).

Chloride concentration in the tsunami deposit (red open squares) and underlying soil (blue dots) in May 2011 (a), August 2011 (b), October 2011 (c) and February 2012 (d). The total precipitation (P) from the 11 March 2011 tsunami to the period of sampling at Sendai airport (After Japan Meteorological Agency 2012) is indicated after the sampling date. Note that data are expressed using a logarithmic scale. Each square or dot represents a sample (see Figs. 10.5, 10.6, 10.7 and 10.8 for details at particular sites). The dotted line marks the guidelines (500–700 mg kg−1 chloride) of the Agricultural and Forestry Department, Chiba Prefectural Government (1973) and Crop Production Division of Miyagi Prefecture (2011), above which brine damage occurs in rice seedlings. Data show that while the area unsuitable for rice production gets generally smaller with time, both the overlying muddy tsunami deposit and underlying soil are still considered contaminated almost 1 year after the tsunami over an area covering nearly 1 km (between 2.45 and 3.33 km inland), as well as at the surface 1.71 km inland
The downward leaching of salt through the sandy tsunami deposit into the underlying soil is illustrated in Fig. 10.5 (site WP325), where concentrations of water leachable ions were fairly low in the 20 cm thick sandy deposit even in May 2011 (<1,070 mg kg−1 chloride). Chloride concentrations however reached 7,620 mg kg−1 at the top of the soil layer and decreased downward to 2,080 mg kg−1 at 17 cm depth (in the soil profile). At site WP326, characterised by a 1 cm-thick sandy deposit, ion concentrations were higher in the sand than in the underlying soil (Fig. 10.6), probably because the seawater ponded and could not leach downwards as easily through the underlying soil. Where the sandy deposit was overlain by a mud cap, like at site WP327 (Fig. 10.7), ions exhibited highest concentrations in the surface layer (e.g., 47,080 mg kg−1 chloride), leached through the sand and were higher in the underlying soil than in the sand unit. At site WP329, where the tsunami deposit consisted of a thin mud layer, ion concentrations were highest at the surface (e.g., 87,500 mg kg−1 chloride), and then decreased downward in the underlying mud layer and underlying soil (Fig. 10.8). Most ions that occur in high concentrations in seawater (e.g., Na, SO4, Br, Mg, Ca, K) followed a similar pattern, reflecting downward saltwater leaching following tsunami inundation (see Figs. 10.5, 10.6, 10.7 and 10.8 for distributions of Na, SO4, Br).

Stratigraphy, organic content (expressed as loss on ignition LOI (%)), grainsize (Φ) (May 2011 only), water-leachable (soluble) chloride, bromide, sulphate and sodium concentrations in tsunami sediment and underlying soil at site WP325. See Fig. 10.1c for site location. The horizontal dashed line shows the limit between the tsunami deposit and underlying soil, and the vertical dotted line marks 500–700 mg kg−1 chloride, the AFDCPG (1973) and CPDMP (2011) guidelines. Each symbol represents a sample collected at a different depth. Data are provided at three sampling periods (May and October 2011, February 2012), except for grainsize. (n.a. = not available, as only top soil profile sampled in August 2011)

Stratigraphy, organic content (expressed as loss on ignition LOI (%)), grainsize (Φ) (May 2011 only), water-leachable (soluble) chloride, bromide, sulphate and sodium concentrations in tsunami sediment and underlying soil at site WP326. See Fig. 10.1c for site location. The horizontal dashed line shows the limit between the tsunami deposit and underlying soil, and the vertical dotted line marks 500–700 mg kg−1 chloride, the AFDCPG (1973) and CPDMP (2011) guidelines. Each symbol represents a sample collected at a different depth. Data are provided at three sampling periods (May and October 2011, February 2012), except for grain size

Stratigraphy, organic content (expressed as loss on ignition LOI (%)), grainsize (Φ) (May 2011 only), water-leachable (soluble) chloride, bromide, sulphate and sodium concentrations in tsunami sediment and underlying soil at site WP327. See Fig. 10.1c for site location. The horizontal dashed line shows the limit between the tsunami deposit and underlying soil, and the vertical dotted line marks 500–700 mg kg−1 chloride, the AFDCPG (1973) and CPDMP (2011) guidelines. Each symbol represents a sample collected at a different depth. Data are provided at three sampling periods (May and October 2011, February 2012), except for grainsize. Note the discontinuous dashed lines and changes of scale for chloride, bromide and sulphate

Stratigraphy, organic content (expressed as loss on ignition LOI (%)), grainsize (Φ) (May 2011 only), water-leachable (soluble) chloride, bromide, sulphate and sodium concentrations in tsunami sediment and underlying soil at site WP329. See Fig. 10.1c for site location. The horizontal dashed line shows the limit between the tsunami deposit and underlying soil, and the vertical dotted line marks 500–700 mg kg−1 chloride, the AFDCPG (1973) and CPDMP (2011) guidelines. Each symbol represents a sample collected at a different depth. Data are provided at three sampling periods (May and October 2011, February 2012), except for grainsize. Note the discontinuous dashed lines and changes of scale for chloride, bromide, sulphate and sodium
Temporal changes in ion concentrations are illustrated in Figs. 10.5, 10.6, 10.7 and 10.8 at these four sites. Soluble ion contents decreased with time, in particular where the tsunami deposit and underlying soil were sandy (WP325 and WP326). There, chloride concentrations were below the AFDCPG (1973) and CPDMP (2011) guidelines in February 2012 (Figs. 10.5 and 10.6). At site WP327, where the tsunami deposit consisted of a sandy layer overlain by a mud cap, and the underlying soil was predominantly silty (Φ of 4–6), data show that except in the sandy layer, chloride concentrations were well above the AFDCPG (1973) and CPDMP (2011) guidelines in February 2012. Sulphate concentrations were even higher in February 2012 than in August 2011 in the soil. It is thus inferred that salt might have leached downward, as shown by a slight downward increase in Cl, Br, SO4 and Na, and concentrations near the base of the soil profile higher in February 2012 than in August 2011 (Fig. 10.7). Nevertheless this might also suggest that further downward leaching is prevented. At site WP329, chloride concentrations (1,390 mg kg−1) twice the AFDCPG (1973) and CPDMP (2011) guidelines were only recorded in the surface muddy layer, although measurable sulphate concentrations were noted in the soil (Fig. 10.8). The downward decrease in concentrations in the soil profile and lower concentrations with time suggest dilution and possible associated downward leaching.
At Matsukawa-ura, the tsunami deposit was characterised by a mud layer overlying a sandy deposit at both sites within the inundation limit (Figs. 10.9 and 10.10a). The area was flooded by seawater at least until June 2011, and this was reflected by the presence of extensive salt crusts on the land in February 2012 (Fig. 10.10b), while no salt crusts were visible near Sendai airport at that time. Chloride concentrations were above the AFDCPG (1973) and CPDMP (2011) guidelines in both the muddy and sandy tsunami deposit and the underlying soil, with the highest content recorded at the surface of both sites (12,600 and 12,900 mg kg−1), except in the lowest sandy intervals at site Ma2. The high sulphate (up to 38,000 mg kg−1) (Fig. 10.9) and calcium concentrations suggest that salt residues were dominated by calcium sulphate or gypsum (CaSO4.H2O) in this area, although it does not exclude other salts, such as NaCl and KCl. This is also suggested by the strong positive correlation between these elements (Table 10.2). Beyond the limit of tsunami inundation, chloride concentrations were close to background (18–35 mg kg−1, n = 3).

Stratigraphy, organic content (expressed as loss on ignition LOI (%)), water-leachable (soluble) chloride, bromide, sulphate, sodium and calcium concentrations in tsunami sediment and underlying soil at sites Ma1 (a) and Ma2 (b) in Matsukawa-ura, recorded in February 2012. See Fig. 10.1d for site location. The horizontal dashed line shows the limit between the tsunami deposit and underlying soil, and the vertical dotted line marks 500–700 mg kg−1 chloride, the AFDCPG (1973) and CPDMP (2011) guidelines. Each symbol represents a sample collected at a different depth

(a) Photograph of site Ma1 (labelled WP502) in Matsukawa-ura, showing the salt residues on the mud and rice plant remains, overlying the mud and sand tsunami deposit and soil (taken in February 2012); (b) Photograph of site Ma2 showing the extensive salt crust (taken in February 2012). See Fig. 10.1d for site locations
10.4 Discussion
As reported in Chagué-Goff et al. (2012b), soluble ion concentrations were highest in May 2011, 2 months after the tsunami, mostly where seawater had ponded for a long time, both where the deposit was sand- (~1.5–1.85 km inland) or mud- (~2.9–3.4 km inland) dominated (Fig. 10.2).
Data gathered along the transect north of Sendai airport over four sampling periods from May 2011 to February 2012, 11 months after the tsunami, show that salt concentrations in the tsunami deposit and underlying soil generally decreased with time (Fig. 10.4). This is mostly attributed to rainfall, which probably resulted in dilution and downward and/or lateral leaching of salt, as also reported in previous studies (e.g., Szczuciński et al. 2007; Raja et al. 2009; McLeod et al. 2010; Chagué-Goff et al. 2012b). However, higher concentrations were recorded in algal mats and surface organic-rich mud in February 2012 than in October 2011, despite additional precipitation of ~250 mm between both surveys.
The October survey occurred 2 weeks after Typhoon Roke, which resulted in 330 mm precipitation, and 60 mm of rain also fell during the October sampling (Chagué-Goff et al. 2012b). This is likely to have led to dilution and/or downward leaching of salt at the time. Elevated salt contents at the surface of fine sediment and in algal mats in February 2012 are on the other hand probably attributed to capillary action and evaporation, as the precipitation (snow fall) was only 22 and 44 mm in January and February 2012, respectively (Japan Meteorological Agency 2012).
Winds from the SE and SSE are prevalent in the region (Japan Meteorological Agency, 2012) and are likely to contribute to evaporation and resulting increasing concentration of salts at the land surface. Our data therefore suggest that not only is salt preferentially retained in organic-rich fine sediment, but that the total precipitation is not the only governing factor regarding retention or leaching of salt, and that these processes depend upon variations in precipitation and other climatic parameters. Wind, air temperature, solar radiation, vapour pressure deficit and relative humidity affect evaporation (e.g., Morton 1968), and thus indirectly the retention or leaching of salt. McLeod et al. (2010) indicated that loss of functional drainage following the tsunami could also have affected the rate of salt leaching. As in Aceh, Indonesia, the low topography on the Sendai Plain (Fig. 10.2c) is also likely to result in slow leaching.
Downward leaching of salt occurred more readily in the sandy deposit and/or sandy underlying soil (e.g., WP 325, Fig. 10.5), due to the higher porosity of the material compared to mud (e.g., Szczuciński et al. 2005; Chagué-Goff et al. 2012b). It is however interesting to note that the downward leaching reported by McLeod et al. (2010) in a number of fields in Aceh, resulting in a surficial decrease in salinity associated with an increase at depth, was not observed at any of the sites studied here (Figs. 10.5, 10.6, 10.7 and 10.8).
At site WP327, salt was preferentially retained in the fine organic-rich sediment and underlying soil, at least down to nearly 15 cm depth. The creation of a hard pan by puddling (compacting), harrowing (breaking up the soil) and levelling the soil under wet conditions (e.g., Wopereis et al. 1992) is a common practice in rice farming. It results in a zone of low hydraulic conductivity which helps reduce water loss. Here, the presence of the compact hard pan underneath the rice paddy soil appears to impede downward leaching below this impervious surface and the resulting downward increase in ion concentrations (Fig. 10.7). However, where there is no hard pan, soluble salts might leach further downward, as seen at sites WP325 (Fig. 10.5) and WP329 (Fig. 10.8), and contribute to contamination of groundwater. We measured the ion concentrations in the soil profile down to 20 cm at a few sites, and at various times to assess the temporal changes and effect on the soil. However, further study would be required to ascertain the fate of soluble salts within the deeper soil profile and possible impact on groundwater, in addition to the effect of saltwater intrusion.
With regards to the effect of tsunami inundation on soil salinisation and impact on rice production, our study shows that 11 months after the tsunami (February 2012), the area with chloride concentrations over the guidelines was nearly 1 km long, and ranged mostly between 2.45 km and 3.33 km inland. At the surface of the thin sandy deposit 1.71 km inland, the chloride concentration was also near the guideline values. Thus, this suggests that the area up to 3.33 km inland was still not suitable for rice production in February 2012, and that contamination by salt was still recorded at a depth of nearly 15 cm in the soil profile in some areas (such as at site WP327, 2.45 km inland). Indeed, we found in February 2012 that rice production not only had been halted following the tsunami in 2011, but could not resume before 2013 on rice paddy fields within 3.4 km of the shoreline. This was because the soil electrical conductivity exceeded 0.3 mS cm−1 and the salinity of the groundwater at 4 m depth (1–4 mS cm−1) was also too high to allow rice farming (Mr Sato, pers. comm. 2012; Chagué-Goff et al. 2012b). Remediation measures using freshwater flushing were to be implemented to flush the salt out of the soil within the 3.4 km zone (Mr Sato, pers. comm. 2012). We measured an electrical conductivity of 2 mS cm−1 in irrigation channels at the seaward limit of the remediation zone, and just under 1.3 mS cm−1 landward of it. While it was within the CPDMP (2011) guidelines, which recommend an EC of 2.2 mS cm−1 for paddy water, we observed soy bean crops between 3.4 and 4 km inland, instead of rice crops, during an additional visit at the end of September 2012. This might suggest that although soil salinity was within the recommended AFDCPG (1973) and CPDMP (2011) guidelines as reported in this study (Fig. 10.4d), the quality of surface and/or ground-water was probably still not adequate for rice production.
At Matsukawa-ura, no attempts appeared to have been made to resume rice production at the sites investigated (Ma1 and Ma2, ~1.75 and 2.20 km from the shoreline, and ~0.2 and 0.65 km from the landward edge of Matsukawa-ura lagoon, respectively), although flushing of rice paddy fields was observed further inland in this area. Matsukawa-ura is only ~42 km N of the FDNPP. Joint US/Japan survey data gathered by the Japanese National Nuclear Security Administration and US Department of Energy suggest that Matsukawa-ura was not directly affected by the nuclear disaster, based on 134Cs and 137Cs deposition activities (US Department of Energy 2012). Thus, rice production might be able to resume, once salinity and sodicity have decreased to background levels. However, the high levels recorded nearly 1 year after tsunami inundation, which are probably partly due to the extended period of ponding by seawater, suggest that this area is likely to be unsuitable for rice production for a considerably longer period than near Sendai airport. The extremely high sulphate concentrations recorded there might also inhibit rice cropping, due to the possible conversion of sulphate to sulphide under highly reducing conditions (e.g., as a result of flooding). Thus, rice production might be inhibited due to sulphide toxicity, although previous studies have shown that oxidation around the rice roots might counteract this effect (e.g., De Datta 1981). Further study would be recommended to ascertain the possible adverse effect of excess sulphate on the rice paddy fields.
Co-seismic subsidence of 17–21 cm was reported in the area near Sendai airport (Goto et al. 2011), and it could impede flushing measures and contribute to increased soil salinisation from groundwater. Hulugalle et al. (2009) studied the soil physical properties in Aceh following the 2004 Indian Ocean Tsunami and reported a significant physical degradation of the soil, which can also affect crops. Although the soil physical characteristics were not investigated in this study, tsunami inundation is likely to have had a negative impact, partly due to the high sodicity (e.g., So and Aylmore 1993). High sodicity also affects rice production and the application of gypsum and/or compost in association with flushing is recommended in saline-sodic soils to improve rice yield (e.g., Nayak et al. 2008; Abdel-Fattah 2012). Whether the large amount of calcium sulphate present on the rice paddy fields in Matsukawa-ura might be beneficial is not clear as yet as concentrations might be too high resulting in an ion imbalance over and above the possible conversion to sulphide and resulting sulphide toxicity. Wang et al. (2010) also suggest altering the irrigation water depth to increase rice yield. Therefore, a number of measures might be applied to remediate salinisation of the soil, as well as removing the tsunami deposit if too thick, in order to be able to resume rice production in both areas. In the meantime, alternative farming has been suggested and started, such as the Tohoku cotton project, as cotton is less sensitive to salinisation (Tohoku Cotton Project 2012). Further research is recommended to assess the longer term effect of salinisation due to tsunami inundation on rice growing, as little data are available in temperate climates such as Honshu Island, where rainfall is significantly lower than in tropical regions. Remediation measures should also be tested and carried out.
10.5 Conclusions
Two months after the tsunami salt contamination was significant in areas where seawater had ponded for a long time, independent of the nature of the tsunami deposit (sand or mud). However, data gathered over a period of almost a year after the event show that salt is preferentially retained in organic-rich fine sediment, either at the surface of the deposit or in the soil profile, down to about 15 cm depth. Our data also revealed that although salinisation of the muddy sediment and soil generally decreased with time, it was also dependent on the variability of precipitation and other climatic parameters, which can result in evaporation and concentration near the surface of the deposit. At Matsukawa-ura, where seawater ponded for much longer, salt crusts were still visible in February 2012, and chloride concentrations were well above the guidelines for the establishment of rice seedlings. Salt residues were probably dominated by forms of calcium sulphate. While calcium sulphate is often suggested as remediation for high sodicity, the high concentrations at Matsukawa-ura might result in acute sulphide toxicity if the soil becomes flooded and reducing conditions are established.
While the area with chloride concentrations over the suggested guidelines for the establishment of rice seedlings has decreased since May 2011, it still extended nearly 1 km between 2.45 and 3.33 km near Sendai airport in February 2012, and concentrations near the guideline levels were also recorded at the surface of the tsunami deposit 1.71 km inland. The landward limit corresponds to the area still deemed unsuitable for rice production in 2012. It also appears that conditions were still not suitable for rice crops to resume in 2012 as they were instead replaced by soy beans. Remediation measures are suggested and should be implemented to allow rice production to resume on the Sendai Plain.
References
Abdel-Fattah MK (2012) Role of gypsum and compost in reclaiming saline-sodic soils. J Agric Vet Sci 1:30–38
AFDCPG (Agricultural and Forestry Department, Chiba Prefectural Government) (1973) Handbook of agricultural and forestry pollution, 306 pp (in Japanese)
Association of Japanese Geographers (2011) Map of tsunami inundation reported by Tsunami Damage Team. http://danso.env.nagoya-u.ac.jp/20110311/map/574017Sendaikukou.jpg
Chagué-Goff C, Schneider J-L, Goff JR, Dominey-Howes D, Strotz L (2011) Expanding the proxy toolkit to help identify past events – lessons from the 2004 Indian Ocean tsunami and the 2009 South Pacific tsunami. Earth Sci Rev 107:107–122
Chagué-Goff C, Andrew A, Szczuciński W, Goff J, Nishimura Y (2012a) Geochemical signatures up to the maximum inundation of the 2011 Tohoku-Oki tsunami – implications for the 869AD Jogan and other palaeotsunamis. Sediment Geol 282:65–77
Chagué-Goff C, Niedzielski P, Wong HKY, Szczuciński W, Sugawara D, Goff J (2012b) Environmental impact assessment of the 2011 Tohoku-oki tsunami on the Sendai plain. Sediment Geol 282:175–187
CPDMP (Crop Production Division of Miyagi Prefecture) (2011) Technical note for crops after the Great East Japan Earthquake, 2nd advisory. http://www.pref.miyagi.jp/noenkan/nousansyokuryou/gijyutu-2.pdf (in Japanese)
De Datta SK (1981) Principles and practices of rice production. Wiley, Singapore, 618 pp
DFAT (Australian Department of Foreign Affairs and Trade) (2011) Travel advice for Japan. http://www.smartraveller.gov.au/zw-cgi/view/Advice/Japan. Accessed 19 Apr 2011
DFAT (Australian Department of Foreign Affairs and Trade) (2012) Travel advice for Japan. http://www.smartraveller.gov.au/zw-cgi/view/Advice/Japan. Accessed 30 Jan 2012
FAO (United Nations Food and Agriculture Organization) (2005) Field guide on salinity in Aceh-Draft publication RAP 05. www.fao.org/ag/tsunami/docs/saltwater-guide.pdf. Accessed 8 Feb 2012
Fujikawa T, Okazawa H, Nakamura T, Takeuchi Y, Komamura M (2011) Physical and chemical properties of tsunami deposits in the northeast area of Fukushima prefecture after the Tohoku-Kanto earthquake. Int J GEOMATE 1:44–49
Goto I, Inagaki K (2011) Countermeasures for tsunami-damaged farmlands from salt water by the Great East Japan Earthquake Disaster. Annu Rep Agric Acad Jpn 16:109–122 (in Japanese)
Goto K, Chagué-Goff C, Fujino S, Goff J, Jaffe B, Nishimura Y, Richmond B, Sugawara D, Szczuciński W, Tappin DR, Witter R, Yulianto E (2011) New insights of tsunami hazard from the 2011 Tohoku-Oki event. Mar Geol 290:46–50
Hulugalle NR, Jaya R, Luther GC, Ferizal M, Daud S, Yatiman I, Yufniati ZA, Feriyanti F, Tamrin H, Han B (2009) Physical properties of tsunami-affected soils in Aceh, Indonesia: 2½years after the tsunami. Catena 77:224–231
IAARD (Indonesian Agency for Agricultural Research and Development, Indonesia), NSW DPI (NSW Department of Primary Industries, Australia) (2008) A practical guide to restoring agriculture after a tsunami, 57 pp. http://www.dpi.nsw.gov.au/research/projects/06P302/a-practical-guide. Accessed 3 Jan 2013
Japan Meteorological Agency (2012) Weather, climate & earthquake information. http://www.data.jma.go.jp/obd/stats/data/en/smp/index.html. Accessed 6 Dec 2012
Komai T, Kawabe Y, Hara J, Sakamoto Y, Zhang M (2012) Geochemical survey of tsunami sediments and transport of toxic elements from offshore environment – urgent investigations for earthquake March 11, 2011, Proceedings of the Twenty-second (2012) International Offshore and Polar Engineering Conference: Rhodes, Greece, International Society of Offshore and Polar Engineers (ISOPE), pp 49–53
McLeod M, Slavich P, Irhas Y, Moore N, Rachman A, Ali N, Iskandar T, Hunt C, Caniago C (2010) Soil salinity in Aceh after the December 2004 Indian Ocean tsunami. Agric Water Manag 97:605–613
Mori N, Takahashi T, The 2011 Tohoku Earthquake Tsunami Joint Survey Group (2012) Nationwide post event survey and analysis of the 2011 Tohoku earthquake tsunami. Coast Eng J 54:1250001-1–1250001-27
Morton FI (1968) Evaporation and climate: a study in cause and effect, scientific series no. 4. Inland Water Branch, Department of Energy, Mines and Resources, Ottawa
Nayak AK, Sharma DK, Mishra VK, Minhas PS, Verma CL (2008) Reclamation of saline-sodic soil under a rice–wheat system by horizontal surface flushing. Soil Use Manag 24:337–343
NINS (National Institute of Natural Sciences), National Astronomical Observatory of Japan (2012) Chronological scientific tables. Maruzen CO. LTD, Tokyo, http://www.rikanenpyo.jp/ (in Japanese)
Ohnishi T (2012) The disaster at Japan’s Fukushima-Daiichi nuclear power plant after the March 11, 2011 earthquake and tsunami, and the resulting spread of radioisotope contamination. Radiat Res 177:1–14
Raja R, Chaudhuri S, Ravisankar N, Swarnam T, Jayakumar V, Srivastava R (2009) Salinity status of tsunami-affected soil and water resources of South Andaman, India. Curr Sci 96:152–156
So H, Aylmore L (1993) How do sodic soils behave – the effects of sodicity on soil physical behavior. Aust J Soil Res 31:761–777
SPSS v. 21 (2012) http://www-01.ibm.com/support/docview.wss?uid=swg21608060
Szczuciński W, Niedzielski P, Rachlewicz G, Sobczyński T, Zioła A, Kowalski A, Lorenc S, Siepak J (2005) Contamination of tsunami sediments in a coastal zone inundated by the 26 December 2004 tsunami in Thailand. Environ Geol 49:321–331
Szczuciński W, Niedzielski P, Kozak L, Frankowski M, Ziola A, Lorenc S (2007) Effects of rainy season on mobilization of contaminants from tsunami deposits left in a coastal zone of Thailand by the 26 December 2004 tsunami. Environ Geol 53:253–264
Szczuciński W, Kokociński M, Rzeszewski M, Chagué-Goff C, Cachão M, Goto K, Sugawara D (2012) Sediment sources and sedimentation processes of 2011 Tohoku-Oki tsunami deposits on the Sendai plain, Japan – insights from diatoms, nannoliths and grain size distribution. Sediment Geol 282:40–56
Tohoku Cotton Project (2012) http://www.tohokucotton.com/en/. Accessed 26 Jan 2013
UNEP (United Nations Environment Programme) (2005) After the Tsunami. Rapid environmental assessment, 140 pp. http://www.unep.org/tsunami/reports/TSUNAMI_report_complete.pdf
US Department of Energy (2012) Radiation monitoring data from Fukushima area – 5/13. http://energy.gov/downloads/radiation-monitoring-data-fukushima-area-51311. Accessed 18 Dec 2012
Wang M-M, Wang Z-W, Huang L-H, Ma H-Y, Liu M, Gu X-y (2010) Effect of irrigation water depth on rice growth and yield in a saline-sodic soil in Songnen Plain, China. J Food Agric Environ 8:530–534
Wopereis MCS, Wösten JHM, Bouma J, Woodhead T (1992) Hydraulic resistance in puddled rice soils: measurement and effects on water movement. Soil Tillage Res 24:199–209
Yoshii T, Imamura M, Matsuyama M, Koshimura S, Matsuoka M, Mas E, Jimenez C (2013) Salinity in soils and tsunami deposits in areas affected by the 2010 Chile and the 2011 Japan tsunamis. Pure Appl Geophys 170:1047–1066
Acknowledgements
Collection of samples in February 2012 was carried out when CCG was a visiting professor at the Institute of Seismology and Volcanology, University of Hokkaido, Japan. Brett Rowling and Matthew Dore (ANSTO) are thanked for assisting in sample preparation and analysis. We acknowledge Mr. Sato for his assistance during our field survey in February 2012, and thank the anonymous reviewer for their comments that greatly improved the manuscript.
Author information
Authors and Affiliations
Corresponding author
Editor information
Editors and Affiliations
Rights and permissions
Copyright information
© 2014 Springer Science+Business Media Dordrecht
About this chapter
Cite this chapter
Chagué-Goff, C. et al. (2014). Impact of Tsunami Inundation on Soil Salinisation: Up to One Year After the 2011 Tohoku-Oki Tsunami. In: Kontar, Y., Santiago-Fandiño, V., Takahashi, T. (eds) Tsunami Events and Lessons Learned. Advances in Natural and Technological Hazards Research, vol 35. Springer, Dordrecht. https://doi.org/10.1007/978-94-007-7269-4_10
Download citation
DOI: https://doi.org/10.1007/978-94-007-7269-4_10
Published:
Publisher Name: Springer, Dordrecht
Print ISBN: 978-94-007-7268-7
Online ISBN: 978-94-007-7269-4
eBook Packages: Earth and Environmental ScienceEarth and Environmental Science (R0)