
Abstract
Rapid advances in imaging technology with ever-increasing capabilities of ultrasound transducers, number of detector rows and x-ray tubes in CT, increasing field strength and newer sequences in MRI, and a plethora of highly capable imaging modalities are now available to optimally image the thoracic aorta. Each of these has their advantages and weaknesses and is used not only for the initial assessment of aortopathies but also plays a vital part in serial monitoring, treatment planning, and assessing posttreatment complications. Choice of a particular imaging modality should be guided by the clinical issue at hand and also affected by ease of availability, cost, and field of coverage.
Access provided by CONRICYT-eBooks. Download chapter PDF
Keywords
1 Introduction
2 Imaging Modalities, Methods, and Technical Considerations
2.1 Echocardiography
Transthoracic echocardiography (TTE) is cheap, widely available, and in most cases able to provide good visualization of the aortic root and proximal ascending aorta (pAAo) and to a lesser extent the aortic arch (AoA), descending thoracic aorta (DTAo), and abdominal aorta (AbdAo) especially in adults with challenging echo windows. In addition, TTE also provides concomitant information and assessment of cardiac chambers and other valvular or non-valvular pathologies commonly associated with aortopathy such as bicuspid aortic valve, aortic regurgitations, coarctation of the aorta, etc.
2.1.1 Standard Imaging Planes in TTE
2.1.1.1 Left Parasternal Long-Axis View (PLAX View)
This is the best view (Figs. 6.1a, 6.1b, and 6.1c) for visualizing the aortic root and the proximal ascending aorta. The left lung and sternum often obscure the midportion of the ascending aorta which is best visualized from a higher PLAX echo window one intercostal space up (Figs. 6.2a and 6.2b). The 2015 American Society of Echocardiography (ASE) and European Association of Cardiovascular Imaging (EACI) Guidelines [1] recommended the measurement of the aortic valve annulus (hinge point of the right coronary cusp (RCC) to the fibrous trigone between the left coronary cusp (LCC) and non-coronary cusp (NCC)) at mid/peak systole using the inner edge to inner edge (I-I) convention such as used by MDCT.

PLAX zoom view at peak/mid-systole to measure the aortic annulus and LVOT

PLAX zoom view at end diastole to measure the SOV and STJ

High PLAX view at end diastole to measure the proximal and mid-ascending aorta

Simultaneous biplane (X-plane) orthogonal images from the 3D matrix transducer confirming that the measured PLAX aortic annulus dimension is through the correct anteroposterior (AP) plane from the right coronary cusp (RCC) to the fibrous trigone between the left coronary cusp (LCC) and non-coronary cusp (NCC)

Incorrect aortic annulus measurement taken from an eccentric oblique plane
However, for the measurements of the aortic root and the rest of the aorta, the recommendation was to use back the leading-edge-to-leading-edge (L-L) convention at end diastole in a plane perpendicular to the long axis of the aorta as the currently available long-standing reference values for the aorta (Table 6.1) were based on the L-L convention [2–4].
Aortic root dilatation at the level of the Sinus of Valsalva (SOV) is defined as greater than 95 % confidence interval of the distribution in a large reference population. This varies according to different age range (from children to adults above the age of 40) and their BSA; the commonly used reference range is published by Roman, et al. [2].
In addition, direct two-dimensional (2D) measurements of the aorta are now preferable to M-mode measurements because of possible inaccuracies arising from cardiac motion during acquisition of the M-mode images.
2.1.1.2 Left Parasternal Short-Axis View (PSAX View)
2.1.1.2.1 Aortic Annulus
Simultaneous biplane (X-plane) orthogonal images from the 3D matrix transducer using an initial PSAX view can be helpful for confirmation that the measured PLAX aortic annulus dimension is through the correct anteroposterior (AP) plane from the right coronary cusp (RCC) to the fibrous trigone between the left coronary cusp (LCC) and non-coronary cusp (NCC) as depicted in Fig. 6.2a. Errors can arise from incorrect measurements taken from an eccentric oblique plane as shown in Fig. 6.2b. In some patients, the aortic root is more elliptical in structure, and the AP plane dimension is often smaller than the medial–lateral dimension.
2.1.1.2.2 Aortic Root
Not uncommonly the dilatation at the level of SOV may be eccentric involving one particular cusp more than others. The SAX view allows the direct measurement of the SOV from one cusp to another. Data from other imaging modalities such as CMR has shown that measuring the diameter of the SOV using the sinus to sinus method (from the middle of one cusp to the middle of another cusp) resulted in a mean 2–3 mm larger diameter than the sinus to commissure method (from the middle of one cusp to the commissure between the two cusps) [5]. It is important to report where the largest aortic SOV dimension was obtained in the serial follow-up of patients with dilated aortic root for meaningful comparisons to previous and for future echo follow-up studies.
2.1.1.2.3 Other Echo Views
The aortic root and the proximal ascending aorta may also be visualized in other echo windows such as the apical long axis (apical three chamber) as shown in Fig. 6.3a and apical five chamber (Fig. 6.3b). The mid- to distal part of the ascending aorta and the aortic arch can be visualized in the modified suprasternal view (transducer tilted slightly to the right), and the distal ascending aorta, the aortic arch, and the descending thoracic aorta are best visualized in the suprasternal window as shown in Fig. 6.3c and 6.3d, respectively. The abdominal aorta (Fig. 6.3e) is best seen from the subcostal view to the left of the inferior vena cava in sagittal (superior–inferior) alignment.

(a–e) View of different aortic segments from the various echo windows such as the apical three-chamber view (a), apical five-chamber view (b), modified suprasternal view (c), suprasternal view (d), and subcostal view (e)
2.2 Transesophageal Echocardiography (TEE) and Three-Dimensional (3D) Echocardiography in Aortopathy
The most important TEE views are the mid-esophageal TEE long-axis view (between 120 and 150°) and the short-axis views (30–60°) to visualize the aortic valve, aortic root, and proximal ascending aorta as shown in Figs. 6.4a and 6.4b, respectively. With minimal manipulation and rotation of the transducer array, a continuum of transverse and longitudinal image planes of the descending thoracic aorta can be obtained as shown in Fig. 6.4c (simultaneous transverse and longitudinal plane of the descending thoracic aorta using X-plane). The TEE probe can then be advanced or withdrawn to image the lower thoracic/upper abdominal aorta or the upper thoracic aorta, respectively. To image the aortic arches, the TEE probe is rotated posteriorly and withdrawn slowly from the mid-esophagus at 0°. The right brachiocephalic and the left common carotid branches are difficult to see, but the left subclavian artery takeoff can usually be seen.

High TEE long-axis view at 120° showing the aortic valve, the aortic root, and the ascending aorta

High TEE short-axis view at 35° showing the en face view of the aortic valve

Deep transgastric view at 99° showing the aortic valve, aortic root, and proximal Asc Ao in a patient with post bioprosthetic aortic valve replacement for severe aortic stenosis
It is important to be wary of occasional reverberation artifacts in the ascending thoracic aorta presenting as linear horizontal lines due to reverberation from the motion of the posterior wall of the ascending aorta as shown in Fig. 6.4d. Extra precaution should also be taken when measuring the descending thoracic aortic diameter (transverse plane) in patients with tortuous aortas as the transverse cut is often in an oblique plane with resultant overestimation of the aortic diameter.

Transverse and longitudinal plane of the descending thoracic aorta
TEE has added advantage over TTE in imaging the aorta because of its superior image quality (especially in adult patients with poor windows) and the ability to image the aortic valve, aortic root, and nearly all the ascending and descending thoracic aorta except for a blind area (area between the distal ascending aorta and the proximal aortic arch due to interposition of the trachea and right bronchus).
A summary of the different echo modalities and windows for optimal visualizations of the various aortic segments are as shown in Table 6.2.
Real-time three-dimensional imaging of the aortic root with cropping along the long axis may help in understanding the true shape, size, and dilatation of the LVOT, aortic annulus, SOV, and Sino-tubular junction (STJ).
2.3 Pulse Wave, Continuous Wave, and Tissue Doppler Echocardiography in Aortopathy
Pulse wave (PW) Doppler allows measurement of blood velocity at a single point and may be used (in the absence of aliasing) to confirm and differentiate multiple areas of discrete stenosis such as subaortic, valvular, or supra-aortic stenosis. It is also helpful in differentiating the severity of aortic regurgitation by looking for the presence of pan-diastolic flow reversal in the thoracic or abdominal aorta. Continuous wave (CW) Doppler is used in the assessment of peak pressure gradient across aortic coarctation.
TDI of the upper ascending aortic wall in early diastole for evaluation of aortic elastic properties is possible but to date remains more in the research arena and not widely used clinically [6].
2.4 Computed Tomography (CT)
Multi-detector row CT (MDCT) is one of the most used techniques in the assessment of aortopathies. Its major advantages are excellent spatial and temporal resolution, widespread availability, and ability to image the entire aorta within seconds. Furthermore, it elegantly shows the aortic lumen and wall, resulting in precise and reproducible measurements. Current scanners with higher detector rows allow acquisition of isotropic volumetric datasets, which can be reconstructed in any plane for optimal display and measurements of a structure.
2.4.1 CT Angiography
CT Angiography (CTA) acquisition uses iodinated contrast medium (ICM) delivered at rate of 3–5 mL/s by a power injector and usually followed by a saline bolus. The injection site (right vs left, arm vs leg vein) needs consideration, particularly when assessing arch pathologies or Fontan pathways. Optimal contrast enhancement in area of interest is ascertained by “bolus tracking” or “test injection” methods.
2.4.2 ECG Gating
On conventional non-ECG-gated CT, outline of the ascending aorta is indistinct due to cardiac motion, resulting in inaccurate measurements and appearance of “pseudo-dissection.” ECG “gating” eliminates these artifacts and also allows proximal coronary arterial assessment in the same setting. ECG gating can be “retrospective” or “prospective,” of which the latter results in significantly lower radiation doses [7].
2.4.3 Challenges and Comparison with Other Modalities
Main drawbacks of CT are the need for ICM administration and ionizing radiation exposure. ICM may cause allergic reactions and need cautious use in patients with renal impairment. Ionizing radiation exposure in CT may limit its use in younger people, especially when serial follow-up is needed. Various newer dose reduction techniques are used in modern CT scanners to significantly reduce effective dose, some of which include prospective ECG triggering, ECG-based tube current modulation, lower peak kilovoltage (kVp), and iterative reconstruction algorithms [8, 9]. Compared to other modalities such as TTE and MRI, CT lacks flow assessment capabilities which are useful in assessment of aortic insufficiency and shunts.
2.4.4 Measurements
There is still some inconsistency in methods used in different modalities in measuring the aorta, like leading edge to leading edge used in TEE [1] vs external diameters in CT/MRI [4] and sinus to sinus vs sinus to commissure at SOV level. It is thus important to note the method used and follow it on subsequent studies for comparison. Standardized levels for measurements of aortic diameters are shown in Fig. 6.5, adapted from Hiratzka et al. The upper limits of normal are 3.7 cm for the aortic root at the sinuses, 3.6 cm for the ascending aorta, and 2.5 cm for the descending thoracic aorta by CT [1, 10, 11].

Anatomic landmarks for standardized reporting of diameters of the aorta (Adapted from Hiratzka et al.)
2.5 Magnetic Resonance Imaging (MRI)
MRI is well suited for the diagnosis of aortic diseases, given its ability to delineate the intrinsic contrast between blood flow and vessel wall. Key indicators for decision-making can be reliably obtained through MRI. Spin-echo black-blood sequences outline the shape and diameter and show intimal flaps nicely [12]. Gradient echo sequences show changes in the diameters during the cardiac cycle and blood flow turbulences. Contrast-enhanced MRI can show the aorta and its branches rapidly, without the need for ECG gating. Gadolinium-enhanced sequences are used to differentiate slow flow from thrombus in the false lumen.
2.5.1 Quantitative Analysis
Multilevel measurements of aortic diameters through MRI are obtained on double oblique multi-planar images perpendicular to blood flow at standardized levels [4]. See Fig. 6.5, adapted from Hiratzka, et al. These measurements should be obtained at diastole if possible. The diameters of sinuses or sinotubular junction may not be measured on un-gated images since motion artifacts can lead to blurring and may result in the under- or overestimation of the diameters. These require ECG-gated acquisitions, either from contiguous stack of cines aligned to transect the axis of the aortic root, or three-dimensional balanced steady state-free precession (b-SSFP) images acquired in late diastole. Three-dimensional b-SSFP gives sharp-edge profiling and is easy to acquire and post process. It also shows good interobserver correlation [13]. Volume-rendered techniques may be used for demonstration purposes, but not for detailed analysis.
2.5.2 Analysis of the Aortic Wall
Assessment of the aortic wall thickness and irregularities is best achieved by reviewing the turbo spin-echo images.
2.5.3 Advantage over Computed Tomography
Cardiac MRI avoids the use of radiation in young patients, who may require repeated scans over their lifetime. Its main advantage is its ability to allow tissue characterization and the analysis of flow and dynamic movement of cardiovascular structures.
2.5.4 Challenges
The usual technical difficulties faced when performing cardiac MRI examinations are further amplified in young adults with congenital heart disease. Optimal image quality may be compromised because of the smaller size of structures and the reduced time for image acquisition due to inability or difficulty when breath-holding for patients who have intellectual disability.
Due to the variety of morphology presented to us, it is advised that a trained cardiologist or radiologist be present during the scan so that the appropriate planning of the sequences and imaging planes can be done during the visit.
Potential of gadolinium nephrotoxicity appears to be lower than for CT contrast agents and should be avoided with a glomerular filtration rate of less than 30 ml/min/1.73 m2.
2.5.5 Spatial Resolution
Smaller fields of views (FOVs) and the use of thinner slice are required to image small anatomical structures. The resultant reduction in signal-to-noise ratio can be compensated by increasing the number of acquisitions, removing parallel imaging features, or using a coarser matrix.
2.5.6 Strategies to Reduce Motion Artifact
This can be overcome by using the following techniques: manual shimming techniques, increasing the number of acquisitions, respiratory compensation methods, or acquiring data using real-time imaging sequences.
2.5.7 Consideration of Prior Implants
The presence of implants and devices has been evaluated extensively in scanners with static magnetic fields of 1.5 tesla or less. In addition to the challenges posed due to distortion of the image around the implant, deleterious effects such as heating, dislodgement, and acoustic damage must also be considered. These effects can be further amplified if scanning is done in a 3-tesla environment. Further information specific to the safety of implants can be obtained through “The LIST” found at www.MRIsafety.com.
3 Imaging of the Aorta in Specific Congenital Heart Disease
3.1 Marfan Syndrome
3.1.1 Echo
TTE is the main imaging modality for the diagnosis and follow-up of patients with Marfan syndrome where the dilatation of the aorta occurs mainly in the aortic root (Fig. 6.6a, b) at the level of the SOV with relative sparing of the STJ and proximal ascending aorta. An aortic root z-score (at the level of the SOV) greater than 2 is one of the major Ghent criteria needed for diagnosis [14].

(a, b) PLAX view (a) and PSAX view (b) showing dilated aortic root involving mainly the SOV (onion shaped) with relative sparing of the STJ and Asc Ao which is typical for Marfan syndrome
ASE 2015 guidelines [1] recommend an annual follow-up echo assessment for dilated aortic root <45 mm and six monthly echo for aortic root > 45 mm. Annual TTE for follow-up after aortic root replacement is also recommended.
TTE is also useful for looking at other associated complications arising from dilated aortic root such as aortic regurgitation, aortic dissection, and other cardiac lesions such as mitral valve prolapse (Fig. 6.7), mitral regurgitation, mitral annular calcification in patients aged less than 40, dilatation of the pulmonary artery, etc. Nollen et al. have shown that in some Marfan patients with dilated aortic root, there may be concomitant dilatation in their pulmonary arteries with the dilatation occurring mainly at the pulmonary root level rather than the main pulmonary trunk [15].

Myxomatous mitral valve with mitral valve prolapse in a patient with Marfan syndrome
In Marfan patients presenting with acute chest pain, TEE is more sensitive than TTE for the diagnosis of aortic dissection (Fig. 6.8a, b) and for visualization of the dissection flap, but TTE can also provide a quick and immediate assessment of any significant complications such as aortic regurgitation, pericardial effusion or hemopericardium, regional wall motion abnormalities due to compromised coronary artery flow from dissection flap, etc.

(a, b) Type A aortic dissection in a Marfan syndrome patient, with flap seen in the ascending aorta (a) and descending thoracic aorta (b)
3.1.2 CT
CT demonstrates typical aortic root dilatation (Fig. 6.9a, b) as seen on TTE. In addition, CT readily shows acute complications such as dissection (Fig. 6.9c, d), periaortic hematoma and hemopericardium in aortic rupture, and extension of dissection flap into coronaries. Systemic nonvascular imaging findings such as pectus, kyphoscoliosis, dural ectasia, etc. can also help suggest presence of underlying connective tissue disorder [1]. Aortic insufficiency, which results from a dilated root, is better assessed by TTE/MRI.

(a–d) Coronal thick MIP (a) and VRT (b) images from ECG-gated CT aortogram in a Marfan syndrome patient showing dilated aortic sinuses with relative sparing of the Asc Ao. Sagittal MPR (c) and VRT (d) CT images from another Marfan patient showing mildly dilated aortic sinuses (* in c) with type B aortic dissection (arrow c)
3.1.3 Cardiac MRI
The mechanism and degree of aortic regurgitation can be determined. In addition to quantifying aortic dilatation or dissection (Fig. 6.10), including the identification of the true and false lumen (Fig. 6.11), additional information can be obtained, e.g., presence of dural ectasia, left ventricular volumes and systolic function, and differentiation from Loeys–Dietz syndrome thorough the presence of tortuous head, neck, and arch vessels.

Extent of dissection flap (shown by arrow) in a patient with Marfan syndrome

Identification of the smaller true lumen (*) with correlation from velocity-encoded images
3.2 Bicuspid Aortic Valve
3.2.1 Echo
BAV is the most common congenital heart defects in the adult ACHD population, and bicuspid aortopathy is present in 20–84 % of these patients [16, 17]. The pattern of aortic dilatation in BAV is often diverse, affecting some or nearly all of the aortic segments from the aortic root to the aortic arch. Valvular lesions such as aortic stenosis or aortic regurgitation and coarctation of the aorta are commonly associated and may be present in varying degree of severity. Coronary artery anomalies such as anomalous origin of the left circumflex artery from the right coronary cusp may also occur, and hence attempt should be made to visualize and report the origin of the left and right coronary arteries in patients with BAV.
TTE can help to identify the types of BAV based on fusion patterns. The most common fusion pattern seen in BAV involves the right and left cusps (R-L fusion pattern, Type 1 typical pattern) and less commonly fusion of the right and non-coronary cusps (R-N fusion pattern, Type 2 atypical pattern). The least common pattern is the type involving the fusion of the left and non-coronary cusps (L-N fusion pattern, Type 3) as shown in Fig. 6.12. Sometimes, there is no raphe and the leaflets may be asymmetrical in size.

Different BAV phenotypes
Type 1 pattern is associated with aortic stenosis and dilatation of the tubular ascending aorta (predominantly along its convex segment). Type 2 pattern involves mainly the tubular ascending aorta with extension into the transverse aortic arch and relative sparing of the aortic root. Type 3 is rare, associated with aortic regurgitation and involving mainly the aortic root only with sparing of the tubular ascending aorta and aortic arch [16].
In BAV patients with dilated aorta <45 mm and no family history of aortic dissection, annual serial echocardiogram is recommended. If the aorta is >45 mm, a shorter six monthly follow-up is advisable. However, in patients with stable nonprogressive aortic dilatation, TTE follow-up for the aortopathy may be individualized [1].
3.2.2 CT
BAV phenotypes may predict associated patterns of aortic dilatation. Fazel et al. [18] have described four distinct patterns of aortic dilatation in patients with BAVs with dilatation of the tubular ascending aorta and SOV occurring more frequently. Dilatation of the aortic arch and descending thoracic aorta can also occur but is less common [1]. Patients with BAVs may also have coexisting coronary artery anomalies and coarctation [1] which should always be looked for.
3.2.3 Cardiac MRI
The degree of aortic dilatation or dissection and presence of coarctation can be determined. Cardiac MRI will allow views of the aortic valve (Fig. 6.13), presence of aortic regurgitation (Fig. 6.14), and aorta to be obtained without interference from calcification. A study of patients with confirmed BAV found that 10 % of the patients were misidentified as having tricuspid valve using transthoracic echocardiogram, and 28 % had a nondiagnostic study, in comparison with 4 % and 2 %, respectively, with cardiac MRI [19]. The use of sophisticated 4D flow cardiac MRI in patients with fusion of the right and left coronary leaflets has been shown to produce a right-anteriorly directed helical systolic flow jet with marked peripheral skewing toward the ascending aorta convexity [20], which may explain the larger aortic root dimension and asymmetric dilatation of the mid-ascending aorta.

(a, b) Asymmetric dilatation of the aortic sinuses in a patient with bicuspid aortic valve

Presence of aortic regurgitation (arrow) in a patient with bicuspid aortic valve
3.3 Coarctation of the Aorta
3.3.1 Echo
In aortic coarctation, the narrowing of the aorta most commonly occurs just distal to the left subclavian artery in the juxta-ductal region. CoA is also associated with a form of vasculopathy resulting in higher risk for aneurysmal formation in the ascending aorta, at the site of previous CoA repair, and risk for intracranial aneurysm. BAV is common in CoA patients and may be present in >50 % of these patients.
Echo evaluation of CoA patients should include the following:
-
Echo measurements of all the segments of the aorta
-
Evaluation of CoA severity at the descending thoracic aorta with CW Doppler to record peak CoA gradient and presence of diastolic tail (Fig. 6.15a)
Fig. 6.15a 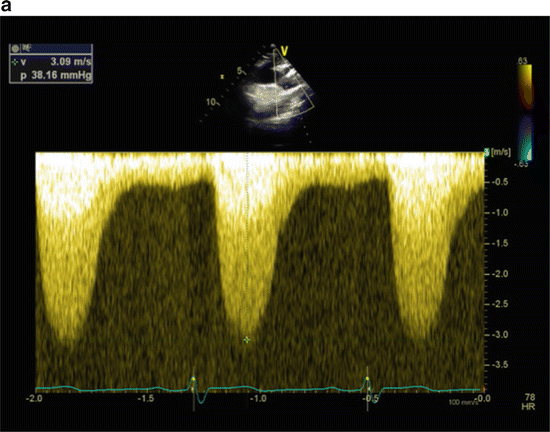
CW Doppler of a patient with CoA demonstrating a peak gradient of 38 mmHg and a long diastolic tail with end-diastolic velocity of 0.5 m/s
-
PW or CW Doppler at the abdominal aorta (diaphragmatic level) to see the presence of continuous systolic and diastolic flow suggesting systolic and diastolic gradients across a tight CoA or continuous flow from the presence of multiple collaterals due to tight CoA (Fig. 6.15b) [21]
Fig. 6.15b 
CW Doppler of a patient with continuous systolic and diastolic flow at the abdominal aortic level
-
Evaluation of aortic valve for bicuspid aortic valve and aortic stenosis or regurgitation


3.3.2 CT
Both CT and MRI show site and length of CoA segment, degree of narrowing, extent of collaterals (Fig. 6.16a), and associations such as ascending aortopathy-related dilatation and BAV [1]. MRI, however, provides additional coarctation and collateral flow-related information. Posttreatment complications such as recurrent coarctation, dissection, and aneurysm formation at coarctation repair site (Fig. 6.16b, c), and patients who may have an ascending to descending aortic bypass graft (Fig. 6.16d) are well assessed.

Thick MIP images showing post-ductal CoA (arrow) with prominent and tortuous intercostal and internal mammary (*) arteries

Coronal MPR CT image (b) in a post CoA repair patient showing a small aneurysm at the post repair site (arrow in b) and dilatation involving the SOV and ascending aorta (* in b). VRT (c) and coronal MPR (d) images from a different post CoA repair case show a large complex aneurysm at repair site in arch (arrow c) and a patent jump graft (* in d) from the ascending to abdominal aorta
3.3.3 Cardiac MRI
Multi-planar reconstruction of acquired 3D images allows for accurate assessment of the diameter of the coarctation site (see Fig. 6.17). Complex anatomy can also be depicted using 3D-volume rendering (see Fig. 6.18).

Measurement of the diameter of the coarctation site using multi-planar reconstruction with 3D images. Arrow depicts dephasing due to the tight coarctation

Volume-rendered image of a patient who is status post repair of a tight coarctation segment with a jump graft. Notice the patent jump graft (*) and atretic left subclavian artery (white arrow)
The presence and degree of collaterals can be determined. The peak coarctation velocity can be measured, and the presence of diastolic prolongation of forward flow can be shown.
Velocity-encoded cine MR imaging has shown great promise for the functional assessment of hemodynamic compromise in aortic coarctation. Using this phase contrast technique, a magnetic gradient is used to phase encode the velocity of flow [22]. Data obtained from through-plane acquisitions can be used to measure peak flow velocity (v) across the area of maximal narrowing. The pressure gradient can be estimated using the modified Bernoulli eq. 4 (v)2. A study suggests a pressure gradient of 15 mmHg obtained through this method as a threshold for timely intervention [23]. Velocity-encoded cine MR imaging allows the measurement of blood from the heart and great vessels as well as the quantification of collateral flow, pressure gradients, stenosis, and flow dynamics. This technique allows the ability to visualize the moving anatomy with high spatial resolution and accuracy without the use of radiographic contrast agents.
The direct depiction of enlarged collateral vessels is a reliable indicator of the hemodynamic significance of aortic coarctation [24]. The presence of retrograde blood flow through the intercostal arteries toward the descending aorta suggests collateral flow. The volume of collateral perfusion to the lower body can be obtained by determining the amount of blood flow increase from the proximal to the distal descending aorta [25].
3.4 Repaired Tetralogy of Fallot
3.4.1 Echo
In TOF patients, dilatation of the aorta occurs more frequently in the proximal aortic root comprising the aortic annulus and SOV (Fig. 6.19a) and to a lesser extent the distal portion comprising the sinotubular junction and proximal ascending aorta (Fig. 6.19b) [26]. In this study by Chong et al., aortic root dilatation correlated with increased aortic stiffness and decreased aortic strain and distensibility.

(a, b) PLAX view showing dilatation involving the SOV and STJ (a) and also the proximal ascending aorta (b) in an adult post-op TOF patient
In the largest cross-sectional multicenter study on aortic dilatation in TOF patients to date, Mongeon et al. reported the prevalence of aortic root dilatation at 28.9 % if an absolute cutoff value of ≥40 mm at level of SOV was used, but prevalence was only 6.6 % if an observed-to-expected aortic root diameter cutoff ratio of >1.5 was used instead. The prevalence of aortic root dilatation ≥45 mm was 9.7 % and that of aortic root diameter ≥50 mm was 2.3 %. In addition, the overall prevalence of moderate or severe aortic regurgitation in this study was low at 3.5 %. Right-sided aortic arch and age at repair were not associated with aortic root dilatation by multivariate analysis, and no independent predictor was identified to predict aortic root dilatation [27].
3.4.2 CT
Aortic root and ascending aorta dilatation (Fig. 6.20a, b), if present, are as well assessed in MRI.

(a, b) Axial (a) and VRT (b) images from an adult post-op TOF patient showing dilatation involving the SOV as well as proximal ascending aorta (Note RVOT repair site indicated by (*) and also good delineation of the proximal coronary arteries in this ECG-gated study)
3.4.3 Cardiac MRI
In addition to quantifying the presence of a right aortic arch (Fig. 6.21), aortic root dilatation, or aortic valve regurgitation (Figs. 6.22a and 6.22b), additional information can be obtained, e.g., left ventricular volumes and systolic function and the presence of additional ventricular septal defects.

Right aortic arch in a patient with repaired tetralogy of Fallot

Asymmetric dilatation of the left coronary aortic sinus (*) in a patient with repaired tetralogy of Fallot

Flow analysis showing severe aortic regurgitation (white arrow)
3.5 Status Post-arterial Switch for d-Transposition of the Great Vessels
3.5.1 Echo
In post-arterial d-TGA switch patients, echo is commonly performed to assess for neo-pulmonary stenosis or regurgitation, supra-aortic stenosis, neo-aortic regurgitation, and neo-aortic root dilatation (Fig. 6.23a, b). Post Lecompte procedure and echo imaging of the anteriorly displaced neo-pulmonary valve and main and branch pulmonary arteries are often inadequate due to limited echo windows.

(a, b) Patient with dilated aortic root (a) and ascending aorta (b) post-arterial switch operation
Neo-aortic root dilatation can occur as a result of the size discrepancy of the great arteries post-arterial switch (ASO). Risk factors for the development of neo-aortic root dilatation include older age at time of ASO, presence of VSD, bicuspid pulmonic valve, previous pulmonary artery banding, and higher neo-aortic root/ascending aorta ratio [28]. There is however no clear association with acute aortic dissection or increased mortality [29].
Co-Vu et al. reported neo-aortic root dilatation with z-scores of ≥2.5 in 66 % of ASO patients, and the root diameter z-score increased at an average rate of 0.08 per year after ASO. Freedom from neo-aortic root dilatation at 1, 5, 10, and 15 years after ASO was 84 %, 67 %, 47 %, and 32 %, respectively. At least moderate degree of neo-aortic valve regurgitation was present in 14 % of ASO patients, and neo-aortic root dilatation was a significant risk factor for this [30].
3.5.2 CT
Post-arterial switch relationship of the great vessels, dilatation of neo-aortic root (Fig. 6.24a, b), and presence of neo-aortic or neo-pulmonic stenosis are well demonstrated.

(a, b) Axial images showing relationship of the great vessels and dilated SOV in a patient post-arterial switch operation for d-TGA
3.5.3 Cardiac MRI
The relationship of the great vessels can be better appreciated through cardiac MRI (see Fig. 6.25). It allows identification of dilatation of the ascending aorta (often at sites of coronary button transfer) and the presence of neo-aortic stenosis or supra-valvular aortic stenosis.

Relationship of the great vessels post-arterial switch. Notice the kinking of the branch pulmonary arteries near the bifurcation (*)
3.6 Miscellaneous
3.6.1 Status Post Fontan Palliation for Hypoplastic Heart Disease
3.6.1.1 Echo
Aortic dilatation in Fontan patients (Fig. 6.26a, b) may occur when the aortic valve is bicuspid or when Fontan completion is late resulting in prolong volume loading and hemodynamic stress through this single outlet trunk. In post Fontan patients born with hypoplastic left heart syndrome (HLHS), the native pulmonary valve would become the neo-aortic valve which had to withstand systemic pressure. Concomitant surgical intervention in HLHS such as patch augmentation of the ascending aorta may further increase the risk of aortic dilatation.

(a, b) Dilated aortic root mainly involving the SOV (a) with relative sparing of the ascending aorta (b) in a patient with post-op Fontan. The great arteries are transposed with the aorta anterior to the pulmonary artery as shown in b
Cohen et al. reported that in a median 9-year follow-up of post Fontan HLHS patients, their neo-aortic root continued to dilate out of proportion to body size, with 98 % of patients having a root z-value of >2 [31].
Very few case reports of progressive neo-aortic root dilatation progress to requiring surgical intervention, but regular follow-up is required when aortic dilatation occurs [32, 33].
3.6.1.2 CT
CT provides adequate anatomical assessment for stenosis or thrombus formation in the Fontan pathways as well as aortic dilatation. When assessing Fontan pathway with contrast-enhanced CT, adequate opacification of both limbs of pathway may be tricky and will need either simultaneous injection of contrast through arm and leg veins or acquisition of images in early and delayed phases [34].
3.6.1.3 Cardiac MRI
Contrast-enhanced or 3D MRI allows for assessment of the arch reconstruction for residual obstruction. It also allows for characterization of the major aortopulmonary collateral arteries (MAPCAs).
4 Summary
Due to easy accessibility and availability of expertise, echocardiography remains the key tool for initial assessment of the aorta in patients with congenital heart disease. However, as echo dropouts remain a challenge, additional information, vital to the decision-making in clinical care, have to be acquired through cardiac CT and MRI. Each modality carries its pros and cons, and the clinician will need to decide how best to utilize each modality to its fullest.
References
Goldstein SA, Evangelista A, Abbara S, Arai A, Asch FM, Badano LP, Bolen MA, Connolly HM, Cuellar-Calabria H, Czerny M, Devereux RB, Erbel RA, Fattori R, Isselbacher EM, Lindsay JM, McCulloch M, Michelena HI, Nienaber CA, Oh JK, Pepi M, Taylor AJ, Weinsaft JW, Zamorano JL, Dietz H, Eagle K, Elefteriades J, Jondeau G, Rousseau H, Schepens M (2015) Multimodality imaging of diseases of the thoracic aorta in adults: from the American Society of Echocardiography and the European Association of Cardiovascular Imaging: endorsed by the Society of Cardiovascular Computed Tomography and Society for Cardiovascular Magnetic Resonance. J Am Soc Echocardiogr 28(2):119–182
Roman MJ, Devereux RB, Kramer-Fox R, O’Loughlin J (1989) Two-dimensional echocardiographic aortic root dimensions in normal children and adults. Am J Cardiol 64(8):507–512
Vasan RS, Larson MG, Benjamin EJ, Levy D (1995) Echocardiographic reference values for aortic root size: the Framingham Heart Study. J Am Soc Echocardiogr 8(6):793–800
Hiratzka LF, Bakris GL, Beckman JA, Bersin RM, Carr VF, Casey DE Jr, Eagle KA, Hermann LK, Isselbacher EM, Kazerooni EA, Kouchoukos NT, Lytle BW, Milewicz DM, Reich DL, Sen S, Shinn JA, Svensson LG, Williams DM, American College of Cardiology F, American Heart Association Task Force on Practice G, American Association for Thoracic S, American College of R, American Stroke A, Society of Cardiovascular A, Society for Cardiovascular A, Interventions, Society of Interventional R, Society of Thoracic S, Society for Vascular M (2010) 2010 ACCF/AHA/AATS/ACR/ASA/SCA/SCAI/SIR/STS/SVM guidelines for the diagnosis and management of patients with thoracic aortic disease: executive summary. A report of the American College of Cardiology Foundation/American Heart Association Task Force on Practice Guidelines, American Association for Thoracic Surgery, American College of Radiology, American Stroke Association, Society of Cardiovascular Anesthesiologists, Society for Cardiovascular Angiography and Interventions, Society of Interventional Radiology, Society of Thoracic Surgeons, and Society for Vascular Medicine. Catheter Cardiovasc Interv 76(2):E43–E86
Burman ED, Keegan J, Kilner PJ (2008) Aortic root measurement by cardiovascular magnetic resonance: specification of planes and lines of measurement and corresponding normal values. Circ Cardiovasc Imaging 1(2):104–113. doi:10.1161/CIRCIMAGING.108.768911
Suh SY, Kim EJ, Choi CU, Na JO, Kim SH, Kim HJ, Han SW, Chung SM, Ryu KH, Park CG, Seo HS, Oh DJ (2009) Aortic upper wall tissue Doppler image velocity: relation to aortic elasticity and left ventricular diastolic function. Echocardiography 26(9):1069–1074. doi:10.1111/j.1540-8175.2009.00910.x
Gutstein A, Wolak A, Lee C, Dey D, Ohba M, Suzuki Y, Cheng V, Gransar H, Suzuki S, Friedman J, Thomson LE, Hayes S, Pimentel R, Paz W, Slomka P, Berman DS (2008) Predicting success of prospective and retrospective gating with dual-source coronary computed tomography angiography: development of selection criteria and initial experience. J Cardiovasc Comput Tomogr 2(2):81–90
Poll LW, Cohnen M, Brachten S, Ewen K, Modder U (2002) Dose reduction in multi-slice CT of the heart by use of ECG-controlled tube current modulation (“ECG pulsing”): phantom measurements. ROFO Fortschr Geb Rontgenstr Nuklearmed 174(12):1500–1505
Leschka S, Stolzmann P, Schmid FT, Scheffel H, Stinn B, Marincek B, Alkadhi H, Wildermuth S (2008) Low kilovoltage cardiac dual-source CT: attenuation, noise, and radiation dose. Eur Radiol 18(9):1809–1817. doi:10.1007/s00330-008-0966-1
Freeman LA, Young PM, Foley TA, Williamson EE, Bruce CJ, Greason KL (2013) CT and MRI assessment of the aortic root and ascending aorta. AJR Am J Roentgenol 200(6):W581–W592. doi:10.2214/AJR.12.9531
Lin FY, Devereux RB, Roman MJ, Meng J, Jow VM, Jacobs A, Weinsaft JW, Shaw LJ, Berman DS, Gilmore A, Callister TQ, Min JK (2008) Assessment of the thoracic aorta by multidetector computed tomography: age- and sex-specific reference values in adults without evident cardiovascular disease. J Cardiovasc Comput Tomogr 2(5):298–308
Holloway BJ, Rosewarne D, Jones RG (2011) Imaging of thoracic aortic disease. Br J Radiol 84(Spec No 3):S338–S354. doi:10.1259/bjr/30655825
Potthast S, Mitsumori L, Stanescu LA, Richardson ML, Branch K, Dubinsky TJ, Maki JH (2010) Measuring aortic diameter with different MR techniques: comparison of three-dimensional (3D) navigated steady-state free-precession (SSFP), 3D contrast-enhanced magnetic resonance angiography (CE-MRA), 2D T2 black blood, and 2D cine SSFP. J Magn Reson Imaging 31(1):177–184. doi:10.1002/jmri.22016
Loeys BL, Dietz HC, Braverman AC, Callewaert BL, De Backer J, Devereux RB, Hilhorst-Hofstee Y, Jondeau G, Faivre L, Milewicz DM, Pyeritz RE, Sponseller PD, Wordsworth P, De Paepe AM (2010) The revised Ghent nosology for the Marfan syndrome. J Med Genet 47(7):476–485. doi:10.1136/jmg.2009.072785
Nollen GJ, van Schijndel KE, Timmermans J, Groenink M, Barentsz JO, van der Wall EE, Stoker J, Mulder BJ (2002) Pulmonary artery root dilatation in Marfan syndrome: quantitative assessment of an unknown criterion. Heart 87(5):470–471
Verma S, Siu SC (2014) Aortic dilatation in patients with bicuspid aortic valve. N Engl J Med 370(20):1920–1929. doi:10.1056/NEJMra1207059
Siu SC, Silversides CK (2010) Bicuspid aortic valve disease. J Am Coll Cardiol 55(25):2789–2800. doi:10.1016/j.jacc.2009.12.068
Fazel SS, Mallidi HR, Lee RS, Sheehan MP, Liang D, Fleischman D, Herfkens R, Mitchell RS, Miller DC The aortopathy of bicuspid aortic valve disease has distinctive patterns and usually involves the transverse aortic arch. J Thorac Cardiovasc Surg 135(4):901–907
Malaisrie SC, Carr J, Mikati I, Rigolin V, Yip BK, Lapin B, McCarthy PM (2012) Cardiac magnetic resonance imaging is more diagnostic than 2-dimensional echocardiography in determining the presence of bicuspid aortic valve. J Thorac Cardiovasc Surg 144(2):370–376
Hope MD, Hope TA, Crook SE, Ordovas KG, Urbania TH, Alley MT, Higgins CB (2011) 4D flow CMR in assessment of valve-related ascending aortic disease. JACC Cardiovasc Imaging 4(7):781–787. doi:10.1016/j.jcmg.2011.05.004
Tan JL, Babu-Narayan SV, Henein MY, Mullen M, Li W (2005) Doppler echocardiographic profile and indexes in the evaluation of aortic coarctation in patients before and after stenting. J Am Coll Cardiol 46(6):1045–1053. doi:10.1016/j.jacc.2005.05.076
Underwood SR, Firmin DN, Klipstein RH, Rees RS, Longmore DB (1987) Magnetic resonance velocity mapping: clinical application of a new technique. Br Heart J 57(5):404–412
Varaprasathan GA, Araoz PA, Higgins CB, Reddy GP (2002) Quantification of flow dynamics in congenital heart disease: applications of velocity-encoded cine MR imaging. Radiographics 22 (4):895–905; discussion 905-896
Araoz PA, Reddy GP, Tarnoff H, Roge CL, Higgins CB (2003) MR findings of collateral circulation are more accurate measures of hemodynamic significance than arm-leg blood pressure gradient after repair of coarctation of the aorta. J Magn Reson Imaging 17(2):177–183
Julsrud PR, Breen JF, Felmlee JP, Warnes CA, Connolly HM, Schaff HV (1997) Coarctation of the aorta: collateral flow assessment with phase-contrast MR angiography. AJR Am J Roentgenol 169(6):1735–1742
Chong WY, Wong WH, Chiu CS, Cheung YF (2006) Aortic root dilation and aortic elastic properties in children after repair of tetralogy of Fallot. Am J Cardiol 97(6):905–909. doi:10.1016/j.amjcard.2005.09.141
Mongeon FP, Gurvitz MZ, Broberg CS, Aboulhosn J, Opotowsky AR, Kay JD, Valente AM, Earing MG, Lui GK, Fernandes SM, Gersony DR, Cook SC, Ting JG, Nickolaus MJ, Landzberg MJ, Khairy P, Alliance for Adult Research in Congenital C (2013) Aortic root dilatation in adults with surgically repaired tetralogy of fallot: a multicenter cross-sectional study. Circulation 127(2):172–179. doi:10.1161/CIRCULATIONAHA.112.129585
McMahon CJ, Ravekes WJ, Smith EO, Denfield SW, Pignatelli RH, Altman CA, Ayres NA (2004) Risk factors for neo-aortic root enlargement and aortic regurgitation following arterial switch operation. Pediatr Cardiol 25(4):329–335. doi:10.1007/s00246-003-0483-6
Schwartz ML, Gauvreau K, del Nido P, Mayer JE, Colan SD (2004) Long-term predictors of aortic root dilation and aortic regurgitation after arterial switch operation. Circulation 110(11 Suppl 1):II128–II132. doi:10.1161/01.CIR.0000138392.68841.d3
Co-Vu JG, Ginde S, Bartz PJ, Frommelt PC, Tweddell JS, Earing MG (2013) Long-term outcomes of the neoaorta after arterial switch operation for transposition of the great arteries. Ann Thorac Surg 95(5):1654–1659. doi:10.1016/j.athoracsur.2012.10.081
Cohen MS, Marino BS, McElhinney DB, Robbers-Visser D, van der Woerd W, Gaynor JW, Spray TL, Wernovsky G (2003) Neo-aortic root dilation and valve regurgitation up to 21 years after staged reconstruction for hypoplastic left heart syndrome. J Am Coll Cardiol 42(3):533–540
Erez E, Tam VK, Galliani C, Lashus A, Doublin NA, Peretti J (2012) Valve-sparing aortic root replacement for patients with a Fontan circulation. J Heart Valve Dis 21(2):175–180
Pizarro C, Baffa JM, Derby CD, Krieger PA (2011) Valve-sparing neo-aortic root replacement after Fontan completion for hypoplastic left heart syndrome. J Thorac Cardiovasc Surg 141(4):1083–1084. doi:10.1016/j.jtcvs.2010.07.076
Goo HW, Park IS, Ko JK, Kim YH, Seo DM, Park JJ (2005) Computed tomography for the diagnosis of congenital heart disease in pediatric and adult patients. Int J Card Imaging 21(2–3):347–365; discussion 367
Author information
Authors and Affiliations
Corresponding author
Editor information
Editors and Affiliations
Rights and permissions
Copyright information
© 2017 Springer Japan KK
About this chapter
Cite this chapter
Guo, K., Lath, N., Tan, J.L. (2017). Imaging: Echo, CT and MRI. In: Niwa, K., Kaemmerer, H. (eds) Aortopathy. Springer, Tokyo. https://doi.org/10.1007/978-4-431-56071-5_6
Download citation
DOI: https://doi.org/10.1007/978-4-431-56071-5_6
Published:
Publisher Name: Springer, Tokyo
Print ISBN: 978-4-431-56069-2
Online ISBN: 978-4-431-56071-5
eBook Packages: MedicineMedicine (R0)