
Abstract
The main removal region of ion and particulate forms of zinc (Zn ), cadmium (Cd) , plumbum (Pb) , and copper (Cu) was in the waters of salinity 10–23 in the Changjiang estuary. The positive correlationships between heavy metals and the reciprocal of transparency , chemical oxygen demand, and chlorophyll-a showed that the removals of Zn , Cd , Pb , and Cu closely correlate with the distribution of suspensions, the adsorptions of organic materials, and the assimilation by organisms, suggesting that the latter two are main mechanisms of heavy metals removal in the estuary. The main area of heavy metals removal in the estuary was located in the high sedimentary rate area, and sediments mainly consisted of silty clay and clayey silt. The high heavy metals content area in surface sediment was consistent with the distribution trend of heavy metals contents in the water body.
Access provided by Autonomous University of Puebla. Download chapter PDF
Keywords
The annual transport of Zn (T) (total zinc), Cd (T) (total cadmium), Pb (T) (total lead), and Cu (T) (total copper) from the Changjiang River to the East China Sea were about 2.6 × 10⁴, 1.5 × 10³, 1.6 × 10³, and 8.0 × 10³ tons, respectively (Zhang et al. 1987). It is interesting how heavy metals diffuse and remove after they enter the sea. Wu (1978) researched the contents of Cu , Cr, and Hg in Changjiang estuary sediments and their removal mechanisms. Xu et a1. (1982) discussed the distributions of Hg, Cu , Pb , Zn , and Cr contents in Changjiang estuary sediments and their relationships to environmental factors. The behaviors of dissolved Cd , Cu , and Pb in the Changjiang estuary were reported by Edmond et a1. (1985) and Elbaz-Poulichet et a1. (1990). The difference between the results of the above two papers and the results reported in this section is due to the difference in analytical method. The contents of ion and particulate form of Zn , Cd , Pb , and Cu in the Changjiang estuary waters were determined in this work using the method of inverse polarography with anti-adsorption physically coated mercury film electrode system devised by Gu et a1. (1973, 1980). Their removal from the estuary and their relationships with environmental factors are discussed.
1 Investigation and Analysis Method
The investigation was carried out from November 19 to 26, 1985 at 29 sampling stations (Fig. 1) The surface water samples were collected and immediately filtered with 0.45 µm filters (nitrocellulose and acetate). The filtrate was collected in clean polyethylene bottles immersed in old seawater for a long time, and the filters with suspensions were stored in a culture container under low temperature .

Sampling stations
1.1 The Determination of Ion Form of Zn, Cd, Pb, and Cu
Filtrate samples were poured into an electrolyser. No reagent was added. An anti-adsorption physically coated mercury film electrode (as working electrode) and a mercury cell (as reference electrode) were used for differential inverse polarography of the single cell .
1.2 The Determination of Particulate Form of Zn, Cd, Pb, and Cu
The filters with suspensions were put into a digestion bomb with HC1 and HNO3 and digested. The digested liquid was diluted with old seawater and adjusted to pH 4.5. The inverse polarography results were corrected with blanks. A British DAVIS A1660 differential cathode ray polarograph was used.
2 The Removal of Heavy Metals in the Estuary
The average contents of (and proportion to total) ion and particulate forms (P) of heavy metals in the Changjiang estuary surface seawater listed in Table 1 show that the contents of the ion form of heavy metals were low and the changes small, and that particulates comprised the main form of heavy metals there and were 4–99 times that of the ion form obviously as a result of the great quantity of particulate matter transported there by the Changjiang River.
Trace metal ions in seawater were mainly controlled by the reaction in the liquid/solid interface (Goldborg 1965). Many suspensions of clay minerals and organic matters in the Changjiang River have strong adsorption and complexation capacities for heavy metal ions. After the Changjiang River water enters the sea, because of the changes of physical and chemical environments (salinity , pH, hydrodynamics, etc.), a part of the ion form and particulate form of heavy metals are adsorbed and coagulated, and become big particles entering sediment . Investigation shows that after various heavy metals in the Changjiang River water enter the sea, all of them were removed to a certain degree (see Fig. 2). The relationships of concentrations of the ion form of heavy metals and salinity (S) were indicated as:

Relationships of heavy metals(µg L−1) and salinity : a Zn –S; b Cd –S; c Pb –S; d Cu –S. filled circle ion form; × Particulate form; small dash lines theoretical dilution line ; large dash lines corrective line
The above equations and Fig. 2 show that except for Cu2+ being a little different the main removal region of Zn2+, Cd2+, and Pb2+ is in the waters of salinity 10–23. The maximum removal quantities of Zn2+, Cd2+, Pb2+, and Cu2+ were about 9, 22, 15, and 11%, respectively. There were negative exponential correlationships between the particulate form of heavy metals and salinity as indicated in the equations:
Figure 2 shows the similar removal processes of the ion and particulate forms of heavy metals sedimentation.
The relationships among heavy metals also show similar removal processes. The relationships between Zn2+, Pb2+, and Cd2+ were, respectively, indicated as:
There were obvious positive linear correlationships among the particulate forms of heavy metals:
3 The Relationships of Heavy Metals and Other Hydroenvironment Factors
The relationships of total quantity of heavy metals and seawater transparency (Tr) are indicated in Fig. 3. The relationship between Zn (T) and Tr(m) was as follows:

Relationships between heavy metals (µg L−1) and transparency (m): a Zn (T)—Tr; b Cd (T)—Tr; c Pb (T)—Tr; d Cu (T)—Tr
The high concentrations of heavy metals distributing in the <lm transparency waters show that coacervation–sedimentation and dilution –diffusion of heavy metals in the estuary occurred mainly in the waters with high contents of suspensions. In the waters with >lm transparency , the contents of heavy metals were almost constant (Fig. 3).
The adsorption of organic materials and assimilation by organisms are main mechanisms of heavy metals removal in the estuary. Gardiner (1974) showed that the adsorption ability of humus is two orders of magnitude greater than that of clay and kaolin. Study shows that there were positive correlationships between heavy metals and chemical oxygen demand (COD) (Fig. 4) and chlorophyll-a (Chl-a) as follows:

Relationships between heavy metals (µg L−1) and COD (mg L=1): a Zn (T)—COD ; b Cd (T)—COD ; c Pb (T)—COD ; d Cu (T)—COD
4 The Relationship Between the Removal of Heavy Metals and Sedimentary Environments
The horizontal distributions of the total quantities of heavy metals are indicated in Fig. 5. From stations A7 in the mouth to H3 (122°30′ E, 30°45′ N), heavy metals decrease from 46.7 to 17.9 µg L−1 (61.7% decrease) for Zn (T), 3.5–2.1 µg L−1 (40% decrease) for Cd (T), 7.2–1.3 µg L−1 (81.9% decrease) for Pb (T) and 19.9–9.8 µg L−1 (50.8% decrease) for Cu (T). Surface waters increasing in salinity from 11.486 to 22.824 (bottom waters 24.972) comprised the main area of heavy metals removal in the estuary. The main characteristics of the sedimentary environments of the waters were (Yang et al. 1992):
-
(1)
Sediments mainly consisted of silty clay and clayey silt and particles were thin, and directly transported by the Changjiang River water.
-
(2)
Determination by 210Pb showed that the sedimentation rate of the waters in the high sedimentary rate area outside the Changjiang River estuary was 2–5 cm a−1.
-
(3)
This high heavy metals content area in surface sediment in the Changjiang River estuary (Fig. 6) was consistent with the distribution trend of heavy metals contents in the water body.
Fig. 5 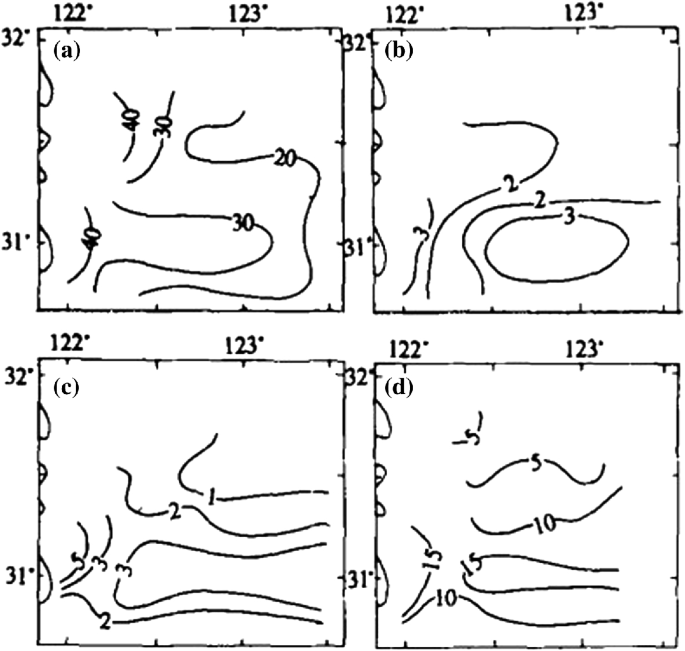
Horizontal distributions of heavy metals (µg L−1): a Zn (T); b Cd (T); c Pb (T); d Cu (T)
Fig. 6 
Distributions of Pb and Cu content (10−6) in sediments: a Pb ; b Cu . Large dash lines September, 1985; small dash lines January, 1986


References
Edmond, J. M., Spivack, A., Grant, B. C., Hu, M. H., Chen, X., Cheng, S., et al. (1985). Chemical dynamics of the Changjiang estuary. Continental Shelf Research, 4, 17–36.
Elbaz-Poulichet, F., Huang, W. W., Martin, J. M., et al. (1990). Biogeochemieal behaviour of dissolved trace elments in the Changjiang Estuary. In G. H. Yu. et al. (Ed.), Biogeochemical Study of the Changjiang Estuary (pp. 293–311). Beijing: China Ocean Press.
Gardiner, J. (1974). The chemistry of Cd in nature water. 1I. The adsorption of Cd in river muds and naturally occurring solids. Water Research, 8(3), 157–164.
Goldberg, E. D. (1965). Minor elments in seawater. In J. P. Riley & G. Skirrow (Eds.), Chemical Oceanography (Vol. 1, pp. 175–177). Academic press.
Gu, H. K., & Liu, M. X. (1973). Physically coated mercury film electrode single cell differential inverse polarography. Chinese Journal of Analytical Chemistry, 1(1), 15–22. (in Chinese with English abstract).
Gu, H. K., Liu, M. X., & Bao, W. Y. (1980). A study of the antiadsorption membrane of electrode. Acta Chimica Sinica, 38(4), 381–386. (in Chinese with English abstract).
Wu, Y. D. (1978). On the mechanism of the harmful heavy metal transport in Changjiang River estuary, I. The transport pattern and the factors affecting it. Oceanologia. et Limnologia Sinica, 9(2), 168–182. (in Chinese with English abstract).
Xu, K. C., Huang, S. L., & Wu, L. Q. (1982). Study of heavy metals in the estuarine sediments of the Changjiang River. Acta Oceanologica Sinica, 4(4), 440–449. (in Chinese with English abstract).
Yang, G. F., Wu, J. Y., Gao, M. D., Zhou, T. C., Li, Y. Z., & Han, Y. S. (1992). Effects of the Three Gorges Project on depositional structure and geochemistry characters of the Changjiang River estuary. Institute of Oceanology, Chinese Academy of Sciences. Studia Marina Sinica, 33, pp. 69–108. Beijing: Science Press. (in Chinese with English abstract).
Zhang, F. G., Yang, G. F., & Shen, Z. L. (1987). Effects of the Three Gorges Project on the hydrographical, hydrochemical and sedimentary environments of the Changjiang River estuary. In Selected works on the impacts of the Changjiang River Three Gorges Project on the ecology and environment and study of possible countermeasures (pp. 369–402). Beijing: Science Press. (in Chinese).
Author information
Authors and Affiliations
Corresponding author
Editor information
Editors and Affiliations
Rights and permissions
Copyright information
© 2020 Springer-Verlag GmbH Germany, part of Springer Nature
About this chapter

Cite this chapter
Shen, Z., Liu, M. (2020). The Removal of Zinc, Cadmium, Lead, and Copper in the Changjiang Estuary. In: Shen, Z. (eds) Studies of the Biogeochemistry of Typical Estuaries and Bays in China. Springer Earth System Sciences. Springer, Berlin, Heidelberg. https://doi.org/10.1007/978-3-662-58169-8_8
Download citation
DOI: https://doi.org/10.1007/978-3-662-58169-8_8
Published:
Publisher Name: Springer, Berlin, Heidelberg
Print ISBN: 978-3-662-58167-4
Online ISBN: 978-3-662-58169-8
eBook Packages: Earth and Environmental ScienceEarth and Environmental Science (R0)