
Abstract
Material, the basis for the normal operation of enterprises, is greatly demanded in power grid enterprises, shows strong effectiveness, and directly affects the operation costs of enterprises. The whole logistics process of enterprises, including purchasing, handling, transportation and distribution of materials, is inseparable from inventory. In short, inventory has penetrated into every link of the whole logistics system. At present, the role of inventory has been attached great importance to large enterprise management process. Inventory management requires huge investment, thus it becomes the center and ultimate goal of inventory management and logistics management to reduce inventory and inventory costs or even realize no inventory.
This study proposes methods to reasonably calculate the spare parts inventory, and puts forward solutions to optimized management of spare parts inventory in power enterprises, with the final purpose to improve management mode of traditional spare parts and achieve intensive, lean, standard management of spare parts in power grid enterprises.
Access provided by Autonomous University of Puebla. Download conference paper PDF
Keywords
1 Introduction
Spare part (Shuichi Kobayashi 2010), a common term, refers to all the parts related to equipments. Literally, it refers to spare items and spare components. It can be generally inclusive or narrowly meaningful, and covers all spare goods, namely different spare items in different industries.
In fact, in both repair industry and manufacturing industry, in equipment repair or production process, in order to shorten the interval time of repair, the enterprises will, according to the laws of part abrasion and service life of equipments, process, purchase and reserve the parts that are easily wearable and need timely replacement in advance (Goldman 2003).
Power grid enterprises have to deal with heavy operation and maintenance tasks as well as complex equipments and technology, thus how to reduce inventory funds, eliminate blind procurement and improve efficiency of fund use with the premise to guarantee the supply has become one of the urgent problems to be solved. Therefore, efficient orderly and lean inventory management can reduce the cost of enterprise operations, and has become the source of enterprises’ third profit (Jin Hanxin et al. 2008).
2 Classification of Spare Part Inventory Types
This section, with S Power Supply Bureau as an example, analyzes the total number of types of repaired material and the use frequency of each type of material, respectively summaries the total amount of material from 2006 February to 2010 February, and concludes that the spare parts can be divided into three categories (Wang Daoping and Hou Meiling 2011): 1st category: those with large inventory and frequent delivery, accounting for 13.84 %; 2nd category – those with large inventory and infrequent delivery accounting for 29.96 %; third category – those with small inventory and infrequent delivery, accounting for 56.20 %.
3 Prediction-Based Model of Rational Inventory of Spare Parts (Table 1)
3.1 Model of Rational Inventory of 1st Spare Parts
3.1.1 Analysis of Rational Inventory of 1st Category Spare Parts
According to the classification criteria of spare parts, some data about materials issued from 2006 February to 2010 February are selected, as is shown in Table 2.
Based on analysis of the above data, the characteristics and methods to identify inventory of 1st category materials are drawn:
Characteristic: they are most widely, frequently regularly or irregularly used in repair and maintenance process, and their procurement cycle is short in general;
Defined interval value: times of issue: n ≥ 50; amount of materials issued: Q ≥ 100;
Methods to calculate rational inventory: multivariate statistical prediction method (Zhang Yuan 2010) Q = α i q ′ i + β i q ″ i + χ i q ′ ′ ′ i is adopted, wherein q ′ i means predicted value with method of moving average; q ″ i means predicted value with method of index smoothing forecasting, q ′ ′ ′ i means predicted value with method of periodic fluctuation; α, β, χ means the adjustment coefficient of predicted values, and the sum of them is 1. It is advantageous to eliminate the shortcomings of single prediction method by means of changing the proportion between the adjustment coefficients (Yang Lihua 2010).
3.1.2 Calculation of Rational Inventory of 1st Category Materials with 10 kV RUM as an Example
10 kV RMU is taken as an example to illustrate the methods to determine reasonable materials inventory of 1st category material. Monthly issue capacity of 10 kV RMU (02/2006–02/2010) is shown in Table 3.
-
1.
Prediction and analysis with the moving average method
Figure 1 shows data comparison of predicted value and actual value of 10 kV RMU with moving average method (Sun Yiwei 2007).

10 kV RUM moving contrast average method the measurement and actual volume trend (Data sources: the predicted value and actual value obtained with moving average method will be compared and drawn in Matlab)
The data of issue in 2009 predicted with moving average method is consistent with trend curve of real data; The predicted value slightly delays from the actual value; Compared with the peak of actual value in Decembers, predicted value decreases.
-
2.
Prediction and analysis with single exponential smoothing method
According to single exponential smoothing method (Jim Owens 2006), all the past historical data are weighted for average, and weighted coefficient gradually decays with time passing by.
Figure 2 shows predicted value and actual value of 10 kV RMU based on single exponential smoothing method.

Comparison of predicted value and actual value of 10 kV RMU obtained with single exponential smoothing method (Data sources: the predicted value and actual value obtained with single exponential smoothing method will be compared and drawn in Matlab)
The data of issue in 2009 predicted with single exponential smoothing method is consistent with trend curve of real data; The predicted value slightly delays from the actual value; Compared with the peak of actual value in Decembers, predicted value decreases, however, the degree of reduction with single exponential smoothing method is slightly smaller than that with moving average method.
-
3.
Prediction and analysis with the periodic fluctuation method
According to historical data (of generally at least two complete cycles), average demand d0 is determined, then the cycle coefficient of each period of a cycle is determined, and then the demand of next cycle is predicted (Narahari 2000).
Figure 3 shows predicted value and actual value of 10 kV RMU based on periodic fluctuation prediction method (Olson 2012).

Comparison of predicted value and actual value of 10 kV RMU obtained with periodic fluctuation prediction method (Data sources: the predicted value and actual value obtained with periodic fluctuation prediction method will be compared and drawn in Matlab)
The data of issue in 2009 predicted with periodic fluctuation prediction method is consistent with trend curve of real data; The predicted value slightly delays from the actual value; The peak of predicted value of actual value in Decembers is better.
-
4.
Determination of rational inventory of 10 kV RUM
According to multivariate statistical prediction calculation formula Q = α i q ′ i + β i q ″ i + χ i q ′ ′ ′ i , rational inventory of 10 kV RMU in 2009 is shown in Fig. 4.
Fig. 4 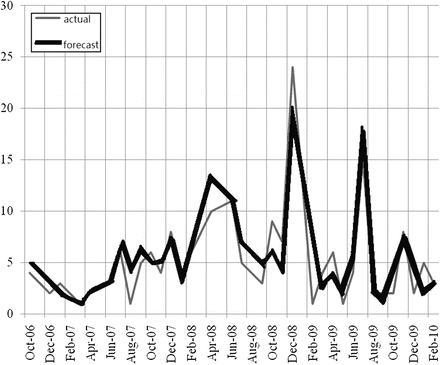
Comparison of predicted value and actual value of 10 kV RMU obtained with periodic fluctuation prediction method (Data sources: according to the comparison of actual value and predicted value obtained via multivariate statistical prediction formula)
In 2009, predicted value of 10 kV RUM Q = α i q ′ i + β i q ″ i + χ i q ′ ′ ′ i = 56 is higher than the actual demand, and less than the amount defined in manual of spare part inventory; this prediction method can reasonably reflect the actual demand of spare parts.
Therefore, the above calculation method can help to determine rational inventory of 1st category materials.

3.2 Model of Rational Inventory of 2nd Category Materials
3.2.1 Analysis of Rational Inventory of 2nd Category Materials
According to classification criteria of spare parts, some data about materials issued from 2006 February to 2010 February are selected, as is shown in Table 4.
Analysis of the above data leads to characteristics of 2nd category materials and methods to determine its rational inventory:
Characteristic: they are less important, with relatively short procurement cycle;
Defined interval value: times of issue: n ≤ 50n; amount of materials issued: Q ≥ 2;
3.2.2 Calculation of Rational Inventory of 2nd Category Materials with Glass Insulator as an Example
According to mean of real-time inventory \( Q=\frac{q}{n} \), wherein q means the total amount of issue (01/2006–02/2010), n means the times of issue (01/2006–02/2010). For example, the real-time rational inventory of glass insulator is 1,196/10 ≈ 120.
3.3 Model of Rational Inventory of 3rd Category of Materials
3.3.1 Analysis of Rational Inventory of 3rd Category of Materials
According to the classification criteria of spare parts, some data about materials issued from 2006 February to 2010 February are selected, as is shown in Table 5.
Based on analysis of the above data, the characteristics and methods to identify inventory of 3rd category materials are drawn:
Characteristic: they are important, with relatively long procurement cycle in general;
Defined interval value: times of issue: n ≤ 5; amount of materials issued: q ≤ 2;
3.3.2 Calculation of Rational Inventory of 3rd Category Materials with Fixed Four-Unit RUM as an Example
According to maximum of real-time inventory Q = Maxq, wherein q denotes the amount of issue. For example, the real-time rational inventory of fixed four-unit RUM is 1.
3.3.3 Calculation of Rational Inventory of Spare Parts
According to the data of issue of spare parts and corresponding methods to calculate rational inventory (02/2006–02/2010), the rational inventory of recorded spare parts is calculated, and some are shown in Table 6.
4 Conclusion
Research on S power supply enterprise’s rational inventory (Garg 2004) of spare parts complies with the current status of Chinese large-scale power grid enterprises, thus it is of great significance in practice and potential application, provides scientific decision support for business reconstruction of enterprise inventories and lean management, and helps to improve enterprises’ innovation ability.
References
Garg D (2004) Design of Six Sigma Supply Chains. IEEE Trans Autom Sci Eng 1(1):38–57
Goldman LI (2003) Crystal ball for Six Sigma tutorial. In: Proceedings of the winter simulation conference, Denver, USA
Jim Owens (2006) Availability optimization using spares modeling and the Six Sigma process. In: Reliability and maintainability symposium, 2006. RAMS’ 06. Annual, Newport Beach, 23–26 Jan 2006, pp 636–640
Jin Hanxin, Wang Liang, Huo Yan (2008) Warehousing & inventory management. Chongqing University Press, Chongqing, pp 10–16
Narahari Y (2000) Design of synchronized supply chains: a Six Sigma tolerancing approach. In: Proceedings of the 2000 IEEE, international conference on robotics & automation, San Francisco, Apr 2000
Olson RJ (2012) Micro and nano R&D fab safety, inert gas reduction, a lean Six-Sigma approach. University/Government/Industry, Micro/Nano symposium (UGIM), 2012 19th Biennial, IEEE 2012, Berkeley, 9–10 July 2012, p 1
Shuichi Kobayashi (2010) Lean manufacturing 009: inventory management (Zhang Shupeng). Eastern Publishing Co., Ltd., Beijing, pp 151–162
Sun Yiwei (2007) Optimization of inventory management with improved process based on Six Sigma. Logistics Sci-Tech 31(7):92–97
Wang Daoping, Hou Meiling (2011) Supply chain inventory management and control. Peking University Press, Beijing, pp 203–2215
Yang Lihua (2010) Optimization of material inventory based on Six Sigma management. Logistics Sci-Tech 34(7):104–107
Zhang Yuan (2010) Research on the application of Six-Sigma’s method to supply chain management. In: Proceedings of the 2010 IEEE, international conference on automation and logistics, Hong Kong/Macau, 16–20 Aug 2010
Author information
Authors and Affiliations
Corresponding author
Editor information
Editors and Affiliations
Rights and permissions
Copyright information
© 2013 Springer-Verlag Berlin Heidelberg
About this paper
Cite this paper
Li, J., Xu, M. (2013). Calculation of Rational Inventory of Spare Parts in Power Enterprise Based on Chronological-Order Prediction. In: Qi, E., Shen, J., Dou, R. (eds) Proceedings of 20th International Conference on Industrial Engineering and Engineering Management. Springer, Berlin, Heidelberg. https://doi.org/10.1007/978-3-642-40063-6_83
Download citation
DOI: https://doi.org/10.1007/978-3-642-40063-6_83
Published:
Publisher Name: Springer, Berlin, Heidelberg
Print ISBN: 978-3-642-40062-9
Online ISBN: 978-3-642-40063-6
eBook Packages: Business and EconomicsBusiness and Management (R0)