
Abstract
Rapid increase in the number of vehicles, depletion of natural resources, pollution of the environment and the greenhouse effect require reduction of fossil fuel consumption and substitution of the product with alternative fuel as well as cutting down the emissions of hazardous and toxic substances generated by motor vehicles.
Access provided by Autonomous University of Puebla. Download chapter PDF
Keywords
1 Introductory Information
1.1 Fuels
The source of power in motor vehicles is an engine. This creates a serious problem of engine selection in the aspect of its performance including the fuel issue. It is estimated that our civilisation has consumed energy equivalent to 500 billion tons of theoretical standard fuel, of which 2/3 in recent hundred years. It is anticipated that in this century energy consumption will rise by 250–300 % (Gronowicz 2004; Merkisz and Pielecha 2006).
As it results from different research, coal resources will be depleted at approximately 2200, crude oil at around 2050, and gas—approximately 2060. Therefore, intense works are ongoing globally on economical use of classical fuels (conventional), i.e. petrol, diesel oil, alternative fuels and use of renewable (infinite) energy resources.
Conventional energy is an energy using non-renewable (finite) resources, such as: hard coal, brown coal, natural gas or crude oil. Unconventional energy is an energy using renewable (infinite) resources such as: wind, water, sun, biomass, biogas, etc.
Alternative fuels (Niziński i inni 2011) are all fuels that are not products of crude oil processing (petrol, diesel oil) and which additionally (Jastrzębska 2007; Kneba and Makowski 2004):
-
occur in sufficiently big quantities;
-
are useful for car engine fuelling;
-
are cheap in terms of production and sale;
-
constitute a lesser risk for natural environment than traditional fuels;
-
may be produced from own fossil materials and agricultural products;
-
generate low costs of vehicle operation.
Considering the above facts it is advisable to examine the issues of current and future energy sources in the aspect of use thereof in fuel engines and to assess them in terms of diagnostics and generation of statuses given the gas emissions.
A low number of combustion engines with spark ignition are fuelled with liquefied petroleum gas (LPG) (0.6 MPa at t = 20 °C). The fuel is mainly a mixture of two hydrocarbons: propane C3H8 (18–55 %) and butane C4H10 (45–77 %).
The main properties of this fuel and engines are as follows (Jastrzębska 2007; Kneba and Makowski 2004; Luft 2003; Merkisz and Pielecha 2006):
-
density 1.5–2 times greater than that of air;
-
volume consumption of gas is greater by 20–25 % than in the case of petrol fuelling due to lower calorific value with reference to the volume unit;
-
LPG engines are fuelled with a stoichiometric mixture (λ = 1); they are equipped with a catalytic reducer;
-
a slower combustion process causes the necessity of increasing of the ignition advance angle;
-
with the same composition of the fuel–air mixture engines fuelled with liquefied petroleum gas are characterised by lower unit emissions of carbon monoxide (CO) and hydrocarbons (CnHm);
-
nitric oxides (NOx) emission comparing to petrol has yet not been unequivocally determined;
-
particularly low exhaust emission is obtained for mono-fuel engines (Euro4 standard satisfied);
-
total emission from bi-fuel vehicle fuelling systems is similar to mono-fuel fuelling;
-
engines constitute the predominant solution for gas fuelling in passenger cars and lorries because of the system’s low cost, light weight and dimensions.
There are five generations of LPG engine fuelling systems. Currently, generations IV and V are commonly used.
Fourth generation fuelling system (conforming to Euro 3, Euro 4 standards) is characterised by electromagnetic ejectors, which ensures reflection of the gas engine performance compared to petrol engine. In fifth generation systems (conforming to Euro 5 and Euro 6 standards) liquefied gas is not evaporated but injected as to the liquid phase to the engine’s suction manifold. This results in engine power increase. No considerable differences have been observed between gas and petrol fuelled engines.
Natural gas (NG, methane CH4—85–98 %) is natural fuel occurring independently or accompanying crude oil. Two forms of natural gas are used in combustion engines, namely:
-
compressed (16–25 MPa—CNG—Compressed Natural Gas);
-
liquefied (t = −161.6 °C—LNG—Liquefied Natural Gas).
The density of compressed natural gas is approximately four times lower than petrol’s. Therefore, there is a requirement of using a high volume cylinder, which, as a consequence, increases the vehicle’s weight. Gas fuelled engines are characterised by emissions at the level of Euro 4 standard. The gas is non-toxic, around two times lighter than air and easily mixes with air. Four generations of natural gas injection systems may be distinguished (Merkisz and Pielecha 2006).
The volume of liquefied natural gas (methane CH4 ca 75 %) is approximately 600 lower comparing to its gaseous state. Thus, this property offers savings on transport and storing thereof. Storing of liquefied natural gas in the vehicle is performed using cryogenic tanks with powder-vacuum insulation. Liquefied natural gas fuelled engines meet the limitations of Nox; however, not for solid particles emissions. Application of LNG causes increase in energy storage comparing to CNG of the same volume.
Biogas is a gas generated in the process of anaerobic fermentation of manure and waste (mainly of agricultural origin) with the participation of methane bacteria (CH4—58–85 %, CO2—14–18 %). The fuel has properties similar to natural gas.
Animal waste (animal fat) may constitute a source of fuel for compression-ignition engines. Tests of the properties of such fuels, exhaust emissions, and engine performance are pending (Urząd Patentowy 2008).
Comparing to petrol, alcohols offer a series of advantages, to name just a few: theoretically lower demand of air for combustion, higher resistance to predenotation, lower ignition energy, higher flame velocity. The drawbacks include in particular: lower calorific value, difficulties with fuel evaporation, non-dissolving in petrol or diesel oil (a dissolvent, stabiliser or emulsifier shall be used), dissolving of certain metals, and acceleration of corrosion.
Methanol (CH3OH) is made of natural gas; it is biodegradable but is a toxic compound. Low pressure of vapours is a cause of difficult starting of spark-ignition engines. Application of methanol results in increased engine power at the cost of increased engine wear. Application of methanol in compression-ignition engines is possible. Nevertheless, a foreign source of ignition or high level of compression is required.
Ethanol (C2H5OH) is obtained from plants (e.g. beet, cane, cereals, potato). The properties of ethanol are similar to those of methanol, except for toxicity and energetic density—higher by around 35 %.
Vegetable oils (biodiesels) that serve fuelling of compression-ignition engines include: rape, sunflower, soya, and palm oils and their esters. Two methods of vegetable oils use may be distinguished:
-
combustion of fuels without preparation, by relevant adjustment of engine structures;
-
preparation of fuels in the process of extraction (vegetable oil esters) as the basic method.
Due to their ability of spontaneous ignition, vegetable oils are more suitable for compression-ignition engines. They emit less vegetable black and, because of application of the catalytic converter, the emissions of CO, HC, and NOx are also lower comparing to diesel engines. The drawback of esters is their aggressiveness toward certain plastics.
However, the central benefit of the use of vegetable oils is the closed CO2 cycle in the atmosphere and, as a consequence, reduced greenhouse effect.
Once all the conventional fuels are depleted, the fundamental fuel for combustion engines and one of the basic factors supplying fuel cells will be hydrogen (Gronowicz 2004, 2008; Jastrzębska 2007; Merkisz and Pielecha 2006; Niziński i inni 2011). Hydrogen generated in the process of electrolysis of sea and ocean water may be transported and stored in gaseous, liquefied or chemically bound form in any place of the world. It should be pointed that hydrogen’s main advantage as fuel is that in the combustion process reaction, water and small quantity of nitric oxides are obtained.
Nevertheless, basic future use of hydrogen will be supplying of a fuel cell that generates direct current that, after transformation into alternating current, may be used to power feed electric engines propelling motor vehicles.
It shall be emphasised that as a result of reaction of hydrogen and carbon monoxide dimethyl ether is obtained with a high cetane number (CN > 55) and high oxygen content, which indicates that the fuel may be used to power feed combustion engines with compression-ignition (Gronowicz 2008).
Ammonia is also a synthetic fuel obtained on a mass scale from hydrogen and atmospheric nitrogen. In normal conditions it is a gas; however, under pressure of 0.06–0.6 MPa it undergoes condensation and may be stored similarly to liquefied propane-butane. Application of NH3 to power feed spark-ignition engines requires changes in the structure of combustion chamber and ignition system due to too high ignition temperature of mixture and low combustion velocity. Direct application of ammonia to fuel compression-ignition engines is impossible because of very difficult fuel spontaneous ignition. Therefore, a charge of diesel oil is used for it self-ignition or acetylene is added to the air–fuel mixture in the amount of 15–20 %.
Knowing the properties of alternative fuels for combustion engine fuelling and of the renewable fuel such as hydrogen, the status of know-how referring to engine diagnostics may be assessed and the development of their diagnostics systems, particularly in the context of natural environment preservation, may be anticipated.
1.2 Hazardous and Toxic Substances
Hazardous and toxic substances may be divided into two groups (Berhart et al. 1969; Günther 2002; Kneba and Makowski 2004; Luft 2003; Merkisz and Mazurek 2002; Merkisz and Pielecha 2006; Rokosch 2007; Rychter and Teodorczyk 2006):
-
relating to engine, in particular classical one;
-
non-engine related, including fuel vapours in fuel tanks, fine-particle dust caused by the use of brake lining and clutch facing as well as metal parts’ corrosion, lead, copper, antimony, particles of erosion and catalytic coating of catalytic converters (platinum, palladium, rhodium).
Considering the purpose of this chapter, the authors will focus mainly on the aspect of emissions of gaseous pollutants relating to combustion engine operation.
Exhaust gases of combustion engines include hazardous and toxic substances (Fig. 1).

Composition of S.I. and C.I. engine exhaust gases (Rokosch 2007)
Carbon monoxide CO is a colourless gas with no flavour, very hazardous for living organisms. Its concentration equal to 0.3 % causes death by suffocation. Incomplete combustion of fuel is the fundamental reason for carbon monoxide increase.
Hydrocarbons HC are, among others, the following chemical compounds: aliphatic hydrocarbons, alkanes i.e. chain (paraffin) hydrocarbons, cyclic aromatic hydrocarbons, aldehydes and multi-cycle hydrocarbons. They are cancirogenic. The causes of increased hydrocarbon emission are as follows:
-
incomplete combustion of a rich mixture;
-
local deficiency of oxygen in combustion chamber;
-
combustion of a very weak mixture (valve burning, prolonged process of combustion);
-
penetration of oil into the combustion chamber.
Nitric oxides NO X are chemical combinations of N2 nitrogen and O2 oxygen, for instance: NO, NO2, N2O5, formed in a temperature of over 1100 °C. Nitric oxides poisons human body, in particular nitrogen dioxide NO2. Combination of nitric oxides and water H2O form nitric acid HNO3, nitrates HNO2, that have a corrosive impact on engine elements.
High temperature of weak mixture combustion provides the most favourable conditions for nitric oxides generation.
Sulphur oxides SO X are chemical combinations of O2 oxygen and sulphur S2 atoms included in fuel and water H2O, formed in the process of fuel combustion. The results of these reactions are: SOX, sulphurous acid H2SO3 and sulphuric acid H2SO4.
Sulphuric acid is the main reason of acid rains and, consequently, forest extinction. Sulphur dioxide SO2 irritates the mucosa of eyes and nose, upper airway, and disturbs functioning of pulmonary alveoli.
Hydrogen sulphide H 2 S may form in specific conditions in the catalytic converter. It causes poisoning showed in dyspnoea, loss of consciousness and breathing difficulties, irritation of the mucosa of eyes and airway.
Ammonia NH 3 may also form in specific conditions in the catalytic converter. It causes coughing, breathing difficulties, dyspnoea, skin redness and irritation or even loss of sight (direct contact).
Particulate matter PM (solids) is a product of incomplete combustion of hydrocarbons. These are clusters of carbon atoms—carbon black (particle nuclei—50 % made from: non-burnt fuel—6 %, engine lubricant—18 %, condensed water vapour, kinematic pair abrasive wear product, compounds of sulphur and ashes (26 %). They have different forms and sizes (0.05–15 μm), and merge in bigger clusters. They have a negative impact on upper airway and lungs.
Emission of particulate matter is approximately three times bigger in classical engines with compression-ignition comparing to spark-ignition engines. This does not apply to spark-ignition engines with direct fuel injection where the quantity is much bigger.
Carbon dioxide CO 2 is a non-flammable gas, colourless, strongly toxic, naturally occurring and regulating life processes of plants and animals. Carbon dioxide is a product of complete combustion of fuel in the engine and a product of oxidation of toxic compounds in catalytic converter. Next to such gases as: methane CH4, exhilarating gas N2O, and halogens FCKW responsible for the greenhouse effect (Fig. 2).

Contribution of different gases to the Earth’s greenhouse effect formation (Rokosch 2007)
1.3 Pollution limits
Since 1988 all newly registered vehicles in the USA have been equipped with an OBD (On-Board Diagnostic) as required by CARB (California Air Resources Board). In 1996, the enhanced version—OBD II—was introduced. The third version is OBD III which assumes abandoning of periodic inspections of vehicle elements and introduction of monitoring functions on current basis, i.e. informing superior units about failures and inadmissible exceeding of limit values for the exhaust emissions.
Since 2000 all spark-ignition engine vehicles newly registered in the European Union have been obligatory equipped with EOBD (European On-Board Diagnostic) and since 2004 the same requirement has been applied to compression-ignition engines (D-OBD—Diesel On-Board Diagnostic). Since 2006 also lorries have been covered by the obligation (Merkisz and Mazurek 2002; Rokosch 2007).
Introduction of an OBM (On-Board Measurement) for direct registration of toxic compounds is also planned. With OBD a crucial issue is to define the limits of pollution included in exhaust gases of combustion engines. The main institutions responsible for defining the limits are:
-
in Europe—European Commission (EC);
-
in the USA—Environmental Protection Agency (EPA); CARB (California Air Resources Board);
-
in Japan—Ministry of Transport (MIT);
-
in other countries—regulations included in European, American or Japanese standards.
Figures 3 and 4 illustrate changes of admissible exhaust emission levels for spark-ignition and compression-ignition engines for M class vehicles, determined in European standards.


The European Automobile Manufacturers’ Association (ACEA—French ‘Association des Constructeurs Europeens d’Automobile’) has assumed a voluntary obligation concerning reduction of fuel consumption in 2008 by approximately 25 % comparing to 1965. This means reduction of the average carbon dioxide CO2 emission from 186 g/km to 140 g/km.
As a result of the global crisis the European Commission has slightly liberalized the dynamics of CO2 emission reduction. According to the compromise that has been reached the average CO2 emission in new vehicles manufactured between the years 2012–2015 shall drop to the level of 120 g/km. As target, by 2020 the average carbon dioxide emission is to reach 95 g/km (Fig. 5).

The emission of CO2 is strictly connected with fuel consumption. Therefore, ‘115 g/km’ virtually means the same as ‘4.4 dm3/100 km’. Reducing of the carbon dioxide emission means nothing else than pressure to consume less fuel.
Analysis of the exhaust emissions of is carried out:
-
during homologation-related tests;
-
during periodic technical inspection of operated vehicles according to other measuring procedures, other than those mentioned above.
Homologation testing of new vehicles is carried out on an engine test bench in precisely determined engine loading conditions, which result from the assumed driving cycle, in specified sections.
In Europe it is NEDC that imitates typical traffic conditions (the cycle is composed of the urban segment (UDC) and extra urban segment (EUDC)). In other countries there are other driving cycles that apply (e.g. USA – FTP-75, Federal Test Procedure).
2 Properties of Motor Vehicle Diagnostic Systems
2.1 Motor Vehicle Diagnostic System
Due to the limited size of this chapter, only the on-board paradigms of motor vehicle diagnostic systems related to the monitoring of gaseous pollution emission will be discussed here. Readers interested in detailed issues shall refer to literature (Bocheński 2000; Bocheński and Janiszewski 1998; Günther 2002; Hebda et al. 1984; Herner and Riehl 2004; Janiszewski and Mavrantzas 2009; Merkisz and Mazurek 2002; Niziński 1999; Niziński and Michalkis 2002; Sitek 1999; Trzeciak 1998) where the methods and diagnostic devices used for motor vehicle diagnostics are described.
A structural approach to the diagnostic system for a motor vehicle S M may be presented as follows (Fig. 6):

A diagram of on-board, external diagnostic system for motor vehicles: (1) motor vehicle; (2) on-board diagnostic sub-system; (3) external diagnostic sub-system; (4) set of elements to be diagnosed; (5) communication sub-system; (6) set of sensors; (7) electronic control unit (ECU); (8) data display sub-system; (9) DLC; (10) data bus; (11) operator-driver; (12) actuator; (13) SAE handheld data reader; (14) generic data reader; (15) other diagnostic units; (16) analyst
where:
- S p :
-
on-board diagnostic sub-system;
- S :
-
external diagnostic sub-system;
- R pz :
-
diagnostic relations
Principal functions of the on-board diagnostic systems include as follows:
-
monitoring of the elements influencing the emission level of exhaust gases;
-
recording of the information on malfunctions of the diagnosed elements;
-
recording of the information on the operating conditions in which malfunctions occur;
-
informing the operator about malfunctions that caused 50 % excess of the admissible emission of exhaust gases;
-
forwarding the information to external diagnostic systems.
The on-board diagnostic system S p is as follows:
where:
- E :
-
a set of elements to be diagnosed;
- A :
-
diagnostic algorithms;
- K :
-
communication sub-system;
- O :
-
software;
- R EK :
-
relations
The communication sub-system K may be described by:
where:
- C :
-
a set of sensors;
- S :
-
electronic control unit (ECU) – controller;
- M :
-
data bus;
- Z :
-
data display sub-system;
- Z D :
-
data link connector;
- R CD :
-
relations
External diagnostic sub-system S z is described below:
where:
- S R :
-
generic (handheld) data reader;
- S p :
-
programmed (producer’s) data reader;
- S N :
-
other diagnostic devices;
- R RP :
-
relations
As currently diagnostic systems (diagnostic monitors) do not form a centralised structure, sub-systems SR and SP form an onboard-external, i.e. mixed, diagnostic system of a motor vehicle. The fact is a result both of absence of a common standard for structure and communication of diagnostic sub-systems and different objectives assumed by the systems’ manufacturers.
From the point of view of the effects of malfunction of diagnosed elements of motor vehicles we may assume the following classification (Rychter and Teodorczyk 2006):
-
(1)
emission-related, causing:
-
increased emission of toxic compounds (misfiring);
-
increased noise (damage to the detonation combustion sensor);
-
increased fuel consumption (damage to λ (lambda) probe).
-
-
(2)
driving safety-related, having direct impact on vehicle’s traffic safety. This applies mainly to systems such as: braking, steering, suspension, and lighting.
-
(3)
non-emission-related, i.e. which does not increase exhaust emissions but deteriorate the vehicle’s dynamics (damage to atmospheric pressure sensor).
-
(4)
driving comfort-related, which deteriorate the driver’s and passengers’ comfort (damage to the brake pedal position sensor—cruise control activation impossible). These factors refer to the vehicle’s body in particular.
The on-board sub-system of vehicle diagnostic systems (OBD) contains a definition of malfunction (Rychter and Teodorczyk 2006):
An unfit element (subassembly or function) shall be the one whose operation may cause considerable increase of exhaust gases emission or fuel consumption; where according to OBD II standard ‘considerable’ shall be defined as a growth by 50 % comparing to admissible value for this type of vehicle.
As it results from the malfunction definition the main task of OBD is current monitoring of the level of toxic compounds caused by engine failure or damage to other sub-assemblies. The Society of Automotive Engineers has determined emission standards included inter alia in the following norms:
-
J1930—common terms and abbreviations to define elements critical in terms of emissions for all manufacturers selling their products in the USA,
-
J1962—common data link connector (DLC) and its position in a vehicle,
-
J1979—common reader for diagnostic data (SAE Scan Tool),
-
J2190—diagnostic system functioning mode,
-
J2012—common designation of unfitness (diagnostic trouble codes DTC),
-
J1850—transmission protocol: computer—SAE Scan Tool.
In technical diagnostics, the basic terms are used, i.e. diagnostic algorithms which in OBD systems are called diagnostic tests and cover:
-
tests of electrical fitness of measuring and actuating elements;
-
passive tests of metrological fitness of actuating elements;
-
functional tests of actuating elements;
-
active tests of metrological fitness of measuring elements;
-
emission tests.
Algorithms of electrical fitness of measuring and actuating elements refer to testing of: continuity of circuits, shorting of the reader’s signal line or actuating feeding elements to the vehicle weight or feeding voltage.
Passive algorithm of fitness of measuring elements consists in testing of the correctness of sensor indication.
The algorithm of functionality of actuating elements consists in active testing of the elements’ fitness using the known model signal.
The algorithm of active tests of metrological fitness of measuring elements is similar to the functional test. In this case, the measuring element is tested by forcing changes to the measured values by means of a controlling value that has an impact thereon.
The basis of OBD is emission algorithm (test) where the element fitness criterion has been defined as follows (Merkisz and Mazurek 2002)
An element or system is considered damaged if it alone (assuming that other elements or systems are fully fit) causes increased emission of HC, CO, NO X above the limits admitted by standards. Both the emission values and the limits are expressed in g/km and are measured using the applicable test (in EU countries test I, in the USA FTP test). Otherwise, the element or system is considered fit.
According to OBD, the authors (Merkisz and Mazurek 2002) called the emission tests (algorithms) monitors.
Each monitor (algorithm, test) operates only one element or system influencing the emission. As per standards OBDII and EOBD, monitors are classified as follows:
-
continuous (unconditional) that operate those elements which must be checked on current basis in any driving conditions and whose performance does not depend on other monitors’ testing conditions;
-
non-continuous (conditional) whose performance requires: completion of performance of other monitors and a longer observation time of parameter value change in determined driving conditions, i.e. a determined engine thermal and dynamic condition.
Forwarding of information in motor vehicles is made using serial digital communication enabling connection of elements and subassemblies in functional nodes and integration of assemblies in one distributed control-and-measurement system.
In OBD (1984, Fig. 7) the control-and-measurement system covered only the engine injection-ignition system. The controller of this system—ECM (Engine Control Module)—or ECM (Engine Management System)—controlled fuel charge, ignition advance angle depending on loading, rotational velocity and engine temperature, all in real time.

Nature of the first generation on-board diagnostic system (OBDI). (1) engine injection system; (2) engine ignition system; (3) stabilisation system for idle run crankshaft rotational velocity; (4) sensor sub-system; (5) controller (ECM, EMS); (6) actuator; (7) diagnostic data reader
Then, a digital connection was introduced to transmit data from ECM to external programming-and-diagnostic devices. Due to the development of vehicles, ECM was burdened with new tasks that resulted in its extension to PCM (Powertrain Control Module).
OBDII (1996) introduced decentralisation of the vehicle’s control-and-measurement system by means of serial digital communication, connecting many independent elements and controllers operating different systems. Three types of digital communication were introduced (Merkisz and Pielecha 2006):
-
(1)
class A—the purpose of this solution is to replace the classical electric beam with one transmission line between many devices forming the system’s nodes. The A class communication is designed to transmit binary and continuous setpoints between the drivers and body equipment, in particular: switches, lights, air-conditioning, chassis, window lowering/lifting, etc. The maximum speed of data transmission is 10 kbit/s, and the average transmission time—100 ms;
-
(2)
class B—serves to exchange digital data of the measured parameter values between controllers (nodes), eliminating the excessive number of results. The B class network must also perform the functions of the A class. The maximum speed of data transmission is 125 kbit/s, and the average transmission time—20 ms;
-
(3)
class C—enables transmission of the digital data of operating systems in real time, such as: ABS, ESP, gearbox. The C class network shall be compatible with A and B type networks. The maximum speed of data transmission is 1 Mbit/s, and the average transmission time—5 ms.
In the course of standardisation works (Ford, General Motors, SAE, Delphi, Bosch) several basic standards of digital communications were elaborated—B and C class, and particularly PWM, VPM, ISO, KWP2000 (Keyword Protocol—European B class system) as well as diagnostic communication standard with open architecture CAN (Control Area Network—BOSCH).
According to (Bocheński 2000) a typical structure of on-board network for B and C class vehicles will be CAN (Fig. 8).

Example of on-board network diagram (prepared based on (Merkisz and Mazurek 2002)). (1) engine controller (ECM); (2) transmission controller (TCM); (3) choke valve controller (ETC); (4) ABS controller; (5) other systems’ controllers; (6),(7) body controller; (8) data link connector (DLC); (9) SAE handheld generic reader; (10) programmed reader (producer)
Controllers from 1 to 5 require exchange of information in real time (C class). Therefore, they are connected via a data bus CAN (ISO 11898) which is also used to transmit data to the data connection link 8 and producer’s reader 10. Controllers 1, 2, and 3 are responsible for the diagnostics of emission elements, thus, they were connected with a KWP (B class), which also serves data exchange between controller 6 and 7. This link is used to forward data to reader 9.
Connection of electronic systems of the vehicle with one or several data buses resulted in the following profits:
-
(1)
reduced number of cables and, consequently:
-
reduced weight of vehicle;
-
increased reliability through reduced number of plugs and e.g. soldered connection;
-
simplified run of cables, their installation and diagnostics;
-
reduced cost of system production;
-
reduction of problems related to electromagnetic compatibility.
-
-
(2)
New possibilities of system connection via:
-
better use of functioning possibilities;
-
common strategy of regulation by different systems;
-
multiple use of sensors thanks to which their number is lower and they are easier to control;
-
flexible introduction of modernisation, possibly only new software without hardware changes (no new cables or controller adaptation);
-
abandoning of small controllers.
-
-
(3)
Improvement of diagnostic possibilities via:
-
mutual controlling of systems;
-
greater integration of system;
-
detection of defects in the case of data transmission interruption.
-
-
(4)
Relief for microchips, as no double transformation of signals in digital and the other way round occurs; data is exchanged digitally.
In CAN standard receiver addresses, also called identifiers, are transferred as the integral part of the transmission. Identifiers may be 11-bit or 29-bit. An identifier enables identification of the transmission contents (e.g. engine rotational velocity). The node (receiver) processes only the data whose identifier is included in the list of transmissions received by the node. All other data are ignored by the node. This method of addressing enables transmission of signals to many nodes, where the sensor sends its signals to the data bus directly or via the controller where they are distributed. In this way many variants of equipment may be performed easily, as further nodes may be connected to the already existing CAN system (open structure).
One of the CAN network’s principles is that in the given moment many receivers may be active but only one transmitter. If CAN data bus is free each node may start data transmission. If many transmitters start data transmission simultaneously then the arbitration mechanism activates. The first transmitted data will be those of the highest priority, with no time and bit loss. Transmitters of data of lower priority send them automatically to receivers repeating the trials as long as the data bus is free again.
In OBDII information on defect that has occurred is displayed to the driver using MIL (Malfunction Indicator Light).
Generally, display of diagnostic information registered by the diagnostic system may be performed using: monitor, printer, digital or analogue indicators.
Vehicles are equipped with standard 16-plug DLC (Data Link Connector). This connector is placed in the cab on driver’s side or in passenger seat area with access and identification possibility for service employees.
In standards SAE J1978 and ISO 150314 functional and electrical properties of a device to display and reading of information as well as interference on element status for OBDII have been determined. The standards include requirements concerning all solutions and manual tools, computer programmes and stationary diagnostic devices.
The device has been called OBDII Generic Scan—GST Tool. The basic GST functions include:
-
automatic identification of serial transmission;
-
display of diagnostic tests results;
-
receipt and presentation of emission trouble codes;
-
display of current values of parameters influencing exhaust gases emissions;
-
deletion of error codes;
-
other.
-
The following OBDII scan tools are available:
-
Handheld—generic;
-
programmed (producer’s).
A handheld reader (scan tool) (Fig. 9) is held in hands which facilitates analyst’s work. There are two versions of handheld scan tools: basic and expanded.

General view of OBD data readers; (a) programmed scan tool; (b) handheld scan tool reader
In basic version, according to SAE, the following functions are possible:
-
automatic detection of transmission protocol type;
-
MIL status readout;
-
diagnostic monitor readout;
-
error code readout;
-
readout of frozen frame;
-
readout of parameter values;
-
deletion (cleaning) of information.
Expanded versions of the handheld scan tool may include additional different information depending on the producer.
Programmed scan tool is a portable or stationary IBM/PC computer that enables the analysis of data on the status of elements obtained from OBDII or EOBD. Comparing to handheld scan tools this device has expanded functions of display of the results of filing, report printing, etc.
It shall be pointed that the external diagnostic system of a motor vehicle (expression 1, 4, Fig. 6) covers other diagnostic devices such as: exhaust gases analysers, engine braking, rolling devices, etc.
3 Diagnostics of Spark-Ignition Engines
3.1 Unconditional—Continuous Algorithm of the Combustion Process Diagnosis—Misfiring
The following is checked in spark-ignition engines:
-
ignition system—using the engine’s spot crankshaft rotational velocity or spot torque analysis;
-
catalytic converter, oxygen sensors before and behind the converter, their heating system;
-
systems: exhaust gases recirculation, fuel vapour evacuation, make-up air supply;
-
elements of fuel and air feeding system, i.e. fuel pressure regulator, injectors, fuel tank and inlet system leakproofness;
-
elements of adjustment the mixture composition in the function of rotational velocity and engine loading;
-
air compressor and flowmeter;
-
thermostat and timing gear system;
-
electronic pedal of accelerator, brake and clutch;
-
CAN data transmission network;
-
other system, i.e. electric system circuits, sensors and actuating devices.
Depending on the exhaust emissions, spark-ignition engine elements may be divided into three groups:
-
(1)
Group A—elements of the highest emission risk. A group includes elements and systems whose damaging or wear causes considerable increase of emissions. Vehicles operated with damaged elements of group A become significant emitters of toxic compounds. Group A covers the following elements: combustion process (detection of misfiring), catalytic converter, oxygen sensor, EVAP.
-
(2)
Group B—elements of average emission risk. These include mainly special systems introduced to limit toxic compounds emissions: EGA exhaust gases recirculation system, make-up (secondary) air system, mixture ingredient control system, PCV (Positive Crankcase Ventilation).
-
(3)
Group C—elements of potential emission risk. It covers system elements defined in American standards (none of which is covered by group A and B) which: directly or indirectly transmit the signal to central controller, or receive commands from the module, and damaging of which in normal operation conditions may cause increased emission, or are used in diagnostic procedures of other elements.
Algorithms of diagnostics of spark-ignition engine elements may be classified as:
-
(1)
unconditional—which means that they may be performed in any driving conditions, combustion process diagnosis algorithm—misfiring;
-
(2)
conditional, i.e. performance possible after obtaining positive results of other diagnostic tests.
Further in this chapter, the nature of several diagnostic algorithms will be discussed.
The following methods of identification of spark-ignition engine misfiring may be classified (Merkisz and Mazurek 2002; Rokosch 2007):
-
(1)
analysis of spot value of the crankshaft angular velocity (Fig. 10);
Fig. 10 
Graphical presentation of a S.I. engine spot crankshaft rotational speed (Niziński i inni 2011). (1) crankshaft; (2) toothed ring; (3) inductive sensor; (4) signal matching system; (5) analogue signal; (6) A/C converter; (7) controller; (8) programme
-
(2)
analysis of spot value of the exhaust gases pressure;
-
(3)
measurement and analysis of the ionisation signal in combustion chamber;
-
(4)
measurement and analysis of the engine’s torque;
-
(5)
analysis of optical signals recorded in the combustion chamber.

The analysis of the engine’s spot crankshaft rotational velocity is commonly used at present (Fig. 10).
3.2 Conditional—Non-continuous Algorithm of Catalytic Converter and λ Probe
Catalytic converter (catalyst) changes toxic compounds in exhaust gases into non-toxic. The following methods of catalytic exhaust gases treatment are known (Fig. 11) (Merkisz and Mazurek 2002; Rokosch 2007; Sterowanie silników o zapłonie iskrowym. Układy Motronic. Podzespoły. Informator techniczny BOSCH 2002; Sterowanie silników o zapłonie iskrowym. Zasada działania. Podzespoły. Informator techniczny BOSCH 2002):

A diagram of basic catalytic converters (described in text), (prepared based on (Merkisz and Mazurek 2002; Sterowanie silników o zapłonie iskrowym. Zasada działania. Podzespoły. Informator techniczny BOSCH 2002)); (1) engine; (2), (3) catalytic converter; (4) make-up air valve; (5) exhaust gases recirculation valve
-
(1)
single oxidising catalyst (Fig. 11a);
-
(2)
double oxidising-reducing catalyst—with make-up (secondary) air supply (Fig. 11b);
-
(3)
single oxidising catalyst with exhaust gases recirculation system (Fig. 11c);
-
(4)
single multifunction catalyst (Fig. 11d).
The task of oxidising catalyst (pre-converter, starting) is to combust carbon monoxide CO and hydrocarbons HC. The double oxidising-reducing catalyst reduces nitric oxides NOx and oxidises CO and HC, while the single oxidising catalyst with exhaust gases recirculation valve enables reduction of NOx, CO and HC.
Currently, catalytic converters of triple action are used where the following basic reactions take place:
Euro 6 emission standard for M class vehicles propelled by spark-ignition engines includes the following limit values: CO—1.0 g/km; HC—0.10 g/km; NOx—0.06 g/km; PM—0.005 g/km
The basic element of the converter is granulate carrier 1, most frequently ceramic granulate. Monolith, honeycomb structure is composed of three layers: catalytic, intermediate and ceramic carrier.
The catalytic layer enabling the reaction is a compound of platinum (base) and rhodium in 5:1 proportion. The intermediate layer contains caesium oxides as activators (promotors). Its task is to collect oxygen O2 for λ > 1 and giving it for λ < 1 and increase calendar stability. The carrier’s material is ceramics (cordierite) in the form of magnesium oxide MgO, aluminium oxide Al2O3 and silicone dioxide SiO2. The number of canals per 1 cal2 (cpsi) is 400–500.
The quality of catalyst performance may be described by the conversion coefficient “k”. It defines per cent conversion of individual toxic compounds in exhaust gases into non-toxic ones (Fig. 12).

Graphic presentation of the relation of conversion coefficient of a three-function catalytic converter of function λ, prepared based on (Rokosch 2007)
where:
- i :
-
concentration of exhaust gases before the catalyst;
- j :
-
concentration of exhaust gases after the catalyst
It should be pointed that the catalyst is only one of the elements of the mixture adjustment system whose diagram is presented in Fig. 13.

A diagram of the system of adjustment of S.I. engine mixture composition (prepared based on (Sterowanie silników o zapłonie iskrowym. Układy Motronic. Podzespoły. Informator techniczny BOSCH 2002; Sterowanie silników o zapłonie iskrowym. Zasada działania. Podzespoły. Informator techniczny BOSCH 2002)): (1) S.I. engine; (2), (8) oxygen sensor (probe λ); (3) catalyst; (4) controller; (5) injectors; (6) air filter (flowmeter); (7) exhaust gases recirculation valve; (9) measurement signal; (10) injector opening time control signal (fuel charge); (11), (12), (13) exhaust gases; (14) other sensors
Generally, the system functions as follows. Combustion engine 1 is fed with fuel and air that burns. Exhaust gases contain toxic components: CO, HC, NOx.
The fundamental condition that must be absolutely satisfied to obtain major change in toxic exhaust gases into non-toxic is to supply combustion mixture of λ = 1±0.005.
The air excess ratio value λ is given by probes 2 and 8 which send a signal to controller 4. The controller also collects necessary signals from air flowmeter 6 and other sensors, such as: rotational velocity of engine crankshaft, temperature of cooling liquid, air temperature, loading and other. Based on the collected data the controller sends a controlling signal to rejectors 5, in order to determine their opening time, i.e. define the fuel charge D = f(tw), and, consequently, to determine λ, as per the engine operating conditions.
As it has been previously mentioned, adjustment of the mixture composition in spark-ignition engine is possible because of signals obtained from oxygen sensors (probe λ).
Air sensor is composed of a ceramic insert made of zirconium dioxide, stabilised with yttrium oxide, and Mg–Si oxide-coated porous platinum electrodes.
The flow of exhaust gases in the exhaust pipe flushes probe λ, the inside of which is connected with atmosphere 8 (ca. 21 % O2). Engine exhaust gases contain a certain number of oxygen particles O2. Therefore, a potential difference occurs on probe electrodes, which causes Us voltage current flow in the voltage indicator circuit.
The value of signal transmitted by probe λ depends on the type of fuel–air mixture supplied to the cylinder (rich, weak).
Diagnosing of spark-ignition engine catalytic converter is performed based on the data contained in the signals received from probe λ (Fig. 13). If the catalyst is fit there are considerable differences between the signals (Fig. 14a) and if the catalyst is damaged the signal from sensor located after the catalyst is no longer significantly weaker and is similar to the signal from the sensor located before the catalyst (Fig. 14b).

Graphic presentation of the condition of catalytic converter (prepared based on (Rokosch 2007)) (a) fit catalyst; (b) unfit catalyst, (1) sensor signal after catalyst; (2) sensor signal after catalyst
The air sensor enables precise adjustment of the mixture composition critically influencing the value of exhaust gases emission. Its diagnostics consists in monitoring of the voltage of measuring element and measurement of voltage and current in the sensor heating circuit. Figure 15a illustrates the course of a fit sensor signal and a damaged sensor signal, while Fig. 15b shows a signal from a new and a worn sensor. Figure 15c and d presents deceleration of the sensor’s reaction to modification of the mixture composition resulting from its aging.

Changes of oxygen sensor signal (probe λ) (Janiszewski and Mavrantzas (2009): (a) fit and damaged sensor; (b) new and worn-out sensor; (c) verification of sensor reaction; (d) prolongation of sensor reaction time
3.3 Algorithm of Diagnostics of Fuel Vapours Evaporation System
The purpose of the evaporative emission control system (Evaporation Prevention—EVAP) (Fig. 16) is to reduce the emission of hydrocarbons resulting from evaporation and escape to atmosphere of the light fractions of fuel in the tank.

Simplified diagram of fuel vapours evaporating system (EVAP) (prepared based on Rychter and Teodorczyk 2006): (1) engine; (2) air filter; (3) fuel tank; 4 fuel vapours sensor; (5) initial valve; (6) fuel vapours absorber filter; (7) fuel vapours flow control valve; (8) air flow control valve; (9) catalyst; (10) lambda probe; (11) controller
Due to high temperature, vapours of fuel in tank 3 flow through the pre-valve 5 to the filter via absorber 6. The absorber’s insert shall be activated carbon with diversified surface structure (200–1500 m2/g), having perfect absorption features. Opening of control 7 causes that a part of air drawn in by the engine flows first by absorber 6 catching the fuel vapour and carrying it off to the engine’s suction manifold where they are burnt. The statuses of the system’s operation are controlled by controller 11 with the use of the signal from probe λ 10.
Depending on the level of absorber filling, three operational statuses of EVAP system may be distinguished:
-
(1)
empty absorber—the system works, the engine feeding mixture is weaker;
-
(2)
overfilled absorber—the system works, the mixture in enriched;
-
(3)
absorber filling conforms to mixture λ = 1.
The criterion that determines the system’s unfitness is leakage. In OBDII, EVAP is monitored by the system of leakage detection VLDS II (Second Generation Vacuum Leak Detection System). The diagnostic signal is decay of negative pressure in the system compensated with the opening diagram: ø = 1; 0.5; 0.25 mm.
4 Diagnostics of a Compression-Ignition Engine
4.1 Diagnostics of Exhaust Gases Recirculation System
Only some of the tests justified in the case of spark-ignition engines may be, after relevant modification, applied to compression-ignition engines. Below presented are the tests applied exclusively to compression-ignition engines concerning:
-
injection advance angle;
-
fuel injection initiation;
-
fuel charge values in the rotational velocity and engine loading function;
-
misfiring;
-
status of: injectors, exhaust gases recirculation system, glow plugs, fuel pressure accumulator, particle matter filter, catalytic converter and compressor;
-
status of controller and CAN data bus;
-
sensors of, for instance: engine rotational velocity, make-up air temperature, injector needle travel, exhaust gases temperature, etc.
Considering the high number of elements to be diagnosed, in general, only some of the diagnostic procedures will be discussed here. Namely, those concerning exhaust gases recirculation, particle matter filter, and catalytic converters.
In the case of compression-ignition engines, there are two methods to reduce toxic exhaust gases emissions, i.e. by (Merkisz and Mazurek 2002; Rokosch 2007; Sterowanie silników o zapłonie samoczynnym Podzespoły. Informator techniczny BOSCH 2000):
-
optimisation of the fuel combustion process;
-
use of particle matter filter and catalytic converters.
As it has been described above, favourable conditions for engine operation that contribute to generation of high concentrations of nitric oxides NOx occur with high combustion temperatures of weak mixtures (λ < 1). An important system fostering the reduction of nitric oxides is the exhaust gases recirculation system.
The system directs a part of the exhaust gases (0–30 %) from the exhaust manifold to the suction manifold via an EGR valve (Exhaust Gas Recirculation) (Fig. 17).

Nature of exhaust gases recirculation system operation; (1) fuel injector, (2) exhaust gases recirculation system valve EGR, (3) λ probe, (4) EDC controller. (5) turbo compressor
Supplying the exhaust gases to the combustion chamber results in the reduction of spot values, local combustion temperatures of oxides, thus reducing the intensity of binding between nitrogen N2 and oxygen O2, i.e. reducing the quantity of nitric oxides (NO, NO2, N2O, N2O5).
Application of exhaust gases recirculation at the value of 0–15 % does not cause any growth of the CO emission. While with a higher level of exhaust gases recirculation the combustion time extends, making the emissions of CO, HC, and PM go up.
The recirculation of exhaust gases proves to be a good solution both for S.I. and C.I. engines. It allows reducing the emissions of NOx even up to 50 %.
Direct measurement of CO, HC, NOx, PM emissions is possible only with a very complex measuring system. Therefore, OBD system diagnoses emissions indirectly by identifying the statuses and parameters of:
-
closing and opening of the EGR valve;
-
exhaust gases recirculation valve;
-
atmospheric air pressure sensor;
-
mass air flow sensor.
It shall be here pointed that a reduction of toxicity of compression-ignition engine exhaust gases may be obtained in the following ways (Rokosch 2007):
-
high-pressure fuel injection;
-
more intense air whirling in the combustion chamber;
-
shortening of injection time;
-
injection of the guiding charge;
-
four-valve technology (four valves per cylinder);
-
Common-Rail system and injection unit.
4.2 Diagnostics of Particle Matter Filter
Particle matter filter is an effective tool used to limit the emission of solid particles (PM—see item 1.1) outside the C.I. engine. The filtering insert is made of cordierite, titanium (Ti) and aluminium (Al) compounds, metals with porous foamy structure or sintered metal oxides. A part of the canals through which the exhaust gases flow (ø = 0.0001 mm) are 230–300 cpsi (cell per square inch). Filter fitness η ≈ 99 %.
During engine operation the filter is polluted with solid particles. Therefore, its diagnostics and regeneration becomes a crucial issue.
The filter of solid particles may be regenerated by burning the carbon black and hydrocarbons with one of the following methods (Rokosch 2007):
-
(1)
without fuel additives;
-
(2)
with fuel additives.
The first method covers two solutions:
-
(a)
artificial increasing of exhaust gases temperature by adequate improvement of the fuel injection process, using fuel late-injection (Fig. 18a) at the exhaust stroke. The result of late-injection is that fuel does not combust in the combustion chamber but only evaporates. Fuel combustion takes place only in the particle matter filter, which reduces their value even by 40 %. It must be emphasised that combustion of carbon and hydrocarbons included in the PM takes place at t > 600 °C, i.e. it is an active filter regeneration (Fig. 18b).
Fig. 18 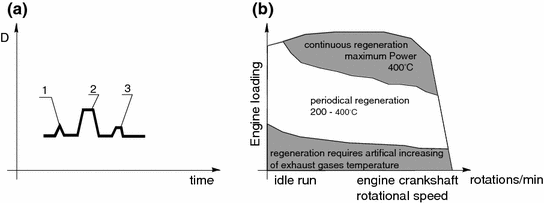
Illustration of late injection (a) and conditions of engine operation where regeneration of the particular solids filter supported with catalyst is possible, (1) fuel charge; (2) supply charge (basic); (3) fuel late injection; prepared based on (Rokosch 2007)
-
(b)
burning of solid particles using a catalyst that lowers the minimum combustion temperature to 350–500 °C, at which the solid particles are burnt (Fig. 18b) (passive regeneration). The catalyst replaces additives supplied with fuel.

Application of fuel additives enables lowering of the minimum temperature necessary to regenerate the filter to 400 °C. The additives are caesium or ferrum oxides.
Diagnostics of a polluted solid particles filter consists in measurement of pressure value before and the filter, as such pressure is much higher. Additional performance of exhaust gases temperature measurement and using of the air flowmeter signal allows assessing the filter’s pollution and initialising of the regeneration process.
4.3 Diagnostics of Catalytic Converter
Compression-ignition engines combust weak mixtures (λ > 1). Hence, the emissions of CO and CmHn are lower than in the case of spark-ignition engines. Nevertheless, the problem of lowering the emission of NOx still remains. Exhaust gases recirculation is not sufficient for the purpose.
Two major methods of NOx reduction is exhaust gases may be distinguished (Rokosch 2007; Sterowanie silników o zapłonie samoczynnym Podzespoły. Informator techniczny BOSCH 2000):
-
with accumulating catalyst of NO x
-
selective catalytic reduction—SCR.
The nature of accumulating NOx reduction is based on the following reactions (Fig. 19):

A diagram of NOx recirculation system accumulating method (prepared based on (Rokosch 2007; Sterowanie silników o zapłonie samoczynnym Podzespoły. Informator techniczny BOSCH 2000)), (1) engine; (2) exhaust gases heating (option); (3) oxidizing catalyst (option); (4) temperature sensor; (5) broadband lambda probe LSU; (6) accumulating catalyst NOx; (7) NOx sensor or lambda probe; (8) controller
The exhaust gases heater 2 is to reduce the emission of toxic compounds when starting the engine. A reaction (1.19) takes place in the catalyst. The process of NOx reduction is made of phases: accumulation, discharge and conversion.
The accumulation phase (storing) (60 s of engine operation—λ > 1) nitric oxides are oxidised on the platinum layer to nitrogen dioxide NO2. Then, NO2 reacts with special oxides at the surface of the catalyst forming nitrates with oxygen. For instance, as a result of NO2 reaction with barium oxide BaO, barium nitrate (NO3)2 is formed (12). The accumulating NOx catalyst accumulates nitric oxides generated in the case of an engine operating in the excess of air.
The discharge phase covers regeneration of the catalyst, i.e. the accumulated nitric oxides must be processes (1.13). For that reason the engine is switched to operate on a rich mixture (λ < 1–2 s. of engine operation). Here, the reducing substances are H2, CH, and CO.
In conversion phase, reaction (1.13) takes place where the rhodium coat finally reduces NO, in the presence of CO, to N2 and CO2.
It shall be pointed that the broadband λ probe (German ‘Lambda—Sonde Universal’) is able to measure the air excess ratio with broad limits (λ = 0.7–3.4); hence, it is used for petrol, gas, and diesel engines. The probe’s typical property is its linearity.
The SCR method assumes dosing of 32.5 % diesel exhaust fluid (NH2)2CO), from which ammonia (NH3) is obtained in catalyst 6 (Fig. 20).

A diagram of NOx reduction system in C.I. engines using SCR (prepared based on (Sterowanie silników o zapłonie samoczynnym Podzespoły. Informator techniczny BOSCH 2000)): (1) engine; (2) temperature sensor: (3) oxidizing catalyst; (4) injectors; (5) NOx sensor; (6) hydrolytic catalyst; (7) SCR catalyst; (8) NH3 blocking catalyst; (9) NH3 sensor; (10) controller; (11) reducing agent tank; (12) pump; (13) reducing agent level sensor
The fluid is supplied using pump 12, from tank 11, to injector 4 located in the exhaust manifold of the engine.
The following reaction takes place in oxidizing catalyst 3:
while in catalyst 6 the reactions of:
-
(a)
thermolysis:
$$ \left( {{\text{HN}}_{2} } \right)_{2} {\text{CO}} \to {\text{NH}}_{3} + {\text{HNCO}} $$(14) -
(b)
hydrolysis:
$$ {\text{HNCO}} + {\text{H}}_{2} {\text{O}} \to {\text{NH}}_{3} + {\text{CO}}_{2} $$(15)
Reduction of nitric oxides to N2 and H2O takes place in catalyst 7 according to the following reaction:
Catalyst 8 prevents NH3 discharge to the atmosphere. The conversion of nitric oxides approximates 90 %. Additionally, the system enables reducing of the emission of particle matter by circa 40 %.
SCR diagnostics is based on the measurement of:
-
the level of reducing agent in the tank (by measuring of the solution’s electric conduction).
-
fluid temperature, when the agent freezes at −11 °C its volume grows by 10 %, while exceeding the temperature of 40 °C accelerates chemical degradation of the urea solution;
-
electric conduction of urea allowing detection of fluid dissolving or application of incorrect fluid.
Data from sensors 2, 4, 5, 9, 11, 13 (Fig. 20) are supplied to the controller (diagnostic system) where they are processed to make the diagnosis on fitness or unfitness (control light on) of the system.
5 Trends in Motor Vehicle Diagnostic Systems Improvement
Currently applied OBD systems (Merkisz and Mazurek 2002; Rokosch 2007):
-
are good tools for early detection of single malfunctions of elements relating to exhaust gases emission; they enable repairing of contemporary more and more complex engine control systems;
-
remember the engine operating conditions, which enables malfunction location;
-
offer a possibility to detect incorrect signals from sensors, damaged servos and other actuating segments, which enables the engine service-repair process;
-
the OBD possibilities are limited as they do not make automatic identification of the causes of malfunction possible;
-
do not always enable detection of complex consequential malfunction;
-
do not give grounds to foresee the consequences of malfunction;
-
do not offer direct monitoring of concentrations of toxic compounds of exhaust gases;
The trends to improve diagnostic systems for motor vehicle engines are determined by numerous factors, in particular:
-
(1)
lowering of the admissible limits of toxic compound emission and inclusion or so far not limited exhaust gases in the toxicity assessment;
-
(2)
influencing the toxic exhaust gases emission by:
-
modification of engine structure that offers to most favourable combustion process, optimisation of the opening and valve travel phases as well as change of the compression level;
-
application of new systems of charge combustion combining the properties of circulation of S.I. and C.I. engines, which eliminates the differences between the engines;
-
more frequent use of supercharged S.I. engines;
-
application of two smaller pressure charging units instead of one compressor;
-
application of new catalytic converters, filters and other elements.
-
-
(3)
considering a compromise between the ecological and economical requirements of the purposeless of designing sophisticated engine element solutions;
-
changing the type of fuel, which generates structural modification of engines allowing for the following criteria: ecological, fuel consumption reduction, vehicle movement dynamics and driving comfort.
-
Given the analysed issues, the development of motor vehicle diagnostic systems will head the following directions:
-
increased durability of the solutions applied, aiming at limitation of toxic exhaust gases emissions;
-
development of new methods to monitor ecological properties of combustion engines;
-
construction of new generation sensors for measurement of measured values (physical quantities);
-
application of sensors to measure concentrations of toxic compounds in exhaust gases;
-
direct measurement of concentrations of gaseous components of exhaust: CO, CnHm, NOx and particle matter;
-
monitoring of the process of combustion in engines and optimisation of fuel injection parameters using new diagnostic signals;
-
replacing OBD with OBM (On-Board Measurement) system, enabling direct measurement of exhaust gases concentration values which will ensure more precise control over the emission properties of engines even if consequential malfunction occurs;
-
extending the OBD obligation onto motorcycles;
-
introducing exhaust gasses limits and OBD for engines of other machinery and stationary engines;
-
development of a diagnostic method to assess the quality of fuel used;
-
development of hierarchical diagnostic models and diagnostic algorithms for entire motor vehicles;
-
development of on-board concepts and onboard-external diagnostic system concepts for entire motor vehicles;
-
development of diagnostic methods and algorithms as well as diagnostic systems for engines fuelled with hydrogen;
-
development of methods and algorithms to diagnose fuel cells;
-
development of hierarchical diagnostic models and diagnostic algorithms as well as diagnostic systems for hybrid vehicles and electrically propelled vehicles.
Given the analysed issues, it has been found as follows:
-
motor vehicle diagnostics faces serious challenges caused by introduction of new, alternative fuels, especially LPG, natural gas: CNG and LNG, vegetable oils, biogas, alcohols and hydrogen;
-
because of determining the levels of toxic compounds in exhaust gases, currently used OBD meet the basic requirements of the monitoring of status and malfunction location in S.I. and C.I. engines;
-
there is a trend to substitute OBD with a system of direct measurement of toxic levels (OBM) that will enable more precise definition of the physical properties;
-
there is a need of extending the toxic vapours elimination systems onto all vehicles, including military motor vehicles;
-
it is necessary to elaborate improved OBDs covering the entire motor vehicle;
-
diagnostics of hydrogen fuelled engines, fuel cells, hybrid and electrical vehicles need to be introduced;
-
systems must be provided to control safety of motor vehicle.
To summarise the analysed issues concerning formal aspects and assessment of civil diagnostic systems for motor vehicles the following may be stated:
-
a motor vehicle diagnostic system consists of two sub-systems: on-board and external;
-
with reference to consequences, malfunction of diagnosed elements may be classified as: emission-related, safety-related, non-emission related, driving comfort-related;
-
to diagnose motor vehicle elements, relevant algorithms are used, including but not limited to: electric fitness of measuring and actuating elements, emission—continuous—unconditional and non-continuous—conditional;
-
in contemporary motor vehicles data is transferred using a serial digital communication of classes A, B, C;
-
a key element of OBD is the communication sub-system including: sensors, controller, data display panel, DCL and software;
-
spark-ignition combustion engines are equipped with well-developed algorithms of diagnosing the elements influencing the level of exhaust gases toxicity, particularly: misfiring, catalytic converter, oxygen sensor (λ probe), exhaust vapours evaporation system, fuel charge defining.
-
compression-ignition engines are also equipped high diagnostic quality solutions for such elements and systems as: exhaust gases recirculation system, particle matter filter, catalytic converter.
References
Berhart M, Dobrzyński S, Loth E (1969) Silniki samochodowe. WKŁ, Warszawa
Bocheński C (ed) (2000) Badania kontrolne samochodów. WKŁ, Warszawa
Bocheński C, Janiszewski T (1998) Diagnostyka silników wysokoprężnych. WKŁ, Warszawa
Gronowicz J (2004) Ochrona środowiska w transporcie lądowym. ITE, Radom – Poznań
Gronowicz J (2008) Niekonwencjonalne źródła energii. ITE, Radom–Poznań
Günther H (2002) Diagnozowanie silników wysokoprężnych. WKŁ, Warszawa
Hebda M, Niziński S, Pelc H (1984) Podstawy diagnostyki pojazdów mechanicznych. WKŁ, Warszawa
Herner A, Riehl HJ (2004) Elektrotechnika i elektronika w pojazdach samochodowych. WKŁ, Warszawa
Janiszewski T, Mavrantzas S (2009) Elektroniczne układu wtryskowe silników wysokoprężnych. WKE, Warszawa
Jastrzębska G (2007) Odnawialne źródła energii i pojazdy proekologiczne. WNT, Warszawa
Kneba Z, Makowski S (2004) Zasilanie i sterowanie silników. WKiŁ, Warszawa
Luft S (2003) Podstawy budowy silników. WKiŁ, Warszawa
Merkisz J, Mazurek S (2002) Pokładowe systemy diagnostyczne pojazdów samochodowych. WKŁ, Warszawa
Merkisz J, Pielecha I (2006) Alternatywne napędy pojazdów. Politechnika Poznańska, Poznań
Niziński S (ed) (1999) Diagnostyka samochodów osobowych i ciężarowych. Bellona, Warszawa
Niziński i inni (2011) Systemy diagnostyczne wojskowych pojazdów mechanicznych. ITE, Radom
Niziński S, Michalkis R (2002) Diagnostyka obiektów technicznych. ITE, Radom
Rokosch U (2007) Układy oczyszczania spalin i pokładowe systemy diagnostyczne samochodów OBD. WKŁ, Warszawa
Rozporządzenie (WE) NR 715/2007-W sprawie homologacji typu pojazdów silnikowych w odniesieniu do emisji zanieczyszczeń pochodzących z lekkich pojazdów pasażerskich i użytkowych (Euro 5 i Euro 6) oraz w sprawie dostępu do informacji dotyczących naprawy i utrzymania pojazdów
Rychter T, Teodorczyk A (2006) Teoria silników tłokowych. WKŁ, Warszawa
Sitek K (1999) Diagnostyka samochodowa. Wyd. Auto, Warszawa
Sterowanie silników o zapłonie iskrowym. Układy Motronic. Podzespoły. Informator techniczny BOSCH, WKŁ, Warszawa (2002)
Sterowanie silników o zapłonie iskrowym. Zasada działania. Podzespoły. Informator techniczny BOSCH, WKŁ, Warszawa (2002)
Sterowanie silników o zapłonie samoczynnym Podzespoły. Informator techniczny BOSCH, WKŁ, Warszawa (2000)
Trzeciak K (1998) Diagnostyka samochodów osobowych. WKŁ, Warszawa
Patent application No. P-386761: Sposób i instalacja do utylizacji odpadów w postaci tłuszczy zwierzęcych. Urząd Patentowy (2008)
Author information
Authors and Affiliations
Corresponding author
Editor information
Editors and Affiliations
Rights and permissions
Copyright information
© 2014 Springer-Verlag Berlin Heidelberg
About this chapter
Cite this chapter
Rychlik, A., Jasiulewicz-Kaczmarek, M. (2014). Diagnostics Systems as a Tool to Reduce and Monitor Gas Emissions from Combustion Engines. In: Golinska, P. (eds) Environmental Issues in Automotive Industry. EcoProduction. Springer, Berlin, Heidelberg. https://doi.org/10.1007/978-3-642-23837-6_5
Download citation
DOI: https://doi.org/10.1007/978-3-642-23837-6_5
Published:
Publisher Name: Springer, Berlin, Heidelberg
Print ISBN: 978-3-642-23836-9
Online ISBN: 978-3-642-23837-6
eBook Packages: Earth and Environmental ScienceEarth and Environmental Science (R0)