These keywords were added by machine and not by the authors. This process is experimental and the keywords may be updated as the learning algorithm improves.
The regulation of enzymatic activity through non-covalent interactions allows the cell to react quickly and in a reversible manner.
1 Allosteric Regulation
So-called “allosteric” enzymes are responsible for the phenomenon of regulation through retroinhibition which is observed in most metabolic pathways. The phenomenon arises when one of the final metabolites inhibits the activity of the first enzyme that leads to its biosynthesis:
If we consider the transformation of metabolite A into metabolite F, which involves five steps each catalysed by a specific enzyme (E1 to E5), retroinhibition consists in the fact that the final metabolite F inhibits the activity of the enzyme E1, limiting in this manner its own production. The described schematic case is the simplest one. Frequently, regulatory enzymes are also subject to an activation process by a metabolite which belongs to another metabolic pathway, which leads to crossed regulation phenomena, and we shall see examples of this. Several antagonisms of the type described contribute, for example, to equilibrate the biosynthesis of purine and pyrimidine nucleotides in the cell. The enzymes which are the subject of this type of regulation are called allosteric enzymes (Monod et al., 1963). The term was chosen to express the fact that the regulating metabolite (F) whose structure is diferent than that of the substrate, binds to a stereospecific site (regulatory site), which is distinct from the catalytic site. The hypothesis was verified in all the cases of allosteric enzymes whose structure has been determined with sufficient precision.
The majority of allosteric enzymes are oligomers which show cooperative effects in substrate binding. In the simplest case, the binding of the first substrate molecules favours the binding of the following ones. In other cases, it is the catalytic efficiency which increases with the proportion of catalytic sites occupied by the substrate. Later on, we shall return to the distinction which should be made between allostery and cooperativity. The phenomenon of cooperativity between catalytic sites of an oligomeric enzyme also allows it to modulate in a positive or negative manner the affinity of its substrate sites as a function of the substrate concentration.
2 Phenomenological Aspect of Cooperativity
When the apparent affinity of an oligomeric enzyme for the substrate increases with the degree of occupation of the catalytic sites, the curve of the variation of v, the reaction rate, as a function of substrate concentration [s], is no longer a hyperbola but displays a sigmoidal shape (Fig. 13.1 opposite). The consequence is that the saturation curve cannot be linearised as was shown earlier (Chap. 2). Figure 13.1b and c show the curves obtained from the Lineweaver-Burk and Eadie-Hofstee plots, respectively.
Fig. 13.1
(a) variation of the saturation function by the substrate, (1) for a Michaelian enzyme; (2) for an enzyme showing cooperative effects; (3) for an enzyme showing anti-cooperative effects – (b) shape of the curves in the Eadie-Hofsteeplot – (c) shape of the curves in the Lineweaver-Burkplot
In the case of the enzyme not displaying a cooperative phenomenon (enzyme displaying Michaelian behaviour), we can, on the basis of the Michaelis equation, define the function describing the saturation by the substrate using the equation:
s/Km is called the reduced substrate concentration.
As described in Chap. 5, the reaction rate varies with substrate concentration following a hyperbolic law and attains the maximum value Vm when the enzyme is saturated by the substrate. When v varies from 0 to Vm, the saturation function Ys varies from 0 to 1. If the considered reaction follows the Michaelis-Menten law, the ratio of substrate concentrations which correspond to 90% (s0.9) and 10% (s0.1) of enzyme saturation has a defined value: s0.9/s0.1 = 81. In the case of an enzyme displaying cooperative phenomenon, the ratio is inferior to 81. On the contrary, this ratio is superior to 81 in the case of enzymes displaying anticooperativity, in which case the binding of the first substrate molecules de-favours the binding of the subsequent ones (
. 13.1a).
Differences in behaviour are also evident in the variation of reaction rate as a function of the logarithm of substrate concentration. In the case of a Michaelian enzyme, the curve is symmetric on either side of the half-saturation point s0.5 and (s0.9)(s0.1)/ (s0.5)2 = 1. The symmetry of the curve is also observed in non-Michaelian systems, in particular in the case where the saturation law presents cooperative phenomena. When there is anticooperativity however, the curve is no longer symmetrical.
Allosteric enzymes are inhibited or activated by allosteric effectors. Phenomen-ologically, if the substrate saturation curve is a sigmoid (cooperative effects), the presence of an inhibitor accentuates the sigmoidal nature of the curve. On the contrary, the presence of an activator lessens it: when the activator concentration becomes sufficiently high, the curve tends towards a hyperbola (Fig. 13.2 below). Everything occurs as if the allosteric inhibitor increases the apparent Km value without changing the maximum rate, however it is not competitive inhibition. The activator reduces the value of Km without changing the maximum rate.
Fig. 13.2
Saturation by the substrate of an enzyme displaying cooperative effects
In the absence of an effector, in the presence of an activator, and in the presence of an inhibitor
Other allosteric enzymes can display different behaviour with respect to effectors. Their kinetics obeys the Michaelis law in relation to the substrate saturation of the enzyme. In the presence of an inhibitor, the saturation curve of the enzyme by the substrate stays Michaelian and the same is true in the presence of an activator. The inhibitor reduces the apparent maximal rate; the activator increases it. However, it is not a classical non-competitive mechanism. The law describing the satur-ation of the enzyme either by the inhibitor or the activator is a sigmoid, and non-Michaelian. When studying an inhibition or activation phenomenon, the test is essential before deciding on the nature of the model.
How can these behaviours be explained? The study of different models that have been proposed, allows us to better understand the other function of enzymes, the regulating function.
3 Phenomenol Models
3.1 The Hill Equation
The first formalisms to describe cooperativity phenomena were proposed by Hill, (1910) to explain oxygen binding to haemoglobin (see Chap. 2).
In the case of an enzymatic reaction, the Hill relation can be written in the following form:
The Hill proposition consists in representing the variation of log[Ys/1 – Ys] as a function of log[s]. In the case of an enzyme the variation of log[v/Vm – v] as a function of log[s] is represented (Fig. 13.3). The slope at the half-saturation point s0.5 is nH, the cooperativity index or Hill number. In Hill’s formalism, it can be shown that the numerical value of nH is between 1 and n, the number of subunits of the enzyme. Today, Hill’s plot is mainly used to furnish a phenomenological index, which indicates the degree of cooperativity of analysed saturation curves, without taking into account the underlying molecular mechanisms. It has been shown by Wyman (1964) that at extreme levels of substrate concentration the slope of Hill’s curve tends towards 1. The extrapolation of the extreme slopes theoretic-ally allows the determination of the association constants K1 and Kn, corresponding to the binding of the substrate to the first and the nth site, respectively (Fig. 13.3).
Fig. 13.3
Substrate saturation curve of an enzyme displaying cooperative effects, according to Hill’s plot
The apparent interaction energy is therefore defined as the amount of energy that must be furnished to change the affinity from K1 to Kn. On the basis of this defin-ition, Wyman calculated that the apparent interaction energy is equal to –3 kcal. mol–1 per tetramer in the case of haemoglobin. The energy is distributed over the different interfaces between subunits.
The interaction energy is the difference between the free energy of ligand binding to the second site and the free energy of ligand binding to the first site.
The interaction energy is therefore zero for a Michaelian oligomeric enzyme (ΔG2 = ΔG1). It is negative in the case of an enzyme displaying cooperativity and positive in the case of an enzyme displaying anticooperativity [Levitzki, 1978].
3.2 The Adair Equation
In 1925, after showing that haemoglobin is a tetramer, Adair proposed an explan-ation for the sigmoidal nature of the protein’s saturation curve by oxygen as a function of four association constants. As for the preceding model, the thermodynamical model makes no hypothesis on the structural mechanism involved in the variation of the constants. The Adair equation in its most general form is constructed in the following way. If we consider a protein of n identical subunits, each with a ligand binding site, and suppose that the ligand binding does not modify the degree of oligomerisation, the ligand binding can be described by the following equilibria:
where:
Φ1 = K1, Φ2 = K1K2, Φ3 = K1K2K3, Φi = K1K2K3… Ki and Φn = K1K2K3… Ki… Kn
The average number of ligand molecules bound per enzyme molecule is given by:
However, the expressions described above remained at a phenomenological level, and did not offer any interpretation of the change in intrinsic constant. In 1935, Pauling was the first who tried to relate the variations of affinity constants to the geometry of the protein. He supposed that the four haemoglobin sites are equivalent and therefore possess the same intrinsic affinity constant for oxygen. Furthermore, he introduced an interaction factor depending on the arrangement and conformation of the four subunits. The explanation of the change in the interactions between hemes upon oxygen binding was based upon conformational variations in the protein. Crystallographic studies brought the experimental proof of Pauling’s interpretation (1960). Various models were developed thirty years later, all of which explained the observed effects in terms of protein conformational changes.
4 The Concerted Model(Monod, Wyman & Changeux, 1965)
4.1 Definition
The concerted model developed by Monod, Wyman and Changeux is based on the following postulates:
In the absence of any ligand, a protein which displays cooperative effects exists as an equilibrium of two conformations:
The equilibrium is defined by the allosteric constant L0, such that L0 = (T0)/(R0). The two states differ by the interaction free energy between the subunits, the interaction energy being stronger in the T state, in which the subunits are subjected to stronger conformational constraints.
All the protomers in the oligomer are identical and display at least one symmetry axis between them, in both the R and T states. The concept of symmetry assumes a great importance in the model. It follows that the transition from T to R is concerted, without formation of hybrid intermediate species, the symmetry is conserved on the passage from one form to the other.
Each protomer possesses one substrate binding site, these sites are equivalent and independent (see Chap. 2). The sites are related to one another by the same symmetry axis as the protomers in the oligomer.
Each protomer can possess one or several regulatory sites capable of binding an allosteric inhibitor or activator, which are distinct from the catalytic site. The regulatory sites possess the same symmetry axis as the protomers in the oligomer.
The model distinguishes homotropic effects between sites binding the same ligand and heterotropic effects between sites which bind different ligands (substrates and effectors for example).
From the described postulates, two types of system were proposed, K systems and V systems.
4.2 K Systems
In K systems, R and T states display respectively strong and weak affinities for the substrate S, by definition (KR < KT, KR and KT are the intrinsic substrate dissociation constants for R and T forms). They both possess the same catalytic constants however (kcatR = kcatT). The consequence is that, when the substrate concentration increases, the equilibrium is shifted towards the R state, although the binding sites are not yet saturated. If the protein has n substrate binding sites, the following equilibria exist:
In the model, all the sites are considered equivalent and independent for both R and T states. Therefore, there are multiple equilibria of n equivalent and independent sites (vertical equilibria) linked by conformational equilibria (horizontal equilibria). The model allows the protein’s state function to be defined, that is, the fraction of molecules in the R state, and the saturation function, fraction of sites occupied by the substrate. The preceding definitions imply that, as the concentration of S increases, the state function pre-empts the saturation function.
In the following we shall consider an oligomeric enzyme formed of identical protomers each with a catalytic site and the following definitions:
n = the number of protomers;
KR and KT, the substrate microscopic dissociation constants for the R and T states, respectively;
α = [s]/KR the reduced substrate concentration;
c = KR/KT the ratio of the microscopic dissociation constants. The ratio is named the non-exclusion coefficient because it takes into account the fact that S can also bind to the T state, which is the opposite of what occurs in a so-called exclusive system. In the case of an exclusive system, c 0.
As a function of the above parameters, the saturation function is written as:
$$Y_s \;\; = \;\;\frac{{\hbox{\rm{(sum of all
molecules that have bound substrate)}}}}{{\hbox{\rm{(total protein)}}}}$$
The above expression has two terms; the term α(1 + α)n/[denominator] expresses the R state saturation and L0cα(1 + cα)n–1/[denominator] expresses the T state saturation.
This expression clearly shows that the observed cooperativity is the result of a Michaelian saturation, linked to a transformation function of the protein which varies as a function of the saturation. The first term expresses this fact for the R form, the second for the T form. The difference between the above and the Michaelis laws is therefore due to the protein transformation function.
In K systems in the concerted model, the homotropic effects are necessarily co-operative. The cooperativity depends on the values of the parameters L0 and c. If the substrate displays a higher affinity for the R state, c will be less than 1. If the constant L0 is large, the T state will be the dominant form in the absence of a ligand. The larger L0, the smaller c, and the more important the cooperativity.
In the case of exclusive substrate binding in the R state of the enzyme, the expressions given for the saturation and state functions are simplified; they become:
which is the expression corresponding to a Michaelian saturation law. The Michaelis law can therefore be considered as a limiting case of the allosteric model of Monod, Wyman and Changeux.
It is to be noted that if c = 1, that is to say, when both R and T states have the same substrate affinity, which is true in V systems as shall be discussed later, the saturation function is also Michaelian.
If we consider that the two extreme states differ only in their substrate affinity, the reaction rate will be proportional at all times to Ys and the proportionality factor is the catalytic constant k3.
The more complex situation in which the extreme states T and R also differ in their catalytic efficiency will be considered later.
The model was also conceived to take into account heterotropic effects that imply allosteric inhibition or activation. Monod, Wyman and Changeux considered that an inhibitor binding site and an activator binding site is present on each protomer. The state which has the highest substrate affinity also has the highest activator affinity. The state which has the lowest substrate affinity displays the highest affinity for the inhibitor. The allosteric activation and inhibition are therefore explained by the shift of the conformational equilibrium towards the state which has the highest substrate affinity (activation), and towards the state which has the lowest substrate affinity (inhibition). Everything occurs as if the conformational constant L0 is modified by the presence of the effectors. As shall be seen later, this postulate is not always in agreement with experimental data.
The same expressions as given previously are valid for the functions Ys and R, where L0 is replaced by a new allosteric constant L′ such that:
L′ varies with the saturation degree of the enzyme for each effector. L′ increases when the inhibitor concentration increases, and decreases with the activator concentration. L′ is an apparent allosteric constant such that:
Since the substrate and the activator have a preferential affinity for the R state, when all the enzyme is saturated by the activator, the cooperativity for substrate binding disappears and the Ys function becomes Michaelian. In a reciprocal fashion, when the enzyme is saturated by the substrate, the activation phenomenon disappears. If the activator concentration is very high, Ys tends towards a maximum value Ys,max, and under these conditions:
By plotting the nth square root of the ratio Ys/(Ys,max – Ys), which is equivalent to v/(VA – v), as a function of s for a given concentration of the activator A, a line is obtained. The intersection of the line with the x-axis gives –KR. The intersection with the y-axis gives \({\rm \sqrt[n]{1}/L}\) By performing an experiment for several activator concentrations, plotting the determined value of \({\rm \sqrt[n]{1}/L}\)
as a function of A, and plotting a second curve, the values of KA and L0 are obtained (Fig. 13.4 below). The value of the ratio R/(1 – R) can be determined experimentally from the enzymatic reaction rate. Under the described conditions, the ratio is equal to v/(VA – v), where VA is the reaction rate observed when the enzyme is saturated by the activator.
Fig. 13.4
Determination of the dissociation constant of AMP for the R state of phosphorylase b, in the presence of different concentrations of phosphate
Rubin and Changeux (1966) expressed the apparent allosteric constant L′ as a function of the substrate concentration at the half-saturation point, α½, so that Ys = ½. The expression of L’ is therefore:
When c << 0, logα½ is a sigmoidal function of log L′.
The values of Ys and R have also been analysed by Rubin and Changeux in the case of non-exclusive binding and for widely varying parameters. The function R varies from (L′ + 1)–1 when α tends towards zero, to (L′cn + 1)–1, when α tends towards infinity. The authors define the “allosteric domain”, Q, by the difference in the two values of R:
Qmax tends towards 1 when c tends towards zero, that is, for an exclusive binding, on the condition that L >> 1 (equilibrium displaced towards the T form). Figure 13.5 shows the “allosteric zone” for non-exclusive ligand binding. The state function R is represented as a function of log L for the two extreme values of substrate concentration (α = 0 and α →∞. The “allosteric zone” is represented in Fig. 13.5 for a given value of L0. The distance between the two curves is indicated by a horizontal line which depends on the relative ligand affinity for the R and T states and on the number of protomers. The distance has the value logc–n, where n is the number of protomers. The curves are given for n = 2, c = 0.1 and L0 = 100. L′ varies with the different effectors.
Fig. 13.5
Allosteric transition zone upon non-exclusive ligand binding
In the preceding description, it has been considered that the T and R conformations differ in their intrinsic dissociation constants KT and KR in relation to the substrate but display the same catalytic constant, kcat,T = kcat,R. The model also allows for V systems where the two extreme conformations display the same affinity for the substrate (KR = KT), but differ in their catalytic constants (kcat,R > kcat,T). It follows that the substrate saturation curve of such an enzyme is a hyperbola and does not display any sign of cooperativity. The enzymes differ however from enzymes displaying Michaelian behaviour if the equilibrium between the two extreme conform-ations is displaced by allosteric effectors. In V systems, the activator has a higher affinity for the enzyme conformation which has the highest catalytic constant, by definition. On the contrary, the inhibitor has a preferential affinity for the form of the enzyme with the weakest catalytic constant. Therefore, in the presence of both the inhibitor and the activator, the substrate saturation curve stays a hyperbola, although the maximum rate varies with effector concentration (Fig. 13.6a). If the effectors act strictly on the T →R equilibrium and if, when saturated in inhibitor, the equilibrium is entirely displaced towards the T state, it becomes possible to determine kcat,T. The same is true for kcat,R in the presence of saturating concentrations of activator. From a phenomenological point of view, everything occurs as if it would be a Michaelian enzyme sensitive to the presence of an activator or a non-competitive inhibitor. However, if homotropic interactions are present between regulatory effector sites, differences from the Michaelis law are observed. For example, the variation of the maximal rate as a function of inhibitor concentration or allosteric activator has a sigmoidal shape (Fig. 13.6b).
Fig. 13.6
V systems
(a) variations in the rate as a function of substrate concentration, in the absence (middle curve) and in the presence of allosteric effectors: activator (top curve) and inhibitor (bottom curve) – (b) variations in the experimental catalytic constant as a function of allosteric inhibitor or activator concentration
Nothing prevents an enzyme from displaying mixed behaviours, and that its extreme conformations differ both in their substrate dissociation constant and in their catalytic constant. The two types of parameters are extremely sensitive to very discrete variations in the topology of the catalytic site and it is unlikely that a conformational change in the substrate binding site does not influence the catalytic constant.
It is to be noted that the concerted model does not explain anticooperativity since the ligand cannot displace the thermodynamic equilibrium R →T towards the form for which it has the lowest affinity.
5 Sequential Model [Koshland, Néméthy & Filmer, 1966]
5.1 Definition
The sequential model can explain anticooperative phenomena as well as cooperative ones. This model is based on the induced-fit theory developed previously by Koshland to explain the efficiency of enzymatic reactions based on the flexibility of protein structures (Chap. 10).
The induced-fit theory is based on three postulates:
the substrate binding to an enzyme provokes a reversible and discrete change in the conformation of the enzyme;
in order for enzymatic activity to occur, a suitable and very precise orientation of the enzyme catalytic groups in relation to those of the scissile bond of the substrate is necessary;
the substrate induces its own orientation in relation to the enzyme via the change it provokes in the conformation of the enzyme.
During the dynamic process, the substrate “teaches” the enzyme the conformation it must adopt. Koshland thought to apply the principles to oligomeric enzymes to explain differences in their behaviour compared to the Michaelis theory. Because of the basic premise, the Koshland model is sometimes described as an instructive mechanism in opposition to the selective mechanism at play in the concerted model (Citri, 1973).
The sequential model does not at all take into account the symmetry conservation and assumes the existence of hybrid conformations. It is based on the following postulates:
the protein exists in one form A only in the absence of a ligand;
the ligand binding to one subunit induces a conformational change of the subunit towards a conformation B;
the conformational change of the concerned subunit provokes variations in interactions between subunits;
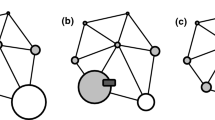
the ligand binds preferentially to one of the two conformations. The proposed mechanism confers a particular importance to interactions between subunits, and the formalisms that describe the mechanism depend on the geometry of the oligomeric molecule. If a tetramer is considered, the nature of the interactions depends on the spatial arrangement of the subunits. Koshland also considered and treated different models that had been proposed by Pauling in 1935 (Fig. 13.7 below);
all the sites are equivalent and independent in the absence of a ligand.
Fig. 13.7
Different geometries of a tetrameric molecule considered in the model of Koshland, Néméthy and Filmer
In the following formulas, A and B refer to the two conformations each subunit may adopt and the ligand preferentially binds to the B conformation with an affinity constant:
The equilibrium between the two conformations A and B is given by the ratio: Kt = [B]/[A]. The constant does not include the effect of the variation of interactions between subunits. The interaction variation is taken into account using the constants KAA, KAB and KBB such that:
In the above equations [AB] indicates the interacting subunits, and [A] and [B] are non-interacting subunits. To simplify the calculations, it is supposed that KAA = 1.
If, in the preceding model, the deviation from the Michaelis law is expressed by a conformational equilibrium linked to binding equilibria, in the present model it is expressed in terms of the variation in the interaction between protomers as the sites progressively become occupied.
If KAA < KBA < KBB, that is to say, if the interaction between protomers becomes stronger as the sites become occupied, cooperativity is observed. If, on the contrary, KAA > KAB > KBB, anticooperativity is observed for the substrate binding. The cooperative and anticooperative effects depend on the relative value of the constants KAA, KAB, and KBB. They also depend however on the geometry of the molecule, since the number of interactions is a function of the geometry. To prove the preceding, the saturation function for the tetrahedric and square models will be considered.
where Ns represents the average number of substrate molecules bound to an enzyme molecule and n is the number of subunits.
5.2 Tetrahedral Tetramer Model
In the case of a tetrahedral tetramer, the number of interactions is 3AB in the species A3BS, 1BB, 4AB and 1 AA in the species A2B2S2, 3BB and 3AB in the species AB3S3 and 6BB in the species B4S4. The corresponding concentrations of enzyme molecules which have bound a given number of substrate molecules are given by the following expressions:
The expression differs to that corresponding to a tetrahedral model, which illustrates the importance of the geometry of the molecule in enzymatic behaviour.
In the square model, the protein’s saturation and state functions are the same since the conformational change of each protomer is induced by the substrate binding during saturation. These two functions have four parameters, Ks, Kt, KAB and KBB, since KAA is taken as a reference. The model has one extra parameter compared to the model of Monod, Wyman and Changeux.
Figure 13.8 opposite shows the variation of the saturation curves as a function of the molecule’s geometry; all the other parameters are kept constant. Figure 13.9 opposite on the following page represents the variations of the saturation function for different parameter values. A few examples of saturation curves for the square model show the role of variations in KAB and KBB (Fig. 13.10 below). The product KsKt is arbitrarily set to 100 for all the curves. The curves which correspond to the same KAB value have the same asymptote for small log[s] values; the curves which correspond to the same value of KBB intersect at NS = 2. The curves which have a constant KBB/KAB ratio are asymptotic at high log[s] values.
Fig. 13.8
Substrate saturation curves for different geometries of a tetrameric enzyme
Anticooperativity consists in the fact that, in opposition to what has been described previously, the binding of the first ligand molecules to an oligomeric protein decreases the apparent affinity for the other ligand sites. It can be understood in terms of a conformational change in a subunit on binding the first ligand molecule that induces a modification in a neighbouring subunit which reduces its ligand affinity. The sequential model described previously for cooperative effects can take into account anticooperative phenomena perfectly well. As has been highlighted previously, anticooperativity arises when KAA > KAB > KBB.
The substrate saturation curve of an enzyme which displays anticooperative phenomena cannot be linearised. Figure 13.1b and c show the general shape of curves obtained in the case of anticooperativity using the Lineweaver-Burk and Eadie-Hofstee plots. In practice, it is very difficult to distinguish between anticooperativity and heterogeneity of the binding sites. In the first case, in the absence of a ligand, all the binding sites display the same affinity, and it is the conformational change induced by the binding of the first ligand molecules which confers a lower apparent affinity to the non-occupied sites, or even a practically non-existent affinity. In the second case, several site categories exist with different substrate affinities (see Chap. 2), which exist prior to ligand binding.
In certain cases, the anticooperative phenomenon is extreme; the binding of the first ligand molecules induces a structural modification of the protein which confers a practically infinite dissociation constant to the residual sites. The phenomenon is referred to as half-site reactivity. Amongst the enzymes which display anticooper-ative phenomena, glyceraldehyde-3-phosphate dehydrogenase has been particularly well studied (Henis & Levitzki, 1980). A particular aspect of half-site reactivity has been described by Lazdunski et al. (1971): a flip-flop mechanism, where each protomer of the dimeric enzyme is alternately phosphorylated by the substrate, while the other protomer is de-phosphorylated, is used to explain the behaviour of E. coli alkaline phosphatase.
6 The Generalised Model
A generalised model was proposed to explain both cooperative and anticooperative effects. In 1965, Weber proposed an extension of the Adair model, taking into account the conformational mobility of the protein. Weber assumed that in the absence of any ligand, the protein can exist in m conformations, each form having n sites which can bind either a substrate, S, or an effector. The diagram below can take into account the different equilibria:
The model is described by a general equation of the same type as the equation of Adair in which the dissociation constants have a complex significance, contain-ing a term corresponding to the dissociation constant between the substrate and its receptor site and a transformation constant of the protomer in the oligomer. The different equilibria in the vertical and horizontal directions are linked. Figure 13.11 below illustrates the model in the case of a tetramer. It is interesting to note that each of the models described previously represents a special case of the generalised model. If only the two outside vertical columns are considered in Fig. 13.11, the model of Monod, Wyman and Changeux is described. The diagonal of the diagram represents the Koshland, Néméthy and Filmer model. If the interaction energy between protomers in the oligomer is larger than the protein-ligand association energy, the system is described by the concerted model. On the contrary, if the protein-ligand interaction energy is larger than the interaction between proto-mers, the system is well described by the sequential model. It is the relative inter-action energies which control the enzymatic system.
7 Thermodynamical Coupling between Ligand Binding Energy and Subunit Interaction Energy
The notion of thermodynamical coupling between ligand binding energy and the subunit interaction energy is implicit in the models described in the preceding sections. It is also included in the thermodynamical considerations of Wyman (1964) on the importance of binding potentials. The concept of coupling, stated by Noble (1967), was extensively developed by Weber, who conceived a protein behaviour analysis method for proteins displaying cooperative effects, in terms of variations in free energy, associated with both ligand binding and interactions between protein subunits.
Let us consider the extreme case of a monomer-dimer equilibrium. If the substrate S has a higher affinity for the dimeric form D than for the monomeric form M, it will shift the equilibrium towards the dimer. Every physico-chemical parameter which favours the dissociation will however disfavour the binding of S. The described situation is characterised by the following cycle:
From a thermodynamical point of view, the different values of ΔG correspond to the variations in free energy, which accompany each reaction. The variation in free energy to go from one state to another is independent of the chosen path, so the sum of the variations around the cycle is zero, and:
The above means that, to every difference in ligand affinity for the protein’s two states, corresponds an equal difference in the subunit interaction energy of the free and ligand associated forms. It is then possible to describe the progressive ligand binding to the protein along the thermodynamical diagram presented in Fig. 13.12.
Fig. 13.12
Thermodynamical coupling between dimerisation and substrate binding
ΔG0 represents the variation in free energy of the monomer-dimer equilibrium in the absence of the ligand, ΔG′(11) the free energy of ligand binding to the monomer, ΔG(21) and ΔG(22), the free energy variation on binding the first and second ligand molecules to the dimer, respectively. If ΔG(22) > ΔG(21), the binding is cooperative; if in addition, |ΔG0| > |ΔG1|, the dissociation is favoured despite the cooperativity of ligand binding to the dimer. In these conditions and depending on the relative values of ΔG0, ΔG1 and ΔG2, Weber defines a first order system as one in which it is the binding of the first S molecule which provokes the subunit interaction energy change. In a so-called second order system it is the binding of the second S mol-ecule which induces the effect. The intermediate order corresponds to the case where the binding of both ligand molecules contributes. Depending on the values of ΔG, the binding of S will be cooperative, anticooperative or Michaelian, and the binding will favour or disfavour dimer formation.
The same reasoning applies to the case where the ligand binding is not linked to the complete dissociation of the protein, but only to a variation in subunit interaction energy, which is the most general case where proteins binding their ligand in a cooperative manner are concerned. Considering the different possible cases, Weber (1972) established the following rules:
in a first order system, the ligand binding decreases the subunit interaction if the binding of S is cooperative, and increases the interaction if the binding is anticooperative;
in a second order system, the ligand binding increases the subunit interaction if the binding of S is cooperative, and decreases it if the binding is anticooperative.
8 Kinetic Cooperativity: Ricard Model
The models described above, with the exception of V systems, involve variations in the affinity of the catalytic sites for substrates and consider dissociation constants only in relation to the substrates, at equilibrium. The descriptions at thermodynam-ical equilibrium are insufficient to explain what happens in the case of enzymes where the equilibria are immediately broken by the reaction and the appearance of the products. Both Whitehead (1970) and Ricard (1989) developed new formalisms destined to explain in a more complete manner the cooperative phenomena displayed by the enzymes.
Ricard’s approach attempts to describe the way in which variation of subunits interactions can change the catalytic constant. In the authors own words “what is import-ant is not to understand how the interactions between subunits and conformational constraints modulate substrate binding, but in a more integrated way, to understand how the interactions and constraints control the rate of product apparition in the stationary phase”.
The rate constant of a reaction is related to its activation energy by the relation:
in which kB is the Boltzmann constant, h Planck’s constant, R the gas constant and T the absolute temperature.
The basic idea of Ricard’s model is that the interactions between subunits can have two types of effect on the rate of the catalysed reaction:
the interactions can change the rate of conformational transitions involved in the reaction. The corresponding contribution to the free activation energy is called the protomer arrangement contribution, \({\rm \Delta sum {\left( {^{\rm{\alpha }} \Delta {\rm{G}}_{{\rm{int}}} } \right)}}\);
the interactions between subunits can induce a distortion of the catalytic site. The corresponding energetic contribution is called the quaternary constraint contribution, \({\rm \Delta sum {\left( {^\sigma \Delta {\rm{G}}_{{\rm{int}}} } \right)}}\).
As a consequence, the global activation energy, ΔG≠, of the catalysed reaction is equal to:
where ΔG≠*, called the intrinsic energy contribution, corresponds to what the free energy of the reaction would be if the subunits were free from all interactions. As a consequence, the expression of the rate constant is:
The theories developed on the basis of this formulation lie on three postulates:
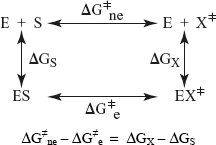
The theories of enzyme catalysis suggest that the intramolecular constraints are abolished in the transition state. The idea is applied to oligomeric enzymes and the model supposes that the quaternary constraints are suppressed on formation of the transition state. Suppose the following reaction, catalysed or not by an enzyme:
catalysed by the enzyme not catalysed by the enzyme
The rate constants ke and kne are compared in the following thermodynamic cycle, which takes into account the formation of a transition state X:
Since ΔG≠ne is much larger than ΔG≠e, it follows that ΔG≠X >> ΔGS. The enzyme displays a much larger affinity for the transition state than for the fundamental state of the substrate and in the enzyme-transition state complex the quaternary constraints must be abolished.
In the absence of quaternary constraints, the subunits may adopt a limited number of conformations. If two conformations A and B are present, substrates and products stabilise the same conformation (for instance B).
The subunit that has bound the transition state is in the A conformation which is identical to that of the free subunit.
Several important conclusions on the analysis of oligomeric enzyme behaviour follow from the development of the above formalisms:
a weak interaction between subunits can imply a kinetic cooperativity phenom-enon, although the substrate saturation curve is not a sigmoid;
if the subunit interaction energy is strong, several cases can be distinguished:
either the substrate binding cooperativity is positive and the kinetic cooperativity must be positive,
or the substrate binding cooperativity is negative and the catalytic cooperativity can be negative or positive.
Thus, even in the case of a strong interaction between subunits, a strong catalytic cooperativity can generate a substrate saturation curve which does not have a sigmoidal shape.
9 Cooperativity and Allostery
The original and strict definition of allostery is that a metabolite whose structure is different to that of the substrate, on binding to a site, which is not the substrate binding site, induces an alteration of the active centre’s properties, in terms of substrate affinity and/or catalytic efficiency (Monod et al., 1963).
From an epistemological point of view, it is interesting that to explain such a well defined phenomenon, formalisms destined to account for a different phenomenon, that is, cooperativity between catalytic sites, were used. An explanation can be found in the fact that the first regulatory enzymes to be studied at this period (threonine deaminase for example) displayed both phenomena, which were sought to be explained by a unique model.
The information gathered over the past years on the regulatory mechanisms of different enzymes, and in particular aspartate transcarbamylase, have lead to a revision of this view. Indeed, it emerges that, in aspartate transcarbamylase, cooperative effects between catalytic sites, and allosteric effects between regulatory and catalytic sites, operate by different mechanisms which are however coupled. The same may apply to other regulation enzymes. In addition to this, certain enzymes only show one or the other of these phenomena; certain dehydrogenases such as the glyceraldehyde 3-phosphate dehydrogenase show cooperativity between catalytic sites without being sensitive to physiological effectors. (Henis & Levitzki, 1980). Others, on the contrary, only show sensitivity to allosteric effector, without showing cooperativity between catalytic sites. This is the case, for example, of aspartate transcarbamylase from certain bacteria and the yeast Saccharomyces cerevisiae (Bethell & Jones, 1969; Penverne & Hervé, 1983). It is also the case of ribonucleotide reductases, some of which have a monomeric structure (Erikson & Sjöberg, 1989).
In the present state of our knowledge, and in an attempt to clarify the discussion of these phenomena, it is practical to discuss cooperativity on the one hand, and allostery on the other, even if it turns out that in some cases the two types of phenomena are explained by the same mechanisms (Thiry & Hervé, 1978).
We shall now consider a few examples of allosteric enzymes.
10 Examples of Allosteric Enzymes
At present, numerous allosteric enzymes have been studied, and for several of them, structures have been determined by X-ray crystallography. For some enzymes (aspartate transcarbamylase, glycogen phosphorylase, phosphofructokinase), the crystallographic studies have resolved the protein structure in several states, which are involved in the mechanisms of regulation. In this context, the idea emerges that,
to a certain extent, each of these systems possesses its own logic, its own mechanisms. Some of the mechanisms are similar, some are not. Some are in agreement with the theoretical models that have been proposed, some are not. It therefore appears that, in the field of metabolic regulation, as in other fields of biology, nature has used several solutions to face the same demands of survival.
10.1 Glycogen PhosphorylaseM
Glycogen phosphorylase b catalyses the first step of intracellular degradation of glycogen:
10.1.1 Allosteric Regulation
The enzyme is subjected to allosteric regulation and to a reversible phosphorylation. The regulation process can be explained in terms of several conformational states, from the T state, which shows a weak substrate affinity, to the R state, which shows a strong affinity. The quaternary constraints and the tertiary structure are modulated by the ligand binding.
Phosphorylase a is the phosphorylated form, phosphorylase b, the dephosphorylated one. Physiological activation induces the conversion of inactive phosphorylase b to phosphorylase a, by phosphorylation of the catalytic serine 14 by a kinase, under the influence of hormonal and neuronal action. The phosphorylase b can also be activated by AMP, IMP and strong concentrations of phosphate. Its affinity for phosphate is increased 15-fold in the presence of AMP. It is inhibited by glucose-6-phosphate, glucose, ATP and ADP. The activation by AMP as well as the phosphorylation bring about a change in the oligomeric state of the enzyme; it becomes tetrameric. The tetrameric enzyme possesses only 12 to 33% of its phosphorylase activity, but it can be dissociated by glycogen or oligosaccharides into dimers which are completely active. Figure 13.13 below is a schematic representation of the activation of glycogen phosphorylase.
Fig. 13.13
Schematic representation of the allosteric and covalent activation of glycogen phosphorylase
Phosphorylase a is less sensitive to effectors than phosphorylase b. Phosphorylase a does not show cooperativity for glycogen or phosphate binding (Fig. 13.14 below).
However, in the case of phosphorylase b, a strong cooperativity is observed for glucose-1-phosphate binding, which is the enzyme’s substrate in the reverse reaction (Fig. 13.15 below).
Fig. 13.15
Variation of phosphorylase b activity as a function of the concentration of glucose-1-phosphate
(a) for different concentrations of IMP: 4.16 mM (●), 1.66 mM (○), 0.83 mM (▲), 0.33 mM (■), 0.0833 mM (□) – (b) for different concentrations of AMP: 2.08 mM (●), 0.208 mM (○), 0.104 mM (■), 0.052 mM (□). Inset, Hill’s plot
Figure 13.17 below shows the subunit in the T state with its different domains and ligand binding sites that have been identified. The organisation of the secondary structure is the same for the R and T states. The protein is of the α/β type and possesses two structural domains, the N-terminal domain comprising amino acids 1 to 484, and the C-terminal domain the amino acids 485 to 842. The pyridoxal phosphate binding site, the catalytic site C, the AMP binding site N, which is 30 Å away from the catalytic site, the glycogen reserve site G, and the allosteric contact zone with the other subunit are shown in the figure. When the two glycogen phosphorylase dimers associate to form the tetramer, the interface formed by the association contains residues of the catalytic face of the subunit, and access to the catalytic site is hindered. The situation is at the origin of the weak activity of the tetramer in the T state. Another contact zone contains the residues of the glycogen reserve region, in particular a key residue of the site, the residue Glu 433, which forms a hydrogen bond with the interface: this explains why glycogen induces dissociation of the tetramer into dimers.
Fig. 13.17
3-dimensional structure of a subunit of glycogen phosphorylase b in the T state, seen along the crystallographic axis
The transition of the T to the R state is accompanied by small changes in the tert-iary structure that are mainly localised in the ligand binding sites and at the interface between subunits, in particular helix α7 (“tower” helix). The regions of the molecule that undergo the largest displacements are the zones which are important, either for the allosteric response, or for the tetramer formation. The variations in the tertiary structure are coupled to large changes in the quaternary structure; a rotation of 10° between subunits occurs. In the T state, the interface is formed by an anti-parallel association of the two “tower” helices. During the transition towards the R state, the arrangement of the two helices is greatly modified, their axes form an angle of –80°. The loop located above the helix also undergoes an important change. The change in quaternary structure directly affects the N site and the phosphorylation site, and transmits a signal to the catalytic site and to the inhibitor site I, via the conformational change of the two “tower” helices.
Glycogen phosphorylase represents one of the first enzymes whose catalytic prop-erties have been described by the concerted model of Monod, Wyman and Changeux (Buc, 1967). The structural data appear to agree with the model (Johnson, 1992). However, to explain certain experimental results, several authors have been led to complicate the model. To explain the activation by small concentrations of AMP, a three state model has been proposed. Four state models have been suggested to describe the heterotropic interactions between AMP and glucose-1-P, and AMP and glucose-6-P. In glycogen phosphorylase, the situation is complicated, on the one hand by the existence of the dimeric and tetrameric forms, and on the other hand by the existence of phosphorylated forms. The crystal structures of the two R states of glycogen phosphorylase a and b are identical however. The same is true for the different T states of Fig. 13.16. The crystallographic data do not allow the interpretation of the regulatory properties of the enzyme with more than two states.
10.2 Phosphofructokinase
Phosphofructokinase is an enzyme of the glycolytic pathway, which catalyses the transfer of the γ-phosphate of ATP to the C1 hydroxyl of fructose-6-phosphate (Fruc-6-P), to give fructose-1,6-diphosphate (Fruc-1,6-P2), following the reaction:
in the presence of Mg++. The reaction is strongly exergonic and practically irreversible.
The enzyme is very specific to the hexose phosphate, but accepts a wide variety of triphosphate nucleosides as phosphate donors. In vivo, phosphofructokinase is subjected to multiple regulations that confer a key role to the enzyme in the control of glycolysis according to the energetic requirements of the cell. A number of allosteric effectors, inhibitors or activators of phosphofructokinase exist, which differ in dif-ferent organisms (Fig. 13.18).
Fig. 13.18
Allosteric regulation of phosphofructokinase, a key enzyme of glycolysis, in different organisms: 1, mammals; 2, yeast; 3, E. coli
Phosphofructokinase has a large variety of structures in prokaryotic and eukaryotic organisms. In prokaryotes, such as E. coli and B. stearothermophilus, the enzyme is a tetramer, formed of identical protomers. The enzyme is generally tetrameric in mammals, but is subject to association-dissociation equilibria that vary according to tissues. The yeast enzyme is octameric, formed of four α and four β subunits. These subunits have been isolated and identified (Laurent & Yon, 1989) and their structural and functional properties found to be different. The experimental results showed that the β subunits, which bind fructose-6-phosphate, are the catalytic subunits, and that the α subunits bear the regulator sites.
The three dimensional structures of the enzymes from E. coli and B. stearothermophilus were determined by X-ray crystallography by the Evans group in Cambridge (Evans, 1992). Figure 13.19 opposite shows the structure of the B. stearothermophilus enzyme. The enzyme is made up of four identical protomers of molecular weight 33 900 containing 316 amino acids. The protomers of the oligomer are associated by three orthogonal 2-fold symmetry axes. The centre of the tetramer has a 7 Å diameter cavity filled with water molecules (the cylinder in Fig. 13.19a). Each subunit is in tight contact with only two neighbouring subunits. The cavity separates the pairs of subunits that do not interact. The enzyme belongs to the α/β class of proteins. Each protomer is structured into two domains of approximately equal sizes.
Fig. 13.19
Three-dimensional structure of phosphofructokinase from B. stearothermophilus
The binding sites of substrates and effectors have been determined (Fig. 13.19b). Fructose-6-phosphate is in interaction with residues of two different subunits, His249 of one, and Arg159 and Arg240 of the other. The ATP binding site is between domains 1 and 2, and that of the allosteric effectors is different. The inter-actions of ADP, an allosteric activator of the enzyme, involve residues of both subunits. The β-phosphate interacts with Arg151 of one subunit and Arg21 and Arg25 of the other. The ribose forms interactions with His212 and Thr155. The phosphate group of phosphoenolpyruvate seems to bind to the same site as the β-phosphate of ADP.
The structures of two conformations of the enzyme were resolved, one in the presence of the reaction products, the other in the presence of an inhibitor, analogue of phosphoenolpyruvate (Sharakihava & Evans, 1988). At this time, it was supposed that these structures corresponded to the R and T conformations, respectively. The main difference between the two forms resides in the rotation by 7° of the AB dimer in relation to the CD dimer (Fig. 13.19a). The movement is coupled to the change in fructose-6-phosphate binding sites. The most important change in tertiary structure concerns the position of the two helices 8 and 9 and the rearrangement of loop 6F. The rearrangement of this loop couples the fructose-6-phosphate and allosteric effector binding to the change in quaternary structure of the molecule. The symmetry is conserved during the transition, which suggests that it is concerted.
10.2.2 Phosphofructokinase Allosteric Regulation
Phosphofructokinases from prokaryotes, in particular those of E. coli and B. stearothermophilus, which have been well-studied, show kinetic cooperativity for the substrate fructose-6-phosphate, but not for ATP. There is however a difference between the enzymes from E. coli and B. stearothermophilus: the latter only displays a cooperative phenomenon for fructose-6-phosphate in the presence of phosphoenol-pyruvate. The enzymes are under allosteric control, being activated by ADP and other diphosphonucleosides, and inhibited by phosphoenolpyruvate. Contrary to the eukaryotic enzymes (see below), they are not inhibited by ATP or citrate, and not activated by AMP. The E. coli enzyme was one of the first allosteric enzymes to which the concerted model was applied Blangy et al., 1968. As an illustration, Fig. 13.20 shows the cooperative kinetics as a function of fructose-6-phosphate concentration for different ADP concentrations. Figure 13.21 opposite shows the enzyme’s Michaelian behaviour in relation to ATP.
Fig. 13.20
Kinetic cooperativity of the reaction catalysed by E. coli phosphofructokinase as a function of fructose-6-phosphate, in absence and presence of ADP at different concentrations,
For many years, the enzyme was considered a perfect example of an enzyme obeying the concerted model of Monod et al. (1965). More recently, two unexpected observations have led to this interpretation being fundamentally revised:
the determination of the enzyme’s crystallographic structure in the absence of substrate showed that the structure was identical to that obtained in the presence of substrate, showing that the substrate itself is incapable of provoking the supposed transition between the T and R states (Rypniewski & Evans, 1989);
the direct measurement of substrate binding by fluorescence showed that the binding occurs in a Michaelian fashion without cooperativity (Auzat et al., 1995).
It is now known that it is the allosteric effector binding that brings about the quat-ernary structure transition. Cooperativity for fructose-6-phosphate is of catalytic nature. It seems that the cooperativity results in a change in the limiting step of the reaction when the concentration of fructose-6-phosphate increases (Auzat et al., 1995).
Various site-directed mutagenesis experiments have been performed with the E. coli enzyme. The experiments showed that aspartate 127 plays a key role in catalysis. Mutating it to a serine reduces the kcat value 18 000 times. The mutants obtained by replacing threonine 156 by a serine or a glycine, and serine 159 by an asparagine, display Michaelian kinetics and are blocked in the T state. In addition, the T156S or T156G mutants show a hyperbolic response to activation by phosphoenolpyruvate. The main results of the site-directed mutagenesis experiments indicate that the region between residues 156–160 is critical in the transmission of interactions between effector and catalytic sites. In addition, it has been shown that the removal of the C-terminal extremity by subtilisin suppresses the allosteric effects (Leebras & Garel, 1985).
Phosphofructokinases from eukaryotic organisms display different behaviour with respect to allosteric effectors. Contrary to the E. coli enzyme, the yeast enzyme has effectors, which are products from reactions that are very close in the metabolic pathway. It is not affected by phosphoenolpyruvate. ADP is only a very weak activator. AMP and ATP are very strong effectors however, AMP is an activator and ATP both substrate and inhibitor. The enzyme’s ATP saturation curves are biphasic, showing that two types of site exist: strong affinity sites that correspond to ATP behaving as an allosteric inhibitor (Kd = 3 µM) and weak affinity sites (Kd = 36 µM), corresponding to ATP substrate binding sites (Fig. 13.22). The 5’AMP activator binding involves only one type of site. The fructose 2,6-biphosphate is also an activator of yeast phosphofructokinase. The enzyme’s substrate saturation function is cooperative for fructose-6-phosphate but stays Michaelian for ATP, as is the case for enzymes from prokaryotic organisms.
Fig. 13.22
Binding isotherms of 5’AMP (a) and of ATP (b) to yeast phosphofructokinase determined by flow dialysis experiments
The behaviour of yeast phosphofructokinase cannot be described by the simple two state concerted model however. In fact, inhibition by ATP induces a progressive displacement of the saturation curves by fructose-6-phosphate. For this enzyme, a decoupling between homotropic and heterotropic effects has been observed. ATP binding induces a new conformation of the enzyme T’ , and the T’ transition rate is higher than that of the T→R transition. In the same way, the binding of the activator AMP brings about a R→’ transition. To explain all of the experimental data, a model has been proposed:
In this model, the horizontal transitions corresponding to the binding of fructose-6-phosphate are concerted, with a constant L0 of the order of 3 to 6. The vertical transitions corresponding to heterotropic effects (ATP or AMP binding to the regulatory sites) obey the sequential model and the transition is proportional to the ligand binding. This model in which the four catalytic and four distinct regulator sites are involved explains both the conformational and functional properties of yeast phosphofructokinase. It has also been shown that in this case, it is the allosteric effector binding and not that of the substrates, which brings about a transition in quaternary structure. This shows that the concerted model and the sequential model are too simple to describe the behaviour of the yeast enzyme.
10.3 E. Coli Aspartate Transcarbamylase
Aspartate transcarbamylase (ATCase) catalyses the first specific reaction of the pyrimidine nucleotide biosynthesis pathway, i.e., the carbamylation of the aspartate amino group by the carbamyl phosphate, as is shown below:
In E. coli, the reaction proceeds following an ordered mechanism whereby the carbamyl phosphate binds first, followed by aspartate, and the reaction products are released in the order: carbamyl aspartate, then phosphate (Porter et al., 1969; Hsuanyu & Wedler, 1987). The ATCase of E. coli is extensively studied as a model system for the understanding of cooperativity and allostery mechanisms (Allewell, 1989; Hervé, 1989; Lipscomb, 1992). The enzyme shows the different types of interactions that enzymes regulated by non-covalent modification display: cooperative effects between catalytic sites, positive and negative heterotropic interactions between regulatory and catalytic sites, as well as cooperative and anti-cooperative effects between catalytic sites.
The ATCase structure shows several levels of organisation. The enzyme is constituted by the association of two trimers of catalytic chains (catalytic subunits of molecular mass 102 kDa), maintained in contact by their association with three dimers of regulatory chains (regulatory subunits of molecular mass 34 kDa). ATCase contains therefore six chains of each type (Fig. 13.23). The catalytic sites are located at the interface between two catalytic chains belonging to the same trimer, and the regulatory sites are located near the interface between the two regulatory chains.
Fig. 13.23
Schematic representation of the quaternary structure of ATCase
The crystallographic structures of several ATCase conformations are known with a 2.5 Å resolution thanks to the work carried out in Lipscomb’s laboratory. Figure 13.24 opposite shows the structure of a catalytic chain together with a regulatory chain (R1C1 in the Fig. 13.23). Each of the chains is made up of two structural domains: the carbamyl phosphate and the aspartate binding domains in the case of the catalytic chains, the zinc and allosteric domains in the case of the regulatory chains. Each of the latter contain a zinc atom bound to the sulphur atoms of the four cysteine residues found in the C-terminal region of the chains. The reaction of some mercurial agents with the cysteine residues allows the dissociation of ATCase into catalytic and regulatory subunits. The isolated catalytic subunits conserve their capacity to catalyse the carbamylation of aspartate amino group but show no regulatory properties. The regulatory subunits possess no catalytic activity, but conserve their capacity to bind regulatory nucleotides.
Fig. 13.24
Schematic representation of the structure of a catalytic subunit together with a regulatory subunit
10.3.1 Cooperative Effects between Catalytic Sites
ATCase displays cooperative effects between the catalytic sites for aspartate binding. The enzyme saturation curve for aspartate is sigmoidal in the presence of satur-ating carbamyl phosphate. Succinate, a competitive analogue of aspartate, displays the same phenomenon on binding under the same conditions. The existence of these cooperative effects is explained by the transition of ATCase from one conformation, which displays a weak affinity for aspartate (T state), to a conformation that has a strong affinity for this substrate (R state). The crystallographic structures of the two extreme conformations (Fig. 13.25) are known at 2.5 Å resolution (Honzatko et al., 1987; KE et al., 1988). The transition from one conform-ation to the other involves three aspects that are coupled: a quaternary structure transition, a tertiary structure transition and a catalytic site conformational transition.
Fig. 13.25
ATCase structure, in the T state (a) and in the R state (b)(PDB: 1RAB and 8ATC)
During the change from the T state to the R state (Fig. 13.25 below), the two catalytic subunits move apart by 11 Å along the 3-fold symmetry axis of the molecule, that is, by a tenth of the diameter of the molecule. This movement is associated with their rotation by 5° in opposite directions around the same axis, and with a reorientation of the regulatory dimers. A variation in the relative position of the polypeptide loops belonging to the catalytic chains (in particular the loop containing the residue 240) also characterises the motion. The variation in quaternary structure brings about an alteration in the interfaces between subunits. In this way, during the transition, the C1C4 and R1C4 type interfaces are broken.
The rearrangement is characterised, in particular, by the breaking of a certain number of ionic interactions, both between catalytic chains, and between catalytic and regulatory chains (Fig. 13.26). The interactions are replaced by new ionic intra-chain interactions which, in some cases, involve the same amino acid side-chains.
Fig. 13.26
Change in the subunit interactions that occurs during the allosteric transition of aspartate transcarbamylase
A tertiary structure transition of the catalytic chains is associated with the quatern-ary structure transition. In particular, the transition in tertiary structure concerns two loop regions located in one and the other of the two catalytic chain domains (Fig. 13.27). This variation in tertiary structure results in the two domains of the catalytic chains coming closer together, and in this way tighten more closely to the substrate molecules bound to the catalytic site (Fig. 13.28).
Fig. 13.27
Tertiary structure transition
Red: R state; blue: T state. PALA indicates the position of the catalytic site
The change in tertiary structure of the catalytic chains therefore implies a modifi-cation of the catalytic site, a modification that tends to bring the amino acid side-chains that interact with the substrate molecules closer together. The catalytic site rearrangement includes a variation in the pKa of the group(s) involved in aspartate binding and/or in catalysis (Fig. 13.28). In fact, in ATCase, the pH dependence of the catalysed reaction varies considerably during the change from the T to R states. A shift of the activity optimum by one unit of pH is evidence of the important variation. The pH profile of the reaction in the R state is identical to that observed for the isolated catalytic subunits, in which it is insensitive to the substrate concentration. This insensitivity has made it possible to analyse the pH profile. The variation in the enzymatic activity as a function of pH is a result of the protonation-deprotonation of three groups (Fig. 13.29). The binding of the first substrate, carbamyl phosphate, shifts the pKa of a group from 8.2 to 7. The binding of the second substrate, aspartate, involves a group of the protein whose pKa is shifted from 7.2 to 9.4 in the complex. Finally, the catalytic act involves a group whose pKa is 7.2. Site-directed mutagenesis has been used to identify the groups corresponding to the different pKa, in particular the group whose pKa is shifted during the T to R transition. The technique has allowed histidine 134 to be identified as the residue whose deprotonation increases the affinity of the enzyme for the carbamyl phosphate (Xi et al., 1990).
Fig. 13.29
pK variations of the active centre groups in the different steps of the reaction
Although the extreme conformations, R and T, involved in the cooperative homotropic effects between catalytic sites are now relatively well-known, it is not the case for the mechanism by which the enzyme passes from one state to the other. On the basis of currently available data, it seems that the transition involved is both concerted and induced. It is concerted in the sense that the complete displacement towards the R state is observed before the saturation of catalytic sites by aspartate or its analogues (Griffin et al., 1973; Fetler et al., 1995). This transition is induced in the sense that it appears not to be the result of a simple pre-existing thermodynamical equilibrium, which would be displaced by the exclusive or preferential substrate or analogue binding to the R state. The structure of the substrate or its analogues appears to bring information, and the process therefore probably involves an induced fit (Baillon et al., 1985; Foote et al., 1985; Foote & Lipscomb, 1981).
10.3.2 Allostery – Heterotropic Interactions between Regulatory and Catalytic Sites
The activity of ATCase is retro-inhibited in a synergistic manner by the final metab-olites CTP and UTP (Wild et al., 1989). On the contrary, the activity is increased by ATP. The resulting antagonism tends, in the cell, to equilibrate the biosynthesis of the pyrimidine and purine nucleotides. The first models that attempted to explain ATCase’s regulatory properties supposed that CTP and ATP acted directly on the transition implicated in the homotropic effects between catalytic sites described above. Over the years, experimental evidence was accumulated that showed that the nucleotides work based on different mechanisms.
10.3.2.1 “Primary-Secondary Effects” Mechanism
The totality of the obtained results concerning the action of CTP and ATP effectors has driven to the conclusion that these effectors do not act directly on the T ↔R transition, but alter, through localised conformational changes, the catalytic sites’ affinity for aspartate (primary effect). In the presence of a given aspartate concentration, the affinity change modifies the substrate occupation of the catalytic sites, which displaces the T ↔R equilibrium (secondary effect). In this way, the effect on the equilibrium is mediated by the substrate and not directly by the nucleotide (Thiry & Hervé, 1978; Tauc et al., 1982). The mechanism is presented in a schematic way in Fig. 13.30 opposite. The most simple formalism capable of describing the process associates the equation of the Monod, Wyman and Changeux concerted model to the formalism that describes the partial competitive inhibition, the type of inhibition whereby the inhibitor binds to a site distinct from the catalytic site (see Chap. 5).
Fig. 13.30
Heterotropic effects in ATCase: the “primary-secondary effects” mechanism The activity optima pHs are shown for the different conformations. nH is Hill’s number for each of the transitions
It has been possible to verify the predictions that follow on from this model, by using small angle X-ray scattering experiments (Hervé et al., 1985). In addition, isotope exchange experiments at equilibrium have allowed the verification that the CTP and ATP effectors do not directly affect the equilibrium T →R (Hsuanyu & Wedler, 1988), but affect the aspartate binding rate constant to the catalytic site.
The fact that the nucleotides do not act only directly on the transition involved in the homotropic cooperative effects between catalytic sites, associated to the fact that in ATCase the transition is induced, has lead to the proposition of a modified version of the mechanism, called “effector modulated quaternary transition” (Xi et al., 1991). In this mechanism, the local conformational change provoked by the nucleotide binding does not in itself induce any change in the affinity of the catalytic site for aspartate. On the contrary, through the modification of the interfaces between catalytic and regulatory chains, whose interaction energy is modified, the nucleotide facilitates (ATP) or on the contrary disfavours (CTP) the quaternary structure transition induced by the substrate. In other words, and for example in the presence of ATP bound to the regulatory sites, it would suffice to bind a lesser number of aspartate molecules to the catalytic sites to provoke the complete transition to the R conformation. The inverse phenomenon would occur in the presence of CTP. In fact, the determination of the crystallographic structures of the R and T states, which have CTP and ATP bound (Stevens et al., 1990; Gouaux et al., 1990), as well as the results of site-directed mutagenesis experiments and the use of pseudo-substrates, suggest that the two mechanisms described operate simultaneously. On the basis of the crystallographic data, it was proposed by Stevens and Lipscomb (1992) that the nucleotide binding to the regulatory sites would induce the transmission of a direct and an indirect signal.
10.3.2.2 Synergistic Action of CTP and UTP
It has been shown that the two final metabolites, CTP and UTP, decrease the aspartate binding to the catalytic sites in a synergistic manner. UTP alone does not have an effect, even though it binds to the regulatory sites. CTP has a limited effect. In the presence of the two nucleotides, ATCase is completely inhibited (Wildet al., 1989). The synergy phenomenon manifests itself entirely in the nucleotide binding to the two regulatory sites of the regulatory dimers (Fig. 13.31 below). UTP and CTP bind in a competitive manner to the same regulatory sites. CTP binding to the first site decreases the affinity of the second site for CTP, but increases its affinity for UTP and conversely (England & Hervé, 1992). The phenomenon is identical if the regulatory subunits (dimers of regulatory chains) are associated or not to the catalytic subunits, showing that in this process there is no interaction between the regulatory subunits in the holoenzyme.
Fig. 13.31
Model of the interactions between regulatory sites within a regulatory dimer in ATCase
The + and – signs correspond to an increase (cooperativity) and to a decrease (anticooperativity) of affinity, respectively
10.3.2.3 The Regulatory Signals of ATP, UTP and CTP are Transmitted by Different Paths
Extensive use of site-directed mutagenesis has shown that the transmission of different regulatory signals of the three effectors imply different interface zones between the catalytic chains and the regulatory chains, but also between different domains of the same chain (Xi et al., 1991; Van Vliet et al., 1991; De Staercke et al., 1995). At the interface between the C-terminal region of one regulatory chain and the loop containing the residue 240 of a catalytic chain (R1C4 type interface in Fig. 13.23), two contact zones, close to each other, are specifically involved, one in the transmission of the regulatory CTP signal, the other in the transmission of the regulatory ATP signal.
The regulatory chain is constituted of two domains, the allosteric domain where the regulatory site is located, and the zinc domain, which is in contact with the catalytic chains. The interface between the two domains is constituted of a hydrophobic pocket in which a tyrosine residue is inserted (Fig. 13.32 opposite). All of the interface is essential for the transmission of the ATP regulatory signal (Xi et al., 1994).
In this manner, ATCase can be considered as a transfer and integration network of regulatory signals (Fig. 13.33). The integration is performed at the catalytic site.
Fig. 13.33
Schematic representation of the transmissionof regulatory signals in aspartate transcarbamylase
Ribonucleotide reductase is an enzyme that plays an extremely important role, since it is responsible for the transformation of ribonucleotides into the corresponding desoxyribonucleotides. In the majority of species, the modification occurs on nucleotide diphosphates. The enzyme constitutes a particularly interesting example in the context of allosteric regulation mechanisms. Although in the majority of species the enzyme is oligomeric, it doesn’t show any cooperativity, although, it is the subject of a very elaborate allosteric regulation (Eriksson & Sjöberg, 1989).
10.4.1 Reaction Mechanism
The reaction mechanism of the ribonucleotide reductases ensures the direct replacement of the OH-group in the ribose 2’ position by a hydrogen atom, which is supplied by NADPH. This process involves, however, the participation of several proteins acting as hydrogen transporters (Fig. 13.34a).
In the specific case of the E. coli ribonucleotide reductase, the reaction mechanism involves the combined action of a dithiol (two cysteine residues), which is the object of a redox process, two iron atoms directly linked to the protein without a heme intermediate, and an organic free radical found on a tyrosine residue buried in the protein structure (Fontecave et al., 1992).
The first step of the reaction consists of the detachment of the hydrogen atom in position 3′ of the ribose by the tyrosine’s free radical (Fig. 13.34b). In the following step, the hydroxyl group in position 2′ is torn away and gives rise to an intermediate cation radical. Finally, the product formation involves the regeneration of the tyrosine’s free radical, by transfer of an electron to the intermediate cation rad-ical and a hydrogen atom binding in 2′ of the substrate, at the expense of the dithiol present in the enzyme. Excepting a few details, the mechanism is common to the different types of ribonucleotide reductases. In the majority of cases, the redox system associated with the reaction involves thioredoxin, glutathione and glutaredoxin (Fig. 13.34).
The Fontecave and Reichard groups have shown that the formation of the stable free radical on tyrosine 122 of the E. coli enzyme results from the action of a NADH-flavin reductase. It acts via the intermediate of the redox centre that constitutes the dithiol (Fontecave et al., 1987; Covès et al., 1993).
10.4.2 Ribonucleotide Reductase Structure
To date, two types of enzymes have been found depending on the organisms studied. The enzymes of the first type are monomeric and their activity depends on the presence of a cofactor: adenosylcobalamine. It is the type of enzyme that is found in L. leichmanii (Fig. 13.35a below). In the majority of cases, these enzymes use the nucleotide triphosphates as substrates.
Fig. 13.35
Schematic representation of the ribonucleotide triphosphate reductase
The second type of ribonucleotide reductases is found for example in E. coli and higher organisms. These enzymes have a tetrameric structure of the α2β2 type (Fig. 13.35b). α corresponds to the subunits called B1, of about 85 kDa molecular mass and β corresponds to the subunits called B2, also of about 85 kDa molecular mass. The proteins easily dissociate in pure solution but the presence of Mg++ ions favours the associated form. The iron atoms and the free radical present on tyrosine 122 are located in the B2 subunit of the E. coli protein. The dithiol is localised in the B1 subunit however, which suggests that the catalytic site is situated at the interface between the two types of subunits. The allosteric effector binding sites are also found in the B1 subunits. All these enzymes show a strong sequence homology.
The crystallographic structure of the B2 subunit of ribonucleotide reductase from E. coli was determined by the Eklund group with a resolution of 2.2 Å (Nordlund & Eklund, 1993). The structure is remarkable in that it is constituted of α helices to 70%, some of which contain more than 30 residues. Only one loop contains a short antiparallel β sheet (Fig. 13.36a below). Tyrosine 122, which bears the free radical, is buried at 10 Å from the surface of the protein and at 5 Å from the closest iron atom (Fig. 13.37 below). The two iron atoms are separated by 25 Å.
Fig. 13.36
(a) schematic representation of the E. coli ribonucleotide reductase B2subunit secondary structure. The two iron atoms are represented by small spheres
The activity of the different enzymes is regulated by several nucleotide effectors. Substrates and effectors bind to distinct and specific sites. Nevertheless, it has been possible to show the existence of “squatting” (see Sect. 13.11), which involves difference in affinities by a factor 100.
The only catalytic site of the enzymes uses as a substrate the four nucleotide triphosphates. The reaction is regulated by different end-products. All the allosteric effectors bind to the same regulatory site but lead to specific effects:
dATP increases the rate of CTP reduction,
dCTP increases the rate of UTP reduction,
dTTP increases the rate of GTP reduction,
dGTP increases the rate of ATP reduction.
These allosteric effects tend to equilibrate the production of the four desoxyribonucleotide triphosphates.
10.4.3.2 Tetrameric Enzymes
The four substrates, nucleotide diphosphates, bind to the same catalytic site. The site is located at the interface between the B1 and B2 subunits. The B1 subunit possesses two types of regulatory sites, which differ, among other things, by their dATP affinity constant; the dissociation constant is 0.5 µM for the l site and 0.03 µM for the h site.
10.4.3.3 L sites or “activity sites”
These regulatory sites bind ATP and dATP and the effectors act on the catalytic activity and not on the substrate affinity. ATP activates the enzyme and dATP inhibits it, creating an antagonism that tends therefore, in a synergistic manner, to regulate dATP production. The inactivation by dATP is accompanied by an aggregation of the enzyme.
10.4.3.4 H sites or “specificity sites”
This regulatory site behaves in the same way as the regulatory site of the monomeric ribonucleotide reductases. The binding of a given effector specifically provokes an increase of the catalytic site’s affinity for given substrates.
In the absence of an effector, the reaction rate is weak. In the presence of an effector, it increases in a specific manner:
dATP increases the reduction rate of CDP and of UDP,
dGTP increases the reduction rate of ADP and of GDP,
dTTP increases the reduction rate of the four substrates.
In addition, GDP binding to the catalytic site increases the affinity of the h sites for dTTP, which, in return, stimulates the use of the four substrates.
These enzymes therefore show very complex and subtle allosteric regulation properties. However, they display no cooperativity between catalytic sites, even in the presence of effectors.
10.4.3.5 Ribonucleotide Reduction in Anaerobic Conditions
It has been shown by the Fontecave and Reichard groups, that in anaerobiosis, E. coli uses a different type of ribonucleotide reductase for the synthesis of desoxyribonucleotides (Fontecave et al., 1989; Mulliez et al., 1993). The activity of the enzyme is very sensitive to oxidation. It uses the nucleotide triphosphates as substrates. Its activity involves an iron-sulphur centre, and the free radical is not carried by a tyrosine residue, but probably by a glycine residue located in position 681 of the polypeptide chain. Antibodies prepared against the aerobic ribonucleotide reductase described previously do not react with the anaerobic ribonucleotide reductase, showing that these two enzymes have different structures. This enzyme is activated by ATP and inhibited by desoxyribonucleotide triphosphates, which indicates that it is also subjected to allosteric regulations.
The existence of this enzyme may have an interesting significance from the point of view of evolution. It may come from an enzymatic system which allowed, in anaerobic conditions, the transition from the “RNA world” to the “DNA world” (Fontecave et al., 1989).
11 “Squatting”
The concerted model of Monod, Wyman and Changeux postulated that substrates and effectors bind to distinct sites. To date, the prediction has been verified in the case of allosteric enzymes whose structure is known with sufficient precision. The specific binding to distinct sites is easily conceivable in the case where substrates and effectors have very different structures. The situation is more complex when substrates and effectors have a structural similarity. It is the case, amongst others, for phosphofructokinase and ribonucleotide reductase (see Sects. 13.10.2 and 13.10.4), enzymes for which it has been shown that each of the two ligand types may bind to the other type of site, although with a weaker affinity than for the specific site. The phenomenon was called “squatting” by Mazat (1977), who modelled the effects and showed it could confer very elaborate and advantageous regulation properties for the cell.
The modelling performed by Mazat was based on the simple two state model, T and R states, of weak and strong affinities for the substrate and the effector(s) and consists in varying the relative ligand concentrations as well as the model parameters (allosteric constant L0, KT, KR etc.). The models explore the regulation possibilities that may result from the existence of squatting, either between different types of regulatory sites, or between catalytic and regulatory sites (Fig. 13.38).
When the two ligands considered are effectors binding to different sites, squatting may provoke the following behaviour:
Concerted or multivalent inhibition – In this case the two effectors, which are both weak inhibitors, can provoke the enzyme’s total inhibition in a synergistic manner (Fig. 13.39 opposite).
Effect reversal – For certain values of the two state model constants, the simultan-eous presence of two effectors can provoke the reversal of their effects. In the case presented in Fig. 13.40a below, the X and Y effectors considered separately are activators, but when they are both present, they provoke a strong inhibition. In the case presented in Fig. 13.40b, X and Y considered separately are good inhibitors, but when they are both present they provoke a strong activation.
The dissociation constants are indicated on the figures in arbitrary units. The T form is completely inactive. (a) the ligands X and Y are slight activators. When they are together they induce an important inhibition – (b) the ligands X and Y are strong inhibitors (99% inhibition at saturation). In the presence of both however, the activity of the enzyme can be strongly increased
The modelling results are also spectacular in the case of squatting between catalytic and regulatory sites and very complex regulatory effects can be observed. The model’s main point of interest is the fact that certain allosteric enzymes display effects similar to the model’s predictions. It is the case for glycogen phosphorylase, aspartokinase and phosphofructokinase, amongst others. For example, in the case of the aspartokinase from Pseudomonas testeroni, the reversal of the effect of lysine, which alone plays the role of an activator, is observed. In the presence of threonine, which has no effect by itself even at high concentration, lysine completely inhibits the enzyme activity.
12 “Mnemonic” Enzymes
Some monomeric enzymes display kinetic activity that differs from the Michaelis law. The variation in reaction rate as a function of substrate concentration is sigmoidal, as in the case of enzymes presenting cooperativity between catalytic sites. For metabolic regulation, the behaviour presents the same advantage as cooperativity, but obviously does not result from interactions between catalytic sites. It depends on an isomerisation process of the enzyme. Amongst the enzymes that manifest the phenomenon, we can cite whe at germ hexokinase L1, β-glycosyl transferase from plant cell walls, glucokinase from rat liver, octopine deshydrogenase from Pecten.
The principle of the mode of function of these enzymes was presented for the first time by Rabin in 1967: “the conformation of the free enzyme at the end of the catalytic cycle is different from its initial conformation”. The term of an enzyme “with memory” was introduced for the first time by Whitehead (1970) with the following meaning: “the enzyme remembers for a certain time the conformation it had when it was still associated to the reaction product(s)”. To explain the phenomenon, a more simplified picture was proposed by Rabin in 1967, in which the catalysis involves the enzyme’s isomerisation in an activated form E*:
If the isomerisation rate constant k1 is small compared to the substrate binding rate k3 to the form E*, the latter will have a certain chance of binding a substrate mol-ecule before returning to the initial conformation E. The probability of such an event increases with the substrate concentration, and therefore results in an apparent co-operativity.
The above mecanisms were described by Whitehead (1970), Frieden (1970) and Ricard (1974). Ricard’s model rests on three postulates:
the enzyme exists in two conformations at equilibrium,
substrate binding induces the appearance of a third conformation,
only one of the two initial conformations is stabilised by the reaction product(s).
An important aspect of the behaviour of “mnemonic” monomeric enzymes is that the cooperationbetween the two enzyme states is only catalytic and cannot appear in substrate or substrate analog binding experiments. The point is important as it allows the distinction between memory and cooperativity.
12.1 Case of a Mnemonic Enzyme with One Substrate and One Product
12.1.1 Kinetic Behaviour
The case is illustrated by Fig. 13.41. In the figure, the step corresponding to the liberation of the product P is presented as irreversible. This means that the reaction is analysed in the initial stationary phase conditions, in which the concentration of the product P is negligible. The rate equation is:
The simulations also show that the rate constant of substrate binding to the initial enzyme conformation, k4, influences the apparent degree of cooperativity measured by Hill’s number for instance, but does not affect the equilibrium constant between the two enzyme conformations.
12.1.2 Thermodynamic Aspects
The fact that apparent cooperativity or anti-cooperativity is observed is due to the thermodynamic parameters of the reaction. The activation energy associated to the constants k1 and k3 can be decomposed into two contributions. The constant k1 is the sum of a contribution corresponding to the activation energy associated to simple substrate binding, ΔGs≠, which does not take into account the conformational change that accompanies it, and the transconformation contribution ΔGT≠, which is the conformational change activation energy:
Figure 13.43 shows the sign and the variation of τ as a function of ΔGT≠ – ΔGT≠.
Fig. 13.43
Effects of the activation energies associated with the conformational changes on the cooperativity or anti-cooperativity of a mnemonic enzyme with one substrate and one product
12.2 Case of a Mnemonic Enzyme with Two Substrates and Two Products
The situation is obviously more complex. It was described by Ricard in the case of an ordered enzymatic mecanism in which the substrate A binds before the substrate B, the liberation of the products happens in the order P, then Q. Figure 13.44 illustrates the reactional diagram.
Fig. 13.44
Mnemonic transition for a monomeric enzyme with two substrates and two products in the case of a sequential mecanism
In this case, only the substrate A is important to determine the kinetics, since the substrate B binds to only one enzyme conformation. In the Lineweaver-Burk plot, a deviation from linear behaviour will only be observed in the representation of 1/v as a function of 1/[A]. The rate variation as a function of [B] remains Michaelian. In this case, only the values of k1 and k6 determine the apparent cooperativity or anti-cooperativity (Fig. 13.45 opposite).
The deviation from Michaelis law is linked to the activation thermodynamic par-ameters and:
if ΔGT′≠ > ΔGT≠, k6 will be smaller than k1, and there will be apparent anti-cooperativity;
if ΔGT′≠ < ΔGT≠, k6 will be larger than k1, and there will be apparent cooperativity;
if ΔGT′≠ = ΔGT≠, the enzyme’s behaviour will be Michaelian.
Figure 13.46 below shows the sign and the variation of τ as a function of the value of ΔGT′≠– ΔG′≠.
Fig. 13.46
(a) effects of the activation energies corresponding to the conformational changes in the case of mnemonic enzymes with two substrates and two products (b) definition of the activation energies associated to the conformational changes
It has been previously remarked that the substrate B has no influence on the apparent cooperativity or anti-cooperativity. However, it is interesting to note that the second product Q acts as a reaction effector. Simulations show that there will indeed be cooperativity if:
when there is cooperativity in the absence of Q (k6 > k1), the presence of Q increases the cooperativity or reverses it;
if there is anti-cooperativity in the absence of Q (k6 < k1), the presence of this product will increase the anti-cooperativity, an effect which is of interest from a physiological point of view;
if k6 = k1, the system remains Michaelian as long as the concentration of the product Q remains negligeable. When the concentration increases however, it induces the appearance of anti-cooperativity, which is also of interest for metabolic regulation.
The simulation of these regulatory effects is presented in Fig. 13.47.
Fig. 13.47
(a) simulation of the inversion of cooperativity by the reaction product Q. The concentrations of product Q are respectively 10–5(1), 0.99 (2), 2 (3), 4 (4). The numerical values are given in arbitrary units (b) effect of the product Q on the degree of cooperativity
An example of mnemonic enzymes, which has been particularly well-documented is that of the hexokinase of wheat germ studied by the Ricard group (Meunier et al., 1974). This monomeric enzyme catalyses the phosphorylation of glucose by ATPMg to give glucose-6-phosphate. The reaction proceeds according to an ordered mech-anism, in which the hexose binds before the ATPMg. The kinetic studies reveal an apparent cooperativity for glucose, while the variation of reaction rate as a function of ATPMg obeys Michaelis law. The profiles observed in the Lineweaver-Burk plot (Fig. 13.48 below) are analogous to those represented on Fig. 13.45 (a and b). In addition, glucose-6-phosphate, a reaction product, accentuates the cooperativity.
However, it should be noted that the studies by dialysis at the equilibrium of glucose substrate binding show no cooperativity, which is conform with the model predictions. Also, the cooperativity observed during kinetic studies can be abolished by weak concentrations of denaturing agents, confirming that the observed effects are the consequence of conformational equilibria; the slowness of the conformational relaxation would be due to a certain rigidity of the enzyme molecule.
13 Regulation Through Protein-Protein Interaction
Different cases of enzymatic activity regulation by small molecules binding to specific regulatory sites have been examined previously. Other mechanisms of activity regulation exist however for several enzymes, which bring into play a specific and transitory association with other proteins, which themselves possess or not an enzymatic activity. Amongst the best-known systems are the lipase-colipase system, the regulation of ornithine transcarbamylase by arginase in some organisms, the cAMP dependent protein kinase and the pleiotropic regulation by the calmodulin-calcium complex. It is also the case of protein inhibitors of proteases, which are treated in the following chapter, some of which form covalent associations, others non-covalent ones with the target protease.
13.1 The Lipase-Colipase System
The lipase-colipase system offers a particularly interesting example of regulation via the non-covalent association of two proteins. The pancreatic lipase or triacylglycerol hydrolase plays a key role in the digestion of lipids, by hydrolysing triglycerides into diglycerides, and then monoglycerides and free fatty acids. Desnuelle and his collaborators from Marseille had a pioneering role in enzymatic studies of the pancreatic lipase, which they began as early as 1951 by in vitro experiments. The studies, continued by the groups of Verger, Sarda and Chapus, now benefit from the structural knowledge that allows the enzyme’s mechanism of action to be better understood.
Lipases exist in different plant and animal organisms and in microorganisms. They belong to the family of serine hydrolases. Their active site comprises a catalytic triad, Ser, His, Asp or Glu, the existence of which was confirmed by recent crystallographic data. The essential role of these amino acids was corroborated by site-directed mutagenesis in the pancreatic lipase, the hepatic lipase and the lipoprotein lipase. The pancreatic lipase’s mode of action differs slightly however from that of the classic serine esterases by several characteristics. In contrast to classic serine esterases, the pancreatic lipase is weakly active on monomeric substrates, but displays its full activity on emulsified substrates. It is remarkable that the enzyme acts at the lipid-water interface and presents a high catalytic efficiency. In addition, in vivo, to avoid the inhibitor action of biliary salts, the presence of a cofactor, the colipase, is required. Colipase is a small pancreatic protein that forms with the lipase a non-covalent complex of stoechiometry 1:1 and whose function is to anchor the lipase at the lipidic interface covered with biliary salts.
The three-dimensional structures of several lipases have been resolved, including a mammalian one, the human pancreatic lipase and two from microorganisms. Although these lipases do not display sequence homology, they have in common a core of β sheets, which is also present in the structure of esterases, the α/β fold of hydrolases. In three lipases of known structure, the active site is inaccessible to the solvent because of the presence of a lid, which, in the pancreatic lipase, is formed of an amphiphilic helix. The human pancreatic lipase, which contains 449 amino acids is folded into two domains (Winckler et al., 1990). The large N-terminal domain comprises residues 1–335: it is typical of a α/β structure, dominated by the large central β sheet. The C-terminal domain is of the β sandwich type formed by four anti-parallel segments (Fig. 13.49 below). The limited proteolysis by chymotrypsin of the Phe335-Ala336 bond allows the separation of the two domains. The N-terminal domain contains the catalytic groups Ser152, His263 and Asp176, completely inaccessible in the enzyme’s structure. The C-terminal domain isolated by proteolysis is capable of hydrolysing small substrates, but the presence of an interface induces no activation.
The three-dimensional structures of procolipase, of the lipase-procolipase complex, and of the lipase-procolipase complex in the presence of mixed micelles (1,2-didodecanoyl-sn-3-glycerophosphoryl choline and taurodeoxycholate) were obtained at 3 Å resolution by the Cambillau group from Marseille. The procolipase is a small protein of 95 amino acids; the N-terminal pentapeptide, which is not necessary for activity in vitro is cleaved during the activation process. The protein has a structure in three fingers stabilised by five disulphide bridges (Fig. 13.50a opposite). A fourth shorter finger stands out from the core of the molecule. Although many residues adopt the β conformation, they do not form regular β sheets. The global structure of the molecule resembles that of erabutoxin.
Fig. 13.50
(a) the procolipase structure (b) the lipase-procolipase complex structure in the closed form
Procolipase binds exclusively to the C-terminal domain of lipase via the part of the molecule opposite to the fingers. The plane of the colipase is practically perpendicular to the plane of the C-terminal domain β sheet (Fig. 13.50b). Despite the numerous Van der Waals contacts that the two molecules form, there are few interactions between the lipase and the colipase. This is in agreement with the association constant (Ka = 2×10⁶ M–1). The lipase-colipase complex corresponds more to a complex of the type antigen-antibody where a surface complementarity exists, than to a proteinase-protein inhibitor complex.
The important conformational change that the lipase undergoes upon its association to a lipid-water interface was known from solution studies before the resolution of the three-dimensional structure. It also seemed obvious that the active site had to be uncovered to allow the substrate access. The structural data of the lipase-colipase complex in the absence and in the presence of mixed micelles allowed the comparison of the open and closed structures (Fig. 13.51 below). In the open structure, the helix forming the “lid” is partially unwound into two new helices and is turned around on the “body” of the molecule, considerably increasing the hydrophobicity of the active centre. The maximum displacement of the main chain, on the opening of the “lid” is 29 Å for Ile248. The combined movement of the “lid” and the turn β5 changes the environment of the catalytic triad. The active serine becomes completely solvent accessible and the hole of the oxyanion is formed at the very bottom of a hydrophobic crevice, perfectly adapted to the binding of a lipidic substrate.
Fig. 13.51
Closed (a) and open (b) structures of the lipase-procolipase complex (c) open structure in the presence of a substrate
In addition, the catalytic domain interacts with the procolipase by the intermediate of the lid, creating a long continuous hydrophobic plateau of more than 50 Å in length. Such a surface is capable of strongly interacting with the lipid-water interfaces covered by biliary salts, preventing their inhibitor effect. Figure 13.52, obtained by modelling, represents the interaction of lipids with the complex.
Fig. 13.52
Model of the hypothetical surface of lipid binding (in white)to the lipase-procolipase complex
On the described structural basis, a simplified model of the interfacial activation of the lipase is presented in Fig. 13.53, according to Carrière et al. (1994).
The activation of the lipase-colipase complex results from the conformational change of the two surface loops (the lid and the β5 loop) and the association of the colipase to the lipase. The lid domain interacts with the core of the protein (A), the β5 loop (B) and the N-terminal domain of the colipase (C). The interactions of the lid domain in the open (B) and closed (B’) forms differ, although the tryptophan 252 of the lid domain is always involved in the interactions.
The presented example, well documented today, shows how an interaction between two proteins ensures the regulation of an enzymatic activity in vivo.
13.2 Regulation of Ornithine Transcarbamylase from Saccharomyces Cerevisiae by Arginase
Ornithine transcarbamylase catalyses the first reaction of the biosynthesis pathway of arginine. Arginase catalyses the cleavage of arginine into ornithine and urea. The activities are therefore at the origin of two different metabolic pathways (Fig. 13.54 opposite). When the intracellular concentrations of arginine and ornithine are high, the system constitutes a “futile cycle”, leading to un-controlled ATP degradation. Such a danger is avoided in certain species such as Saccharomyces cerevisiae by the strong but reversible association of ornithine transcarbamylase and arginase.
Fig. 13.54
Metabolic pathways of ornithine transcarbamylase and arginase
The phenomenon, discovered by Messenguy and Wyame (1969), was studied at the molecular level by Hensley (1988). The association of the two enzymes completely abolishes the activity of ornithine transcarbamylase, but does not affect the activity of arginase. These two enzymes are trimeric proteins of molecular weights of 102 000 and 99 000, respectively.
Their association depends on effectors, which are in fact certain of the two enzymes’ substrates (Fig. 13.55 below). In the presence of ornithine, these two enzymes as-sociate strongly; the dissociation constant is 2.3×10⁻⁸ M. The association is also favoured by arginine binding to arginase. Carbamyl phosphate, substrate of ornithine transcarbamylase, reverses the effect of ornithine. Analytical ultra-centrifugation and electron microscopy experiments have established that the association occurs with a 1:1 stoechiometry. Several localised mutations in the arginase abolish its enzymatic activity without altering its capacity to associate with ornithine transcarbamylase.
In Saccharomyces cerevisiae, the two enzymes are found in the cytoplasm. In other yeast species, they are found in different cellular compartments. In this case the two enzymes have not acquired the capacity to associate, which constitutes an interesting example of evolutionary relation between cellular localisation and regulation properties.
13.3 cAMP Dependent Protein Kinases
Cyclic AMP, cAMP, synthesised from ATP by adenylate cyclase plays an important and ubiquitary role in cellular regulation processes:
cAMP is involved, in particular, in the regulation of genetic expression and in the mechanism of action of numerous hormones. The nature of its action in the last case has resulted in it being named the “second messenger”. When certain hormones such as adrenaline or glucagon bind to their receptors, at the surface of their target cell membranes, the adenylate cyclase associated to these receptors synthesise cyclic AMP, which activates a protein kinase. The protein kinase, in turn, specifically phosphorylates proteins playing a regulatory role, in particular at the level of gene expression. The phosphorylation occurs on the hydroxyl group of serine, threonine or tyrosine residues. A consensus sequence around the phosphorylation site of the substrates has been identified: Arg-Arg-X-Ser(Thr)-Y, in which X is a small residue and Y is a bulky hydrophobic group.
The protein kinases are tetramers constituted of two catalytic subunits and two regulatory subunits. In this associated form, the protein kinase is inactive. Its activation by cAMP is a result of nucleotide binding to the two regulatory subunits, which brings about the dissociation of the ensemble:
The catalytic subunit has a molecular mass of 40 kDa. The molecular mass of the regulatory subunit is different depending on if it is a type I (49 kDa) or type II (56 kDa) protein kinase. These two types of enzymes also differ in their mechanism.
Type I protein kinases in the non-dissociated form bind two ATP molecules with a strong affinity (Kd = 10 µM). The binding decreases the regulatory subunits’ affinity for cAMP. The activation of the enzymes by dissociation therefore requires fairly high concentrations of cAMP.
Type II protein kinases are capable of auto-phosphorylation. The reaction increases the regulatory subunits’ affinity for cAMP. The activation by dissociation of the catalytic and regulatory subunits is therefore effective in the case of low concentrations of cAMP.
In the case of type I protein kinases, the reaction mechanism is therefore:
in which the ATP is bound either to the associated form, or to the dissociated form. Bound to the dissociated form, it allows the phosphorylation of the target proteins. Bound to the associated form, it cannot react with the target protein. In addition, its binding shifts the association equilibrium (Kd = 50 nM) in favour of the associated form. ATP behaves therefore both as a substrate and as an effector of the protein kinase.
It appears that in the type I protein kinases, ATP binding involves both a part of the catalytic site and a particular region of the regulatory subunit. cAMP binding to the latter brings about the dissociation of subunits, allowing the correct AMP positioning in the catalytic site for phosphorylation. The activity of the catalytic subunit is also inhibited by its interaction with a natural protein thermo-stable inhibitor, which binds to a sequence of twenty residues close to the N-terminal extremity.
The crystallographic structure of the catalytic subunit of a mammal protein kinase is known with a resolution of 2.2 Å (Madhusudan et al., 1994). The subunit is made up of two domains separated by a large crevice in which the ATP binding sites and the sites that recognise the consensus sequence of the peptide to be phosphorylated are found. The smaller N-terminal domain, is involved in ATP binding; it is predominantly constituted of large anti-parallel β sheets (Fig. 13.56), an unusual structure for a nucleotide binding motif.
Fig. 13.56
Structure of the cyclic AMP dependent protein kinase subunit
(From Science, 253, Knighton D.R. et al., Structure of a peptide inhibitor bound to the catalytic subunit of cyclic adenosine monophosphate-dependent protein kinase, 414.
The C-terminal domain is essentially constituted of α helices with a single β sheet, placed at the interface between the two domains. The C-terminal domain is involved in the binding of the peptide to be phosphorylated and in catalysis. It is remarkable that the sequence between residues 40 and 280 constitutes a catalytic core common to more than 100 protein kinases! This sequence includes residues Lys72, Glu91 and Asp184 that form the catalytic triad (Fig. 13.57 opposite). The reaction catalysed by the protein kinases proceeds through an ordered mechanism, in which the ATPMg binds before the peptide to be phosphorylated. ATPMg binding induces a movement of the two domains, bringing them closer together, which was confirmed by crystallographic studies of different complexes (Madhusudan et al., 1994). Once the substrates are bound, the catalysis is rapid and the phosphorylated peptide dissociates instantaneously. The limiting step of the reaction is the dissociation of ADP. In the case of the cAMP dependent protein kinase, kinetic studies suggested that Asp166, which is present in all kinases, is the most probable candidate to play the role of catalytic base. The catalysis occurs by direct transfer in-line with configuration inversion; no phosphoryl-enzyme intermediate is formed.
13.4 Regulations by Interaction with the Calmodulin-Calcium Complex
Calmodulin is a small protein of molecular weight of the order of 15 000 depending on the species, capable of binding four calcium ions. It is found in variable concentrations in all tissues in eukaryotic organisms. The calcium-calmodulin complex is involved in the regulation of about thirty proteins identified to date, and the list is certainly not complete. The physiological processes in which calmodulin intervenes are numerous and varied: intracellular calcium concentration, contraction of smooth muscles, neurotransmitter metabolism, cellular division, secretion and motility phenomena, toxicity of certain microorganisms (for example Bordetella pertussis, the agent of whooping cough etc.). The described effects require the activation of certain enzymes such as adenylate and guanylate cyclases, the protein kinases amongst those that assure the phophorylation of glycogen phosphatase, the phosphodiesterases of cyclic nucleotides, phospholipase A2, NO-synthase etc. The activation requires the specific interaction of the calmodulin-calcium complex with these enzymes or with other proteins such as ion transporters, motility proteins, transcription factors and cytoskeleton components. However in the particular case of adenylate cyclase activation of Bordetella pertussis, the presence of calcium is not necessary.
The crystallographic structures of several calmodulins from different species have been determined; that of the recombinant protein from vertebrates has been resolved to 1.7 Å by the group of Chattopadhyaya et al., (1992). The protein has a dumb-bell structure (Fig. 13.58); it is constituted of two globular domains linked by a long α helix. The length of the whole protein is 65 Å. The globular domains have a diameter of 30 Å and are made up of three α helices and two small anti-parallel β sheets. The central α helix spreads over eight turns and is solvent exposed.
Fig. 13.58
Representation of the calmodulin molecule from the crystallographic structure of Babuet al.(1988) (PDB: 1CLL)
The residues of the hydrophobic pockets are shown in black
The four calcium binding sites are located in the globular domains. The average affinity of the sites is high, with a dissociation constant of Kd ∼ 10–6 M. The affinity varies however with the degree of occupation of these sites. To explain all the phenomena observed on calcium binding, Haiechet al. (1988) proposed a model. According to this model, the binding of the first calcium atom to the C-terminal domain increases the affinity of the second site of the same domain for calcium. The occupation of the two C-terminal domain sites induces a more important conformational change that has repercussions at the level of the N-terminal domain. The third calcium atom can then bind to one of the sites of the N-terminal domain increasing the affinity of the fourth site for calcium. The properties of the modified forms of calmodulin in which tryptophan residues were introduced by site-directed mutagen-esis at each calcium site confirmed the model described by Haiech (Kilhoffer et al., 1992). The conformational changes that accompany the calcium binding decrease the length of the molecule by a few angströms, through inducing a curvature of the central helix. This is accompanied by an increase of a few percent of the helical percentage of the protein with the formation of a hydrophobic pocket at each globular domain.
Calmodulin interacts with its target proteins via the intermediate region of the central helix. Despite the very large diversity of these proteins and their variable accessibility (ATPase-Ca++-Mg++ is a membrane protein), the interaction is always very strong with a dissociation constant of the nanomolar order. The peptide corresponding to the interaction zone of several target proteins has been isolated or synthesised. The peptides possess the common characteristic of presenting an organisation in amphiphile and basic helices. The crystallographic structure of several complexes of the peptides with calmodulin has been resolved. This is the case, in particular, of the peptide isolated from the kinase of the light chain of myosine, as well as wasp (mastoparan) and bee (mellitin) toxins. In the complex, the curvature of the central helix is very pronounced and the two globular domains come into contact. The interaction between the peptide and calmodulin is essentially of hydrophobic nature. Figure 13.59 shows how the peptide M13 of the kinase of the light chain of myosin, of helicoidal structure, is inserted in the hydrophobic canal, which passes across the centre of the calmodulin molecule (Ikura et al., 1992).
Fig. 13.59
Three-dimensional structure of calmodulin in the presence of the M13 peptide from the kinase of the myosin light chains
The grey dots represent calcium ions. The peptide is in the centre of the structure. The central helix has lost its α helical structure
Calmodulin is the object of post-translational covalent modifications such as phosphorylation and trimethylation of the lysine residue in position 115. The post-translational modifications are supposed to be involved in the regulation of the proteolytic degradation of calmodulin.
All the aspects treated in this chapter show the wide variety of mechanisms of non-covalent regulation that living organisms dispose of to modulate enzymatic activity as a function of the requirements of the cell and the environmental constraints.
Evans P.R. – 1992– Activity and allosteric regulation in bacterial phosphofructokinase, in The Robert, A. Welch Founda-tion Conference on Chemical Research XXXVI: Regulation of proteins by ligands, Houston, Texas, 39–54.
Johnson L. – 1992– Allosteric regulation of glycogene phosphorylase, in The Robert, A. Welch Foundation Conference on Chemical Research XXXVI: Regulation of proteins by ligands, Houston, Texas, 17–35.
Lipscomb W.N. – 1992– Activity and regulation in aspartate transcarbamylase, in The Robert, A. Welch Foundation Conference on Chemical Research XXXVI: Regulation of proteins by ligands, 103–143.
Mazat J.P., Langla J. & Mazat F. – 1977– Double-site enzymes and squatting. A study of the regulation by one or several ligands binding at two differ-ent classes of site, J. Theor. Biol. 68, 365.
Van Vliet F., Xi X.G., De Staercke C., De Wannemaeker B., Jacobs A., Cherfils J., Ladjimi M.M., Hervé G. & Cunin R. – 1991– Proc. Natl Acad. Sci. USA88, 9180.
Xi X.G., Van Vliet F., Ladjimi M.M., De Wannemaeker B., De StaerckeC., Pierard A., Glandsdorff N., Hervé G. & Cunin R. – 1990b– J. Mol. Biol. 216, 375.
Xi X.G., Van Vliet F., Ladjimi M.M., De Wannemaeker B., De Staercke C., Glandsdorff N., Pierard A., Cunin R. & Hervé G. – 1991– J. Mol. Biol. 220, 789.