
Abstract
Most modern mechanical ventilators offer a multitude of graphics and numerics allowing to monitor respiratory mechanics during ongoing mechanical ventilation. The information provided by these integrated respiration monitors is first to provide the information necessary to optimise ventilator settings in an individual patient and second to document disease evolution over time or in response to therapeutic interventions. Furthermore, measuring respiratory mechanics during ventilation can allow developing automatic adaptation algorithms of ventilator settings. However, to do this either by manual or by automatic ventilator settings adjustment, a thorough understanding not only of basic respiratory mechanics during mechanical ventilation is needed but also a good understanding what graphs and numbers can tell the physician or respiratory therapist at bedside. Graphic monitoring shows graphs generated from the signals of airway pressure (as usually measured at the airway opening, e.g. endotracheal tube or face mask connection), gas flow and volume change of the respiratory system. Volume is in fact measured by the time-integral of gas flow. It must be noted also that all the measurements derived from the airway opening pressure include the resistance of the artificial airway (i.e. endotracheal tube) as part of the respiratory system resistance.
Access provided by Autonomous University of Puebla. Download chapter PDF
Keywords
These keywords were added by machine and not by the authors. This process is experimental and the keywords may be updated as the learning algorithm improves.
Most modern mechanical ventilators offer a multitude of graphics and numerics allowing to monitor respiratory mechanics during ongoing mechanical ventilation. The information provided by these integrated respiration monitors is first to provide the information necessary to optimise ventilator settings in an individual patient and second to document disease evolution over time or in response to therapeutic interventions. Furthermore, measuring respiratory mechanics during ventilation can allow developing automatic adaptation algorithms of ventilator settings. However, to do this either by manual or by automatic ventilator settings adjustment, a thorough understanding not only of basic respiratory mechanics during mechanical ventilation is needed but also a good understanding what graphs and numbers can tell the physician or respiratory therapist at bedside. Graphic monitoring shows graphs generated from the signals of airway pressure (as usually measured at the airway opening, e.g. endotracheal tube or face mask connection), gas flow and volume change of the respiratory system. Volume is in fact measured by the time-integral of gas flow. It must be noted also that all the measurements derived from the airway opening pressure include the resistance of the artificial airway (i.e. endotracheal tube) as part of the respiratory system resistance.
Classically the following curves and loops can be displayed: pressure, flow or volume over time, pressure–volume (as an indicator of dynamic compliance), pressure-flow (as an indicator of resistance) and flow volume.
1 Respiratory System Compliance (i.e. The Pressure–Volume Relationship) During Ongoing Mechanical Ventilation
Educational Aims
-
To understand what information can be gathered from respiratory system compliance measurements
-
To review various factors and error sources that might influence dynamic compliance measurements during ongoing mechanical ventilation
-
To understand why analysis of the shape of the dynamic PV curve can give more helpful information than analysis of respiratory system compliance values only
-
To understand the difficulties and limited value of respiratory compliance measurements during high-frequency ventilation (HFV)
During mechanical ventilation, respiratory mechanics can be assessed by studying the pressure–volume (PV) relationship, describing the elastic properties of the respiratory system, lungs and chest wall, above end-expiratory lung volume (EELV) or functional residual capacity (FRC). However, it is apparent that a complete description of the elastic behaviour of the respiratory system would require measurements made over the complete volume range, from residual volume (RV) to total lung capacity (TLC).
Analysis of the PV relationship can be used in two ways, first to describe the overall compliance of the respiratory system under quasi-static conditions, which might be used as an indicator of evolution of lung disease over time, and second for setting ventilator pressures within the range that is thought to be safe (i.e. above the lower (LIP) and below the upper inflection point (UIP) (for further information see Sect. 11.8). The segment between the LIP and the UIP represents a zone of best compliance within tidal ventilation should occur (Fig. 13.1). However, it has been realised that the real PV curve of the respiratory system, which describes respiratory system behaviour, has to be obtained during static or at least semi-static conditions (i.e. no flow conditions or low flow conditions, respectively) to avoid artefacts mainly due to various forces opposing inspiratory flow such as:

Pressure–volume curve of a moderately diseased lung, such as one with adult respiratory distress syndrome. Two hazard zones exist. In the zone of overdistention, damage occurs from oedema fluid accumulation, surfactant degradation, high oxygen exposure and mechanical disruption. In the zone of derecruitment and atelectasis, lung injury develops through the direct trauma of repeated closure and reexpansion of airways and alveoli, by stimulation of the lung’s inflammatory response, by inhibition of surfactant, through the effects of local hypoxemia, and through compensatory overexpansion of the rest of the lungs as the lung ‘shrinks’. High end-expiratory pressures and small tidal volumes are needed to stay in the ‘safe’ window (Reprinted with permission from Froese (1997))
-
Viscous forces (friction along the endotracheal tube, the airways and lung tissue affecting flow)
-
Elastic forces (elastic forces by the lung and elastic recoil forces by the chest wall)
-
Viscoelastic forces (stress adaptation within lung and chest wall tissues)
-
Inertial forces (at the start of inspiration and expiration)
Additional factors that will induce additional errors in PV measurements are:
-
Compressibility of gases
-
Gas resorption in the lungs
-
Inertial forces (at the beginning of both, inspiration and expiration)
-
Inhomogeneity within the lungs with inhomogeneous filling behaviour of various lung regions
Generation of the static or semi-static PV curve on bedside is cumbersome using either step-by-step or occlusion inflation/deflation methods, alternatively continuous slow flow inflation methods have been proposed (Sydow et al. 1991, 1993; D’Angelo et al. 1994; Ranieri et al. 1994; Lu et al. 1999). All methods require the patient being sedated and muscle paralysed. The advantage of this static and semi-static measurements is, because of pressure and volume readings, made under no flow conditions and in steady state condition of the system (i.e. only when a stable pressure reading is reached) for the step-by-step inflation and deflation method by a super-syringe using small volume aliquots or during no flow for the flow interruption techniques during constant low flow inflation (Lu et al. 1999) that airway resistance does not, or almost not, influence measurements of the respiratory systems PV curve that describes the behaviour of the respiratory system over the whole volume range, i.e. form functional residual capacity to total lung capacity.
In cooperative subjects, it is possible to measure the PV curve starting at RV, which influences the shape of the inflation, but not of the deflation, PV curves. Likewise, in an excised lung, PV curves can be obtained from the degassed state, and this has a profound effect on the shape of the inflation limb of the PV curve, while the deflation limb remains unchanged. In other words, the shape of the inflation limb depends on the initial lung volume at which its determination starts (Jonson et al. 1999). However, making measurements from RV is impractical and indeed dangerous in patients with acute lung injury. Therefore, measurements of PV curves are generally made starting from end-expiratory lung volume (EELV) at 0 cm H2O airway pressure. In normal subjects, EELV is synonymous with FRC, defined as the volume determined by the balance of static passive forces of the lung and chest wall (see Fig. 11.23, Sect. 11.8).
By definition, positive pressure ventilation with a PEEP value above 0 cm H2O in a sedated and paralysed patient occurs above FRC. Therefore, with any setting on the ventilator, only the volume above the FRC can be modified according to the characteristics of the PV curve (i.e. compliance and hysteresis). In some patients the FRC is virtually at the RV; in others there is a substantial expiratory reserve volume. If the disease is associated with a highly compliant lung or chest wall, the FRC will be high, and, conversely, if the lung or chest wall compliance is low, the FRC will be low. In the former case, one may not see an inflection point on the inflation limb of the PV curve, whereas it will probably be present in the latter. The position of the FRC within the TLC is thus ‘disease specific’ and the problem is that even when FRC is measured with a gas dilution technique, it is difficult to assess it in relation to the TLC. Furthermore, in ALI/ARDS there is a significant portion of the intrathoracic gas volume occupied by tissue oedema, fluids and inflammatory cells, as evidenced by computed tomographic studies; therefore lung gas volume measurements may not always be predictive of total thoracic volume (Gattinoni et al. 1998). A further difficulty is that if by some ventilatory strategy, although one succeeds in increasing lung volume, one is never sure whether this is due to recruiting new gas exchange units (good) or overdistending already open units (bad) (Rouby et al. 2002).
Furthermore, for the purpose of such measurements, it would be necessary to interrupt the normal ventilatory pattern of the patient, which does require the patient to be passive, which often means to be paralysed (for further information see Sect. 11.8).
1.1 Dynamic Pressure–Volume-Loop Analysis and Dynamic Compliance for Assessment of Disease Evolution
Static or semi-static methods of PV measurements may offer a diagnostic tool (Bone 1976) diagnosis of causes for acute respiratory distress syndrome (i.e. extrapulmonary versus intrapulmonary ARDS) allowing to describe progress of disease (Falke et al. 1972; Suter et al. 1975; Matamis et al. 1984) or document the effect of treatment or an intervention (Lachmann et al. 1982; Tooley et al. 1987) (Pfenninger et al. 1992); the latter can be of special interest for various clinical research purposes and eventually allow for prognosis (Gattinoni et al. 1984), but they cannot be used for continuous monitoring of respiratory mechanics during ongoing ventilation.
1.2 Dynamic Pressure–Volume-Loop Analysis and Dynamic Compliance Measurements for Choosing Ventilator Settings
1.2.1 During Conventional Ventilation
There exists a certain interest in using measurements and analysis of respiratory mechanics during ongoing mechanical ventilation that could help to improve ventilator settings. However, mechanical properties of the respiratory system assessed under the dynamic condition of mechanical ventilation are not equivalent to those assessed under static conditions (Stahl et al. 2006). The observations that (1) the inflation limb of the quasi-static PV curve (as generated by the super-syringe or low flow inflation methods) is distinctly different from the deflation limb, (2) the inflation limb is highly sensitive to the initial inflation conditions (i.e. whether inflation starts from zero PEEP or another PEEP level) (Jonson et al. 1999) and preceding lung history (i.e. whether the patient was disconnected or even suctioned shortly before), and (3) the tidal cycle is not placed on the inflation limb of the quasi-static PV (Rimensberger et al. 1999) illustrate well how difficult it can be to use the slope of the tidal cycle PV curve (i.e. dynamic compliance) during titration of PEEP stepwise upwards as only indicator for best ventilator settings as suggested many years ago (Suter et al. 1975, 1978). The following strategies might potentially help, despite several limitations of each method, to optimise PEEP and V t or plateau or peak pressure setting, respectively.
1.2.1.1 Optimising PEEP by Dynamic Compliance Measurements and Graphic Analysis
-
Classically, as cited in several textbooks, it has been thought that changes in dynamic compliance values during upward titration of PEEP would clearly indicate the best PEEP level given the concept that the tidal cycle would move along the static inflation PV curve of the respiratory system (Fig. 13.2). With the recognition that PV hysteresis of the respiratory system exists (Escolar et al. 2002; Escolar and Escolar 2004) (see also Sect. 11.8), that the deflation limb of the static PV is much more stable and therefore relatively independent from lung history (i.e. previous inflation conditions) (Rimensberger and Bryan 1999) and that after a lung recruitment the dynamic PV cycle during ongoing ventilation can be placed on the deflation limb of the corresponding static PV curve (Fig. 13.3), it has been suggested to use a decremental PEEP following a recruitment manoeuvre to indentify optimal PEEP settings (Rimensberger and Bryan 1999; Hickling 2001; Suarez-Sipmann et al. 2007; Maisch et al. 2008). The PEEP that resulted in the highest compliance during decremental PEEP steps is considered to be optimal (Fig. 13.4). Furthermore, it has been shown that changes in aerated and non-aerated lung volumes induced by a lung recruitment manoeuvre can be adequately represented by respiratory compliance but much less by changes in oxygenation or shunt (Henzler et al. 2005). This approach of using the individual patient’s lung mechanics to open the lung and set PEEP is very promising because of its ease for implementation (Hermle et al. 2002).
Fig. 13.2 
Classically, as cited in several textbooks and company handbooks, it has been thought that changes in dynamic compliance (indicated by the slope of the ventilatory PV-cycle in green color) would clearly indicate the best PEEP level (in this example scenario B) given the concept that the tidal cycle would move along the static inflation PV-curve of the respiratory system. This does not take in account hysteresis of the respiratory system and is therefore over simplified. The ventilatory tidal cycle never lies on the inflation limb of the static PV-curve (see also Fig. 13.3)
Fig. 13.3 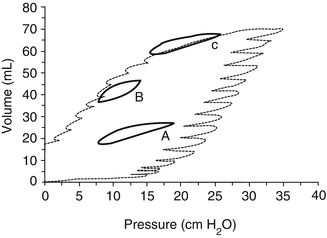
Dynamic loops (tidal volume, 5 mL/kg) with 3 PEEP settings with and w/o lung recruitment inscribed into the quasi-static pressure/volume curve of the respiratory system of one animal after surfactant depletion with repeated lung washes: (A) PEEP < P inf without preceding SI; (B) PEEP < P inf after a SI; (C) PEEP > P inf. Note that the dynamic loop A (PEEP without any sustained inflation) is positioned above the inflation limb of the static PV curve and that loop B (PEEP after sustained inflation) is positioned on the deflation limb of the static PV curve. With PEEP > P inf, the dynamic loop (C) is on the asymptote of the static PV curve. PEEP positive end-expiratory pressure, P inf lower inflection point on the inflation limb of the overall PV curve, SI sustained inflation (Reprinted with permission from Rimensberger et al. (1999))
Fig. 13.4 
Individual changes in dynamic compliance decremental PEEP steps after a recruitment manoeuvre (RM) in an experimental study. A biphasic response (i.e. a first increment and a subsequent decrement with a visually identifiable maximum) can be observed. Each symbol represents an individual animal. RM recruitment manoeuvre, PEEP positive end-expiratory pressure (Modified with permission from Suarez-Sipmann et al. (2007))
-
Alternatively, the lower and upper inflection points of the quasi-static PV curve were regarded repeatedly as points of interest to avoid cyclic derecruitment and overdistension and to optimise ventilatory settings (Fig. 13.5). However, this concept is not fully appropriate since it has been clearly shown that alveolar reinflation occurs along the whole P/V curve. In addition, the dynamic tidal cycle is positioned always above the inflation limb of the quasi-static PV curve (Rimensberger et al. 1999; Hickling 2001) (Figs. 13.6 and 13.7), and this is more marked when PV hysteresis is important. Therefore, the lower inflection point has no relationship with alveolar opening and closure and does not indicate the positive end-expiratory pressure needed to prevent alveolar collapse (Maggiore et al. 2003). In short, identification of a lower inflection point on the dynamic pressure–volume loops obtained during tidal ventilation should not be used to guide PEEP settings (Adams et al. 2001) (see also Sect. 11.8.2).
Fig. 13.5 
The classical concept of the interpretation of the pressure–volume curve indicates that with positioning the tidal cycle by using a PEEP value above the lower inflection point (LIP), the risk for atelectrauma should be reduced, and with positioning the tidal cycle by using a PIP value below the upper inflection point (UIP), the risk for volutrauma should be reduced. PEEP positive end-expiratory pressure, PIP positive inspiratory pressure, LIP lower inflection point, UIP upper inflection point, C compliance, dV delta volume = tidal volume, dp delta pressure, V t tidal volume (With permission, modified from Berger and Stocker (2004))
Fig. 13.6 
Inspiratory tidal PV plots with V T 140 ml with incremental (black symbols) and decremental (open symbols) PEEP levels from 0 to 25 cm H2O derived mathematically from multiple units lung model. At each PEEP level, the volume at equivalent pressures and the mean tidal PV slope (i.e. tidal cycle compliance or dynamic compliance during conventional mechanical ventilation) are greater during decremental PEEP. With zero PEEP, the plots for incremental and decremental PEEP are superimposed. Note that the dynamic tidal PV cycle is never positioned on the plotted inflation limb of the overall PV curve (Reprinted with permission from Hickling (2001))
Fig. 13.7 
Tracing of the dynamic pressure–volume curve (blue line) during incremental and decremental PEEP steps using volume-calibrated respiratory inductive plethysmography (RIP) in an animal after surfactant depletion by repeated lung washes and superimposed the theoretical quasi-static PV curve (black line). Note that the lower inflection point on the static PV curve (i.e. PV envelop) has no relationship with alveolar opening and closure and does not indicate directly the positive end-expiratory pressure needed to open the lung or to prevent alveolar collapse
-
However, airway graphics can, despite the limitations mentioned above, be useful to guide ventilation.
-
1.
One possible strategy is to use airway graphics to determine ‘best’ PEEP (Fig. 13.8) in order to avoid airway collapse end-expiration, as testimonied by a flat horizontal dynamic pressure–volume (PV) curve (0 volume reading between the set PEEP and a higher pressure level at which airway opening will start to happen). Whereas when the first part of the PV curve from set PEEP shows a slow and a second part a fast increase in volume (Fig. 13.8), this will not indicate that PEEP settings are too low and therefore allowing for collapse. Such a phenomenon is a result of initial fast flows in a high resistive system (endotracheal tube) during rapid increase of airway pressures, because pressures are measured in the respiratory circuit at the ETT connection (i.e. before the part of high resistance in the respiratory circuit that includes the endotracheal tube) and not on the tracheal level (Karason et al. 2000) (see Fig. 11.27). Therefore, the dynamic PV loop cannot give a clear indication on the required PEEP level. However, a completely flat and horizontal line for the first part of the inflation limb might suggest that there might be no volume change induced when pressures are increased which could indicate that there is major lung collapse during the first part of lung inflation. Whereas when the first part of the PV curve from set PEEP shows a slow and a second part a fast increase in volume. The change in curvature of the inflation limb is related mainly to endotracheal tube resistance. This latter does not indicate that PEEP settings are too low. This can be easily confirmed by the observation that this ‘lower inflection point’ is shifted to the right when PEEP is increased (Fig. 13.8, see also Fig. 11.27 in Sect. 11.8).
Fig. 13.8 
Dynamic pressure loop as displayed by the SLE 5000 ventilator in the TCPL mode. PEEP and PIP are increased from 6 to 8 and PIP from 18 to 20 cm H2O within three breath cycles. Note the shift of the lower inflection point (LIP) from 14 cm H2O with a PEEP setting of 6 cm H2O (black line) to 16.5 cm H2O with a PEEP setting of 8 cm H2O (red line). The green line depicts the respiratory cycle occuring during changes of settings are made. The appearance of a LIP is a result of airway resistance during fast flow inflation and does not indicate lung opening. TCPL Time cycled pressure limited
Fig. 13.9 
Pulmonary vascular resistance (PVR) is lowest at functional residual capacity (FRC). In the diseased lung, FRC is in general reduced due to lung infiltration, consolidation, atelectasis or presence of interstitial oedema, with resultant loss of pulmonary vascular integrity and increased PVR (A). Any recruitment in lung volumes in order to restore as much as possible normal FRC will therefore lower PVR, whereas overdistention of lung units will again increase PVR through compression of the pulmonary vascular bed (B)
-
2.
On the other side of the PV range, pulmonary overdistension occurs when the volume limit of some areas of the lungs is approached. It will be manifested as a dramatic reduction in compliance at the terminal end of the breath. This commonly is referred to as ‘beaking’ and often numerically expressed as by the C20/C value (i.e. the ratio between the slope, i.e. compliance of the last 20 % of the upper pressure range and the slope, i.e. compliance of the total PV loop) (see Fig. 11.51). Overdistension should be avoided as it has several deleterious effects on the cardiovascular and pulmonary system. First, overdistension puts the patient at risk for baro-/volutrauma. Second, overdistension can increase dead space and therefore render ventilation less efficient. Third, overdistension will result in a dramatic increase in pulmonary vascular resistance (Fig. 13.9) from pulmonary vascular compression and a resultant reduction in cardiac output. These effect will be even more dramatic at higher levels of PEEP while maintaining identical V t or driving pressure (ΔP = PIP − PEEP). When terminal ‘beaking’ is observed, the clinician should reduce the set PIP or V t to reduce the risk of overdistension of some lung areas.
-
3.
A third concept would be the analysis of the curvature of the pressure–time curve generated during a low flow inflation for V t delivery. Ranieri et al. have shown that this might allow to detect variations in compliance during tidal inflation, indicating either the occurrence of alveolar overdistention at end-inspiration, or alveolar recruitment during tidal inflation (Figs. 13.10 and 13.11) (Ranieri et al. 2000). Hammer and colleagues measured FRC in relation to TLC by gas dilution in children with a variety of lung disease. Determination of TLC and FRC (i.e. the FRC/TLC ratio) allowed estimating the degree of lung overinflation (Hammer et al. 1998). However, for bedside application this latter method is not as simple to be used.
Fig. 13.10 
The conceptual illustration of the dynamic pressure–time (P–t) curve. Based on the power equation P L = a ⋅ t b + c, b = 0.5 produces a convex P–t curve, indicating continuing recruitment; b = 1 produces a straight P–t line, indicating no alveolar continuing recruitment or overdistension; and b = 1.5 produces a concave P–t curve, indicating alveolar overdistension. The power equation was applied to the transpulmonary pressure (PL) signal during a constant inspiratory flow (vertical bars) (Reprinted with permission from Ranieri et al. (2000))
Fig. 13.11 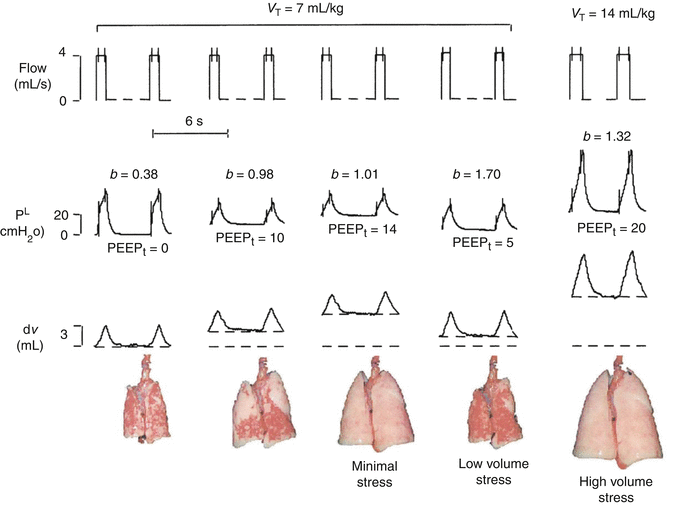
Representative data record showing physiologic variables (flow, transpulmonary pressure (PL) and changes in lung volume (ΔV)) and the appearance at end-expiration of the excised lung during the different experimental conditions. The equation P L = a ⋅ t b + c was applied to the inspiratory PL during constant flow (vertical bars on flow and PL). Low-volume stress, coefficient b = 0.5, indicates ongoing recruitment; minimal stress, b = 1, indicates no ongoing recruitment or overdistention; and high-volume stress, b = 1.5, indicates overdistension. PEEP positive end-expiratory pressure (Reprinted with permission from Ranieri et al. (2000))
-
1.


1.2.1.2 Identification of Dynamic Hyperexpansion
When airway resistance is high and/or fast respiratory rates are used, the patient is at risk for dynamic hyperexpansion. This occurs when exhalation does not come to completion. As a result there is retained gas in the patient’s respiratory system (i.e. ‘gas trapping’) leading to intrinsic PEEP, which is difficult to control and should be if any possible avoided. Dynamic hyperexpansion might decrease venous return and hence preload and cardiac output. To limit the risk for dynamic hyperexpansion, one should decrease the T I, which if becoming inappropriately short may decrease delivered V t (see above) or reduce the ventilatory rate to allow for a longer T E.
1.2.2 During High-Frequency Ventilation
1.2.2.1 Monitoring of Compliance During High-Frequency Ventilation
There is substantial animal evidence to suggest that static compliance (Crs) can be used to determine the optimal application of high-frequency ventilation (HFV). Byford et al. (1988) showed that improvements in static and ‘quasi-static’ CRS were directly related to the magnitude of mean airway pressure (P aw) change, and subsequent recruitment achieved, after sustained inflations during HFV in surfactant-deficient rabbits. Later, Bond and Froese (1993) also reported, in the same animal model, an improvement in Crs after application of a volume recruitment manoeuvre during HFV. The deflation limb of the pressure–volume relationship has been repeatedly shown to coincide with the point of optimal static Crs during HFV (Rimensberger et al. 1999, 2000a; Goddon et al. 2001; McCulloch et al. 1988; Pillow et al. 2004). Finally, Wood et al. (2002) were able to identify atelectasis and overdistension on the inflation limb using static Crs. Monitoring of static Crs in patients receiving HFV is difficult as it requires cessation removal from tidal ventilation. Monitoring of dynamic Crs is problematic during HFV. The reasons for this are outlined below.
1.2.2.2 Difficulties in Determining Dynamic Crs During High-Frequency Ventilation
Despite the potential benefits of understanding the mechanical properties of the respiratory system during high-frequency ventilation, direct monitoring of dynamic Crs and resistance (R RS) is rarely performed at the bedside. This is due to the difficulties in determining both parameters during HFV. HFV is characterised by high flow, low tidal volume, low intra-alveolar change in pressure and high rate conditions, a situation that limits measurement conditions due to lower signal to noise ratio. It is worth considering the other reasons that limit monitoring of dynamic Crs during HFV.
1.2.2.3 Wave Form Attenuation
Unlike conventional modes of ventilation, change in pressure at the airway opening (ΔP) cannot be considered equal to change in transpulmonary pressure (P TP) during HFV (Gerstmann et al. 1990). Attenuation of waveform characteristics is not constant and influenced by multiple factors, including the resistance in the endotracheal tube and lung mechanics of the airways, lung tissue and chest wall (Pillow et al. 2002). Increasing alveolar compliance reduced the attenuation while increasing chest wall resistance increased it. Most modern HFV are limited to the measurement of airway pressure and flow at the airway opening; during HFV these measurements can only be considered proxies of the intrapulmonary mechanics.
1.2.2.4 Mathematical Assumptions of Respiratory System Mechanics
All commonly applied bedside methods of determining Crs, and RRS (see also Sects. 11.8 and 13.2) during mechanical ventilation apply mathematical assumptions to model the complex mechanical behaviour of the respiratory system. These assumptions are generally not valid during HFV or require computations beyond the capacity of most modern ventilators.
Although the Mead-Whittenberger analysis (Mead and Whittenberger 1953) is an accepted method of calculating Crs during mechanical ventilation, it cannot be applied to HFV, given the fact that there are no points of a zero flow condition attained at any point of the oscillatory cycle (Fig. 13.12). Similarly, the Least-Squares Regression Method applies the general equation of motion to a single compartment model (Stocks et al. 1996). Again, analysis has to be between two points of the pressure–volume curve, in this case taken from slope of the line joining the maximal and minimal volume. Again, the complex nature of pressure and flow waves, and attenuation, limits this methodology during HFV.

Airway pressure (cm H2O) and flow (mL/s) waveforms measured at the airway opening during four oscillatory cycles (Sensormedics 3100A high-frequency oscillatory ventilator) in a term infant with meconium aspiration syndrome. The Mead-Whittenberger method of determining dynamic C rs cannot be applied as the two points of zero flow during each oscillatory cycle (dashed lines) do not correlate with the peak and trough of the pressure wave form (dashed lines)
In contrast, the multiple linear regression technique uses the entire respiratory cycle to calculate Crs (Stocks et al. 1996). This method is valid during the complex pressure and flow conditions of HFV but requires an analytic process that involves applying an algorithm to minimise errors between the observed pressure changes and the assumed pressure behaviour using the equation of motion for the flow and volume measurements. Multiple linear regression is currently impractical outside of a research environment.
1.2.2.5 Alternatives to Crs During HFV to Describe Respiratory Mechanics
In a state where the resistance of the ETT and ventilator circuit, lung disease, flow and applied ΔP are constant, it stands to reason that any change in measured HFV V T (V THFV) at the airway opening would be due to a change in Crs (Rossing et al. 1981; Slutsky et al. 1981; Wright et al. 1981). V THFV can be measured at the airway opening using pneumotachography (Boynton et al. 1989; Dimitriou et al. 1998; Kamitsuka et al. 1990; Scalfaro et al. 2001; Watson and Jackson 1984; Zimova-Herknerova and Plavka 2006) and correlated well to plethysmographic measurement of tidal volume (Courtney et al. 1990). This method has been shown to be feasible and accurate in adults receiving HFOV for ARDS (Hager et al. 2007; Hager et al. 2006). A relationship between P aw, volume state of the lung, lung volume and stroke volume (i.e. tidal volume during high frequency ventilation; V THFV) V THFV has been identified in 15 preterm infants with acute RDS receiving HFOV during the application of an open lung ventilation strategy to map the pressure–volume relationship of the lung (Miedema et al. 2012). Electrical impedance tomography measures regional end-expiratory thoracic volume and tidal volumes during HFOV, quantifying that V THFV changes at the airway opening were indicative of regional lung recruitment, overdistension and collapse. This suggests that V THFV is at least functionally representative of CRS. Measurement of tidal volume at the airway opening may be a useful relative indicator of the alveolar tidal volume during HFOV.
During HFV the carbon dioxide diffusion coefficient (DCO2) can be used to mathematically describe alveolar ventilation and CO2 elimination (Rossing et al. 1981; Slutsky et al. 1981; Chang 1984). DCO2 is proportional to the product of the frequency and the square of tidal volume (Chang 1984). Using this formula, an increase in either frequency or tidal volume should improve CO2 elimination. This is in contradiction to the clinical observation that a reduction in frequency improves CO2 elimination and illustrates the importance of using HFV at a frequency appropriate for the disease state and resultant lung mechanics. In addition, many high-frequency ventilators are unable to maintain a constant stroke volume over their operating range of frequencies (Hatcher et al. 1998). Some modern mechanical ventilators monitoring systems display DCO2.Footnote 1 This is calculated from the measured frequency at the airway opening and the square of V THFV, as such it should be considered a proxy of alveolar ventilation. In situations in which the applied frequency and R rs are constant, DCO2 will only be influenced by Crs (V THFV).
There is little published data on the use of V THFV or DCO2 measured at the airway opening to monitor changes in Crs during HFV. Mean airway pressures resulting in overdistension and atelectasis caused a reduction in V THFV in healthy and surfactant-deficient piglets (Mills 2003, PhD Thesis, University of Melbourne). V THFV improved after alveolar recruitment. A similar relationship between V THFV (and DCO2), applied pressure and resultant volume state of the lung was demonstrated in a small study involving 15 term and near-term infants receiving HFV using a lung volume optimisation strategy (Tingay et al. 2013). In this study, frequency and ΔP were held constant throughout a series of P aw changes aimed to, firstly, recruit the lung to near total lung capacity and then identify the closing pressure of the lung and apply ventilation on the deflation limb of the pressure–volume relationship (Tingay et al. 2006). These findings support the observation of Miedema and co-workers (Miedema et al. 2012) that the resultant V THFV and DCO2 relationships with lung volume and P aw were due to changes in Crs (Fig. 13.13). A definitive relationship between volume state of the lung and V THFV or DCO2 could not be demonstrated in every infant, illustrating the limitations of being solely dependent on one independent proxy value of Crs during HFV. It is possible that significant changes in the volume state of the lung may be required to noticeably alter V THFV. Chan et al. (1993) found no change in tidal volume during increases in P aw up to 5 cm H2O above that required during IPPV.

Representative data from a term infant receiving HFV for meconium aspiration syndrome demonstrating the potential of V THFV (a), DCO2 (b) and TcCO2 (c) to identify changes in the volume state of the lung during a series of P aw changes designed to recruit the lung (open diamonds) to near total lung capacity (P max), and then map the deflation limb of the pressure–volume relationship (closed circles) to the closing pressure of the lung. Amplitude and frequency were held constant at all P aw, suggesting that resultant changes in all parameters are due to changes in Crs. All parameters were able to demonstrate improvement after recruitment, possible overdistension near P max and worsening atelectasis once the closing pressure was obtained
Intermittent sampling of the arterial partial pressure of CO2 (PaCO2) is frequently used by clinicians to determine the correct amplitude and frequency during HFV. The relationship between PaCO2 and P aw during HFV is poorly understood. In some cases, no relationship between P aw and PaCO2 could be identified (Slutsky et al. 1981; Wright et al. 1981). In contrast, the presence of hypercarbia is more likely using a P aw that results in overdistension, in both animal models (Mills 2003; Walsh and Carlo 1988; Yamada et al. 1986) and preterm infants (Chan and Greenough 1994). Breen et al. (1984) reported an improvement in arterial partial pressure of PaCO2 at higher P aw in the saline-lavaged lung, presumably due to inadequate recruitment at lower P aw.
Transcutaneous measurement of CO2 (TcCO2) is a commonly used, and reliable, method of monitoring PaCO2 trends, and hence CO2 elimination, during mechanical ventilation in infants (Tingay et al. 2006, 2013). TcCO2 monitoring has been advocated as mandatory during HFV (Froese and Kinsella 2005; van Kaam 2013). In a study of 103 preterm infants receiving HFV for hyaline membrane disease, TcCO2 was found to be 1.2 kPa lower, despite the amplitude and frequency being held constant, after a lung volume optimisation manoeuvre designed to recruit the lung and apply ventilation on the deflation limb of the pressure–volume relationship (De Jaegere et al. 2006). The authors concluded that this difference was due to the improved lung mechanics. The relationship between TcCO2 and the volume state of the lung was also systematically examined in the smaller studies of Miedema and co-workers (Miedema et al. 2012) (preterm infants) and Tingay and co-workers (Tingay et al. 2013) (term infants). In the recruited lung during HFV, the P aw that optimised TcCO2, DCO2 and V THFV has been shown to be closely related to each other and correlates with the lowest P aw that maintain oxygenation and prevent derecruitment (Tingay et al. 2013) (Fig. 13.14). This point of ventilation, which is approximately 2–4 cm H2O above the closing pressure of the lung, is often cited as the optimal P aw to apply HFV (De Jaegere et al. 2006; Rimensberger et al. 2000b). Similar to V THFV, TcCO2 could be used to determine overdistension, collapse and the P aw that optimised ventilation in most, but not all subjects (Tingay et al. 2013). Clearly, the limitations of TcCO2 need to be considered. These findings do support the recommendation that when ‘CO2 elimination is a problem the first action must be to ensure adequate recruitment’ (Froese and Kinsella 2005).

Normalised pressure–volume relationship (black line) from 15 infants during an open lung strategy using HFV, fitted to the sigmoidal relationship described by Venegas et al. The region of the deflation limb encompassing <2 % difference from the maximal SpO2 value (crossed circle) obtained from lung recruitment to maximal P aw is shown with a wide white band. Within this part of the deflation limb, there exists a narrow range of P aw and resultant end-expiratory thoracic volume measured by respiratory inductive plethysmography (V L) (grey filled band) in which transcutaneous partial pressure of carbon dioxide (TcCO2), tidal volume at the airway opening (V Tao), tidal volume measured by respiratory inductive plethysmography (V TRIP) and high-frequency minute volume at the airway opening (MVHF) (circles) were optimised while still maintaining the oxygenation benefit after recruitment to P max. Pressure values for each optimal point are derived from the actual mean P aw data; volume values are derived from the Venegas sigmoidal equation. P final = final P aw obtained (closing pressure) during pressure–volume mapping protocol; P initial = P aw in use prior to open lung manoeuvre; SpO2 = oxygen saturation (Reprinted with permission from Tingay et al. (2013). © 2013 by the Society of Critical Care Medicine and Lippincott Williams and Wilkins)
Essentials to Remember
-
For assessment of disease evolution, dynamic compliance measurements are of limited value, whereas measurements of static respiratory system compliance will give more information.
-
Dynamic compliance measurements during ongoing mechanical ventilation are of limited value; analysis of the shape of the pressure–volume loop is often more helpful for choosing the best ventilator settings.
-
Monitoring dynamic compliance can be helpful for incremental and decremental PEEP titration to find ‘best PEEP’ settings.
-
Additional monitoring to compliance measures like CO2-elimination (DCO2) as a marker of the efficiency of alveolar minute ventilation can be very helpful.
-
Static compliance (Crs) can be used to determine the optimal application of high-frequency ventilation (HFV); however monitoring of static Crs in patients receiving HFV is difficult as it requires cessation removal from tidal ventilation.
-
Monitoring of dynamic Crs is problematic during HFV; however, monitoring of HFV V T (V THFV) at the airway opening could be used, since any change in V THFV would be due to a change in Crs.
-
During HFV the carbon dioxide diffusion coefficient (DCO2) can be used to mathematically describe alveolar ventilation and CO2 elimination. DCO2 is proportional to the product of the frequency and the square of tidal volume (F × V THFV 2).
-
Additional monitoring to indirect compliance measures by V THFV and/or F × V THFV 2 (often labelled as ‘DCO2’ on many HFV-ventilators) is needed during HFV. For this transcutaneous measurement of CO2 (TcCO2) during HFV is a commonly used, and reliable method of monitoring PaCO2 trends, and hence CO2 elimination, during mechanical ventilation in infants.
2 Respiratory System Resistance
Educational Aims
This chapter summarises the methods for the measurement of respiratory resistance in the clinical setting including pitfalls and clinical implications.
2.1 Resistance in Intubated and Non-intubated Patients
Resistance can be regarded as the pressure needed to generate a certain gas flow. It is calculated by the pressure difference divided by the air flow. Respiratory system resistance (R rs) includes the resistances of the airway, lung tissue and the chest wall, and in the intubated child, it will additionally include the resistance of the endotracheal tube (ETT). In the non-intubated patient, the upper airway has a major impact on the respiratory system resistance, particularly in neonates and infants with small upper airway diameter, low upper airway muscle tone and structural instability of cartilaginous tissue. In pre-school children narrowing of the upper airway (e.g. caused by adenotonsillar hypertrophy) is commonly found. However, in an intubated child, the upper airway is bypassed with the ETT thus reducing the upper airway resistance but at the same time adding the resistance of the ETT.
2.2 Confounding Factors for the Measurement of Respiratory Resistance
In order to compare serial measurements, it has to be ensured that all measurements are taken at the same baseline setting with regard to ventilator settings, size and length of the ETT, sedation and other agents administered. For example, sedation and even more so anaesthesia, particularly when muscle relaxants are used, will significantly impact on muscle tone and might also have bronchodilatory effects depending on the agent used (e.g. ketamine, inhalational anaesthetics) altering the resistance measured. Furthermore, the use of an uncuffed ETT is associated with leakage around the ETT which can jeopardise the correct measurement of respiratory mechanics.
2.3 Measurement Methods During Ongoing Mechanical Ventilation
Measurements of respiratory mechanics (R rs and C rs) can be divided into dynamic and passive (static) measurements. While dynamic measurements are taken during the respiratory cycle, the passive measurements are obtained during a brief interruption in the respiratory cycle, during which the respiratory muscles need to be relaxed to allow pressure equilibration. Although both measurements correlate well with each other, the values obtained by the passive technique are higher than those with the dynamic technique (Kugelman et al. 1995).
2.3.1 Passive Measurement of Respiratory Resistance
2.3.1.1 Single-Breath Occlusion Technique
Passive measurements of R rs are based on a number of assumptions (Table 13.1). However, these assumptions have even been questioned not only in the child with lung disease but also in healthy children (American Thoracic Society/European Respiratory Society 1993; Fletcher et al. 1991). Additionally, only larger changes in R rs can be detected since the intra-measurement coefficient of variation is approximately 10 % (Katier et al. 2005).
2.3.2 Measurement Technique
In the intubated child under assisted ventilation, the analysis of airflow, volume and pressure is performed at a time of the breathing cycle when the respiratory muscles are inactive. This is usually achieved by a brief occlusion manoeuvre leading to a short respiratory pause. This causes the activation of stretch receptors in the chest wall leading to a short phase of apnoea and respiratory muscle relaxation. The occlusion manoeuvre stops the airflow thus allowing the pressures to equilibrate. Following complete equilibration, the airway opening pressure reflects the pressure within the alveoli and thus the elastic recoil of the respiratory system.
In the intubated child under controlled mechanical ventilation, passive respiratory mechanics can be determined using a single-breath occlusion, passive-deflation technique (Le Souef et al. 1984, 1986). Measurement of R rs is performed by interrupting airflow close to end-inspiration during mechanical ventilation. It is crucial that the shutter is occluded long enough to obtain a sufficiently long-pressure plateau to allow for equilibration with alveolar pressure.
In both techniques (assisted and controlled ventilation), the resulting passive exhalation is then analysed for flow, relaxation airway pressure and volume to calculate C rs and R rs by drawing a regression line to the linear portion of the curve at a lung volume above FRC. R rs can then be calculated either via the time constant (T rs = R rs × C rs) or by back extrapolating the slope of the linear decay to the point of the release of the occlusion (R rs = change in pressure at airway opening/change in flow). Three to five acceptable manoeuvres are required for a valid analysis (Gappa et al. 2001).
2.3.3 Active Measurements of Respiratory Resistance
2.3.3.1 Mead-Whittenberger Method
The respiratory system can be modelled using a three-element consolidated model consisting of an elastic chamber, a tube acting as a resistance to gas flow and inertia of the mass of the chamber and gas (Heldt 1994). The equation of motion for such a system is as follows:
where P is the pressure that inflates the volume V in the chamber through the inverse of the compliance C. Resistance R relates P to flow while inertia I relates pressure to volume acceleration. The approach of Mead and Whittenberger (Mead and Whittenberger 1953) offers a graphical solution to the equation of motion (Fig. 13.15).

Mead and Whittenberger graphical method of calculating resistance and compliance of the respiratory system. Lung volume is plotted against transpulmonary pressure. Dynamic compliance is derived as the slope of line AC. Dynamic resistance is calculated as the pressure drop due to resistance at midtidal volume between points B and D divided by the absolute sum of the inspiratory and expiratory flows at points B and D
The authors assumed that (a) changes in transpulmonary pressure at zero flow (i.e. at end-inspiration and at end-expiration) are due only to elastic recoil, that (b) the change in transpulmonary pressure between inspiration and expiration at midtidal volume are due only to viscous forces and that (c) contribution of inertia to the total change in transpulmonary pressure is not relevant. Accepting these assumptions, terms one and two on the right side of Eq. 13.1 are equal to zero and term three was ignored in their analysis. Newer types of ventilators offer measurements of dynamic resistance (R e) and compliance (C dyn), mostly based on the Mead and Whittenberger method. Although such an approach provides non-invasive measurements of R e that can be clinically useful for monitoring of changes in R e over time, one needs to be aware that R e is assumed to be constant within each breath (i.e. dynamic changes of R e within the respiratory cycle cannot be detected) and that its estimates are based on only two points within the respiratory cycle.
2.3.3.2 Multiple Linear Regression Method
Multiple linear regression (MLR) analysis of pressure, flow and volume signals allows for computerised evaluation of R e. Data are sampled continuously throughout each breath; thus, the equation of motion can be solved using a least squares fit (Lanteri et al. 1995; Nicolai et al. 1991). The advantage of this method is its independency of any particular flow waveform pattern and the potential to calculate R e for inspiration and expiration separately; however, R e values will vary with lung volume (Rousselot et al. 1992). Additionally, the MLR method is susceptible to errors caused by offsets in baseline flow and requires zero flow correction (Peslin et al. 1994). For a more detailed discussion of the MLR method, refer to Chap. 11.5.6 and 11.8.2.
2.3.3.2.1 Dynamic Bedside Assessment
During volume-controlled ventilation, R e can be approximated by deducting the plateau pressure from the peak inspiratory pressure during a respiratory pause in the ventilator settings or a ventilator hold manoeuvre (Fig. 13.16):

Pressure–time curve during volume-controlled ventilation allowing the approximation of respiratory resistance by dividing the pressure difference (peak airway pressure − plateau pressure) by the airflow
2.4 Clinically Important Implications
2.4.1 Measurement of Resistance to Guide Ventilation Strategies
To our knowledge, the measurement of resistance has not been shown to improve outcome of patients. However, since R e values are readily available on most modern intensive care ventilators, passive measurements of R rs are rarely used in routine clinical practice.
In case of high R rs due to air flow limitation of lower airways (e.g. asthma), increasing the respiratory rate is associated with a shortening of the expiratory time and might therefore cause additional air trapping and thus intrinsic PEEP. Consecutively, this can lead to dynamic hyperinflation with deleterious hemodynamic compromise and shock and/or volutrauma (refer also to Chap. 11.5.3 and 8.1.3.5.4.1).
The principal aim of ventilator settings is to allow for an adequate expiratory time thus allowing prolonged expiration. The optimal inspiratory time is the value at which target tidal volume is met. High-inspiratory peak flow leads to an increase in R rs and therefore a reduction in tidal volume, while low-inspiratory peak flow either leads to decreased tidal volume or, if inspiratory and expiratory time are coupled, to a shortened expiratory time and consecutively to an increase in intrinsic PEEP (Marik et al. 2002). Tidal volumes should therefore be reduced to the lowest values that allow adequate CO2 removal without an increase of the intrinsic PEEP (Oddo et al. 2006). Finally, airway pressures may have to be higher than normal since they will not represent alveolar pressure in the case of high R rs.
To avoid volutrauma, volume-controlled ventilation modes are often applied using low tidal volumes. However, R rs increases with a decrease in lung volume due to collapse of the bronchiole, while increases in lung volume are commonly associated with a decrease in R rs due to the increase in size of the bronchi.
With regard to PEEP strategy, extrinsic PEEP adjusted on the ventilator needs to be higher than intrinsic PEEP to facilitate sufficient air flow. This allows for adequate expiration as well as reliable triggering of the ventilator, particularly in patients with severe airway obstruction and hyperinflation.
2.4.2 Monitoring of Progression of Disease and Response to Treatment
Clinically, an increase in R e often correlates with soft tissue retractions, contraction of auxiliary respiratory muscles and active contraction of abdominal muscles during expiration. Mechanical ventilation in the presence of obstructive airway disease is always challenging. Monitoring of R e during mechanical ventilation offers the possibility to detect changes in R e indicating ETT obstruction or dislocation towards the carina and worsening of disease in terms of development of significant airflow obstruction, such as in infants with evolving BPD, meconium aspiration syndrome or bronchiolitis. A decrease in R e as a response to bronchodilator treatment usually indicates a positive therapeutic effect. However, treatment response may be masked by decreased lung volume in patients with airway obstruction and established hyperinflation. In these patients, bronchodilator treatment may decrease FRC, potentially resulting in elevated R e caused by the loss in lung volume. Longer-term changes in R e due to progression of disease may guide the clinician in changes to ventilatory management, e.g. an increase in R e in infants with evolving BPD may prompt caregivers to consider re-evaluate current ventilation strategy in order to ensure appropriate expiratory time, PEEP and lung volume.
Notes
- 1.
Some commercially available ventilators use the term high-frequency minute ventilation (MVHFV). This is interchangeable with DCO2.
References
Adams AB, Cakar N, Marini JJ (2001) Static and dynamic pressure-volume curves reflect different aspects of respiratory system mechanics in experimental acute respiratory distress syndrome. Respir Care 46(7):686–693
American Thoracic Society/European Respiratory Society (1993) Respiratory mechanics in infants: physiologic evaluation in health and disease. Am Rev Respir Dis 147:474–496
Berger TM, Stocker M (2004) [Ventilation of newborns and infants]. Anaesthesist 53(8):690–701
Bond DM, Froese AB (1993) Volume recruitment maneuvers are less deleterious than persistent low lung volumes in the atelectasis-prone rabbit lung during high-frequency oscillation. Crit Care Med 21(3):402–412
Bone RC (1976) Diagnosis of causes for acute respiratory distress by pressure-volume curves. Chest 70(6):740–746
Boynton BR, Hammond MD, Fredberg JJ, Buckley BG, Villanueva D, Frantz ID III (1989) Gas exchange in healthy rabbits during high-frequency oscillatory ventilation. J Appl Physiol 66(3):1343–1351
Breen PH, Ali J, Wood LD (1984) High-frequency ventilation in lung edema: effects on gas exchange and perfusion. J Appl Physiol 56(1):187–195
Byford LJ, Finkler JH, Froese AB (1988) Lung volume recruitment during high-frequency oscillation in atelectasis-prone rabbits. J Appl Physiol 64(4):1607–1614
Chan V, Greenough A (1994) The effect of frequency on carbon dioxide levels during high frequency oscillation. J Perinat Med 22(2):103–106
Chan V, Greenough A, Milner AD (1993) The effect of frequency and mean airway pressure on volume delivery during high-frequency oscillation. Pediatr Pulmonol 15(3):183–186
Chang HK (1984) Mechanisms of gas transport during ventilation by high-frequency oscillation. J Appl Physiol 56(3):553–563
Courtney SE, Weber KR, Spohn WA, Malin SW, Bender CV, Gotshall RW (1990) Measurement of tidal volume using a pneumotachometer during high-frequency oscillation. Crit Care Med 18(6):651–653
D’Angelo E, Prandi E, Tavola M, Calderini E, Milic-Emili J (1994) Chest wall interrupter resistance in anesthetized paralyzed humans. J Appl Physiol 77(2):883–887
De Jaegere A, van Veenendaal MB, Michiels A, van Kaam AH (2006) Lung recruitment using oxygenation during open lung high-frequency ventilation in preterm infants. Am J Respir Crit Care Med 174(6):639–645
Dimitriou G, Greenough A, Kavvadia V, Laubscher B, Milner AD (1998) Volume delivery during high frequency oscillation. Arch Dis Child Fetal Neonatal Ed 78(2):F148–F150
Escolar JD, Escolar A (2004) Lung hysteresis: a morphological view. Histol Histopathol 19(1):159–166
Escolar JD, Escolar MA, Guzman J, Roques M (2002) Pressure volume curve and alveolar recruitment/de-recruitment. A morphometric model of the respiratory cycle. Histol Histopathol 17(2):383–392
Falke KJ, Pontoppidan H, Kumar A, Leith DE, Geffin B, Laver MB (1972) Ventilation with end-expiratory pressure in acute lung disease. J Clin Invest 51(9):2315–2323
Fletcher ME, Stack C, Ewart M, Davies CJ, Ridley S, Hatch DJ, Stocks J (1991) Respiratory compliance during sedation, anesthesia, and paralysis in infants and young children. J Appl Physiol 70:1977–1982
Froese AB (1997) High-frequency oscillatory ventilation for adult respiratory distress syndrome: let’s get it right this time! Crit Care Med 25(6):906–908
Froese AB, Kinsella JP (2005) High-frequency oscillatory ventilation: lessons from the neonatal/pediatric experience. Crit Care Med 33(3 Suppl):S115–S121
Gappa M, Colin AA, Goetz I, Stocks J (2001) ERS/ATS Task Force on standards for infant respiratory function testing. European Respiratory Society/American Thoracic Society. Passive respiratory mechanics: the occlusion techniques. Eur Respir J 17:141–148
Gattinoni L, Pesenti A, Caspani ML, Pelizzola A, Mascheroni D, Marcolin R et al (1984) The role of total static lung compliance in the management of severe ARDS unresponsive to conventional treatment. Intensive Care Med 10(3):121–126
Gattinoni L, Pelosi P, Suter PM, Pedoto A, Vercesi P, Lissoni A (1998) Acute respiratory distress syndrome caused by pulmonary and extrapulmonary disease. Different syndromes? Am J Respir Crit Care Med 158(1):3–11
Gerstmann DR, Fouke JM, Winter DC, Taylor AF, de Lemos RA (1990) Proximal, tracheal, and alveolar pressures during high-frequency oscillatory ventilation in a normal rabbit model. Pediatr Res 28(4):367–373
Goddon S, Fujino Y, Hromi JM, Kacmarek RM (2001) Optimal mean airway pressure during high-frequency oscillation: predicted by the pressure-volume curve. Anesthesiology 94(5):862–869
Hager DN, Fuld M, Kaczka DW, Fessler HE, Brower RG, Simon BA (2006) Four methods of measuring tidal volume during high-frequency oscillatory ventilation. Crit Care Med 34(3):751–757
Hager DN, Fessler HE, Kaczka DW, Shanholtz CB, Fuld MK, Simon BA et al (2007) Tidal volume delivery during high-frequency oscillatory ventilation in adults with acute respiratory distress syndrome. Crit Care Med 35(6):1522–1529
Hammer J, Numa A, Newth CJ (1998) Total lung capacity by N2 washout from high and low lung volumes in ventilated infants and children. Am J Respir Crit Care Med 158(2):526–531
Hatcher D, Watanabe H, Ashbury T, Vincent S, Fisher J, Froese A (1998) Mechanical performance of clinically available, neonatal, high-frequency, oscillatory-type ventilators. Crit Care Med 26(6):1081–1088
Heldt GP (1994) The mechanics of breathing: developmental aspects and practical applications. In: Boynton BR, Carlo WA, Jobe AH (eds) New therapies for neonatal respiratory failure: a physiological approach, 1st edn. Cambridge University Press, Cambridge
Henzler D, Pelosi P, Dembinski R, Ullmann A, Mahnken AH, Rossaint R et al (2005) Respiratory compliance but not gas exchange correlates with changes in lung aeration after a recruitment maneuver: an experimental study in pigs with saline lavage lung injury. Crit Care 9:R471–R482
Hermle G, Mols G, Zugel A, Benzing A, Lichtwarck-Aschoff M, Geiger K et al (2002) Intratidal compliance-volume curve as an alternative basis to adjust positive end-expiratory pressure: a study in isolated perfused rabbit lungs. Crit Care Med 30(7):1589–1597
Hickling KG (2001) Best compliance during a decremental, but not incremental, positive end-expiratory pressure trial is related to open-lung positive end-expiratory pressure: a mathematical model of acute respiratory distress syndrome lungs. Am J Respir Crit Care Med 163(1):69–78
Jonson B, Richard JC, Straus C, Mancebo J, Lemaire F, Brochard L (1999) Pressure-volume curves and compliance in acute lung injury: evidence of recruitment above the lower inflection point. Am J Respir Crit Care Med 159(4 Pt 1):1172–1178
Kamitsuka MD, Boynton BR, Villanueva D, Vreeland PN, Frantz ID III (1990) Frequency, tidal volume, and mean airway pressure combinations that provide adequate gas exchange and low alveolar pressure during high frequency oscillatory ventilation in rabbits. Pediatr Res 27(1):64–69
Karason S, Sondergaard S, Lundin S, Wiklund J, Stenqvist O (2000) Evaluation of pressure/volume loops based on intratracheal pressure measurements during dynamic conditions. Acta Anaesthesiol Scand 44(5):571–577
Katier N, Uiterwaal CS, de Jong BM, Kimpen JL, van der Ent CK (2005) Feasibility and variability of neonatal and infant lung function measurement using the single occlusion technique. Chest 128:1822–1829
Kugelman A, Keens TG, deLemos R, Durand M (1995) Comparison of dynamic and passive measurements of respiratory mechanics in ventilated newborn infants. Pediatr Pulmonol 20:258–264
Lachmann B, Berggren P, Curstedt T, Grossmann G, Robertson B (1982) Combined effects of surfactant substitution and prolongation of inspiration phase in artificially ventilated premature newborn rabbits. Pediatr Res 16(11):921–927
Lanteri CJ, Kano S, Nicolai T, Sly PD (1995) Measurement of dynamic respiratory mechanics in neonatal and pediatric intensive care: the multiple linear regression technique. Pediatr Pulmonol 19:29–45
Le Souef PN, England SJ, Bryan AC (1984) Passive respiratory mechanics in newborns and children. Am Rev Respir Dis 129:552–556
Le Souef PN, Hughes DM, Landau LI (1986) Effect of compression pressure on forced expiratory flow in infants. J Appl Physiol 61:1639–1646
Lu Q, Vieira SR, Richecoeur J, Puybasset L, Kalfon P, Coriat P et al (1999) A simple automated method for measuring pressure-volume curves during mechanical ventilation. Am J Respir Crit Care Med 159(1):275–282
Maggiore SM, Richard JC, Brochard L (2003) What has been learnt from P/V curves in patients with acute lung injury/acute respiratory distress syndrome. Eur Respir J Suppl 42:22s–26s
Maisch S, Reissmann H, Fuellekrug B, Wiesmann D, Rutkowski T, Tusman G et al (2008) Compliance and dead space fraction indicate an optimal level of positive end-expiratory pressure after recruitment in anesthetized patients. Crit Care Trauma 106(1):175–181
Marik PE, Varon J, Fromm R Jr (2002) The management of acute severe asthma. J Emerg Med 23:257–268
Matamis D, Lemaire F, Harf A, Brun-Buisson C, Ansquer JC, Atlan G (1984) Total respiratory pressure-volume curves in the adult respiratory distress syndrome. Chest 86(1):58–66
McCulloch PR, Forkert PG, Froese AB (1988) Lung volume maintenance prevents lung injury during high frequency oscillatory ventilation in surfactant-deficient rabbits. Am Rev Respir Dis 137(5):1185–1192
Mead J, Whittenberger JL (1953) Physical properties of human lungs measured during spontaneous respiration. J Appl Physiol 5:779–796
Miedema M, de Jongh FH, Frerichs I, van Veenendaal MB, van Kaam AH (2012) The effect of airway pressure and oscillation amplitude on ventilation in pre-term infants. Eur Respir J 40(2):479–484
Mills JF (2003) Optimising mean airway pressure during high frequency oscillatory ventilation. University of Melbourne, Melbourne
Nicolai T, Lanteri C, Freezer N, Sly PD (1991) Non-invasive determination of alveolar pressure during mechanical ventilation. Eur Respir J 4:1275–1283
Oddo M, Feihl F, Schaller MD, Perret C (2006) Management of mechanical ventilation in acute severe asthma: practical aspects. Intensive Care Med 232:501–510
Peslin R, Gallina C, Saunier C, Duvivier C (1994) Fourier analysis versus multiple linear regression to analyse pressure-flow data during artificial ventilation. Eur Respir J 7:2241–2245
Pfenninger J, Aebi C, Bachmann D, Wagner BP (1992) Lung mechanics and gas exchange in ventilated preterm infants during treatment of hyaline membrane disease with multiple doses of artificial surfactant (Exosurf). Pediatr Pulmonol 14(1):10–15
Pillow JJ, Sly PD, Hantos Z, Bates JH (2002) Dependence of intrapulmonary pressure amplitudes on respiratory mechanics during high-frequency oscillatory ventilation in preterm lambs. Pediatr Res 52(4):538–544
Pillow JJ, Sly PD, Hantos Z (2004) Monitoring of lung volume recruitment and derecruitment using oscillatory mechanics during high-frequency oscillatory ventilation in the preterm lamb. Pediatr Crit Care Med 5(2):172–180
Ranieri VM, Giuliani R, Fiore T, Dambrosio M, Milic-Emili J (1994) Volume-pressure curve of the respiratory system predicts effects of PEEP in ARDS: “occlusion” versus “constant flow” technique. Am J Respir Crit Care Med 149(1):19–27
Ranieri VM, Zhang H, Mascia L, Aubin M, Lin CY, Mullen JB et al (2000) Pressure–time curve predicts minimally injurious ventilatory strategy in an isolated rat lung model. Anesthesiology 93(5):1320–1328
Rimensberger PC, Bryan AC (1999) Measurement of functional residual capacity in the critically ill. Relevance for the assessment of respiratory mechanics during mechanical ventilation. Intensive Care Med 25(5):540–542
Rimensberger PC, Cox PN, Frndova H, Bryan AC (1999) The open lung during small tidal volume ventilation: concepts of recruitment and “optimal” positive end-expiratory pressure. Crit Care Med 27(9):1946–1952
Rimensberger PC, Pache JC, McKerlie C, Frndova H, Cox PN (2000a) Lung recruitment and lung volume maintenance: a strategy for improving oxygenation and preventing lung injury during both conventional mechanical ventilation and high-frequency oscillation. Intensive Care Med 26(6):745–755
Rimensberger PC, Beghetti M, Hanquinet S, Berner M (2000b) First intention high-frequency oscillation with early lung volume optimization improves pulmonary outcome in very low birth weight infants with respiratory distress syndrome. Pediatrics 105(6):1202–1208
Rossing TH, Slutsky AS, Lehr JL, Drinker PA, Kamm R, Drazen JM (1981) Tidal volume and frequency dependence of carbon dioxide elimination by high-frequency ventilation. N Engl J Med 305(23):1375–1379
Rouby JJ, Lu Q, Goldstein I (2002) Selecting the right level of positive end-expiratory pressure in patients with acute respiratory distress syndrome. Am J Respir Crit Care Med 165(8):1182–1186
Rousselot JM, Peslin R, Duvivier C (1992) Evaluation of the multiple linear regression method to monitor respiratory mechanics in ventilated neonates and young children. Pediatr Pulmonol 13:161–168
Scalfaro P, Pillow JJ, Sly PD, Cotting J (2001) Reliable tidal volume estimates at the airway opening with an infant monitor during high-frequency oscillatory ventilation. Crit Care Med 29(10):1925–1930
Slutsky AS, Kamm RD, Rossing TH, Loring SH, Lehr J, Shapiro AH et al (1981) Effects of frequency, tidal volume, and lung volume on CO2 elimination in dogs by high frequency (2–30 Hz), low tidal volume ventilation. J Clin Invest 68(6):1475–1484
Stahl CA, Moller K, Schumann S, Kuhlen R, Sydow M, Putensen C et al (2006) Dynamic versus static respiratory mechanics in acute lung injury and acute respiratory distress syndrome. Crit Care Med 34(8):2090–2098
Stocks J, Sly PD, Tepper RS, Morgan DL (1996) Infant respiratory function testing. Wiley-Liss, New York
Suarez-Sipmann F, Bohm SH, Tusman G, Pesch T, Thamm O, Reissmann H et al (2007) Use of dynamic compliance for open lung positive end-expiratory pressure titration in an experimental study. Crit Care Med 35(1):214–221
Suter PM, Fairley B, Isenberg MD (1975) Optimum end-expiratory airway pressure in patients with acute pulmonary failure. N Engl J Med 292(6):284–289
Suter PM, Fairley HB, Isenberg MD (1978) Effect of tidal volume and positive end-expiratory pressure on compliance during mechanical ventilation. Chest 73:158–162
Sydow M, Burchardi H, Zinserling J, Ische H, Crozier TA, Weyland W (1991) Improved determination of static compliance by automated single volume steps in ventilated patients. Intensive Care Med 17(2):108–114
Sydow M, Burchardi H, Zinserling J, Crozier TA, Denecke T, Zielmann S (1993) Intrinsic PEEP determined by static pressure-volume curves–application of a novel automated occlusion method. Intensive Care Med 19(3):166–171
Tingay DG, Mills JF, Morley CJ, Pellicano A, Dargaville PA (2006) The deflation limb of the pressure-volume relationship in infants during high-frequency ventilation. Am J Respir Crit Care Med 173(4):414–420
Tingay DG, Mills JF, Morley CJ, Pellicano A, Dargaville PA (2013) Indicators of optimal lung volume during high-frequency oscillatory ventilation in infants*. Crit Care Med 41(1):232–239
Tooley WH, Clements JA, Muramatsu K, Brown CL, Schlueter MA (1987) Lung function in prematurely delivered rabbits treated with a synthetic surfactant. Am Rev Respir Dis 136(3):651–656
van Kaam AH (2013) Bedside parameters to optimize lung volume during high-frequency oscillatory ventilation. Crit Care Med 41(1):365–366
Walsh MC, Carlo WA (1988) Sustained inflation during HFOV improves pulmonary mechanics and oxygenation. J Appl Physiol 65(1):368–372
Watson JW, Jackson AC (1984) CO2 elimination as a function of frequency and tidal volume in rabbits during HFO. J Appl Physiol 57(2):354–359
Wood B, Karna P, Adams A (2002) Specific compliance and gas exchange during high-frequency oscillatory ventilation. Crit Care Med 30(7):1523–1527
Wright K, Lyrene RK, Truog WE, Standaert TA, Murphy J, Woodrum DE (1981) Ventilation by high-frequency oscillation in rabbits with oleic acid lung disease. J Appl Physiol 50(5):1056–1060
Yamada Y, Venegas JG, Strieder DJ, Hales CA (1986) Effects of mean airway pressure on gas transport during high-frequency ventilation in dogs. J Appl Physiol 61(5):1896–1902
Zimova-Herknerova M, Plavka R (2006) Expired tidal volumes measured by hot-wire anemometer during high-frequency oscillation in preterm infants. Pediatr Pulmonol 41(5):428–433
Author information
Authors and Affiliations
Corresponding author
Editor information
Editors and Affiliations
Rights and permissions
Copyright information
© 2015 Springer-Verlag Berlin Heidelberg
About this chapter
Cite this chapter
Rimensberger, P.C., Schulzke, S.M., Tingay, D., von Ungern-Sternberg, B.S. (2015). Monitoring of the Mechanical Behaviour of the Respiratory System During Controlled Mechanical Ventilation. In: Rimensberger, P. (eds) Pediatric and Neonatal Mechanical Ventilation. Springer, Berlin, Heidelberg. https://doi.org/10.1007/978-3-642-01219-8_13
Download citation
DOI: https://doi.org/10.1007/978-3-642-01219-8_13
Published:
Publisher Name: Springer, Berlin, Heidelberg
Print ISBN: 978-3-642-01218-1
Online ISBN: 978-3-642-01219-8
eBook Packages: MedicineMedicine (R0)