
Abstract
Many studies on distance perception in a virtual environment exist. Most of them were conducted using head-mounted displays (HMD) and less with large screen displays such as CAVE systems. In this paper, we propose to measure the accuracy of perceived distances in a virtual space ranging from 0 to 15 m in a CAVE system compared to an HMD. Eight subjects with different vision performances took part in an experiment. Results show that the HMD provides the best results for distances above 8 m while the CAVE provides the best results for close distances.
Access provided by CONRICYT-eBooks. Download conference paper PDF
Keywords
1 Introduction
Since a couple of years, Virtual Reality (VR) is more and more used in several domains some of which are: health industry (to treat phobias or in surgeon simulation), entertainment (video games, advertisement, tele-immersion), automotive and aerospace industries (driving simulations, numerical layouts visualization and virtual prototyping), preservation of culture heritage (historical places and old building reconstruction), scientific visualization (meteorology, architecture, urbanism), and in dangerous business sectors like chemical or nuclear industries.
The goal of VR technologies is to get a perceptual approximation of future environments that is as close as possible to reality, so that rapid comparison and iteration can be performed before concretization of the products or the services. However, when using VR systems, a problem arises. Past work showed that distances are misperceived in virtual environments; more precisely, they are underestimated [17].
In this paper, we propose to study the accuracy of two VR display systems in restituting distances. Though most of past work conducted studies with HMDs, we propose here to compare between a CAVE system and an HMD. We measure the standard deviation between the distance of a virtual object as supposed by observers and the real distance, called here a reference distance. We investigate how this deviation evolves with the distance for each of the VR systems.
The paper is organized as follows. In the next section, we present a literature review on previous work dealing with distance estimation, then in Sect. 3, we present the user study we made comparing a CAVE system and an HMD. We then expose the results and discuss them.
2 Previous Work
2.1 Distance Estimation
To find the spatial position of a virtual object, our visual system relies on the distance and on depth indicators available within a virtual scene. Ten depth indicators are usually available: binocular disparity, adjustment, convergence, motion parallax, aerial and linear perspective [9], occlusion, size of the field of view, shadows and textures [7]. For both the real and the virtual environments, distances always influence these depth indicators.
Numerous past studies showed that estimated distances in virtual environments are compressed (underestimated) [14, 17, 27], with the underestimation increasing with the distance [2]. Whereas in real environments, distance estimation is fairly accurate [26]. The reasons for this phenomenon are multiple and different.
Past studies reported the display system to have the most significant role in the compression phenomenon, and not the image quality, as previously thought [24]. Among the factors contributing to the limitation of the display system, we mention: the vergence - accommodation conflict, the image quality, the light and dimension of the field of view (FOV), motion parallax.
In a real environment, vergence and accommodation will target the same point. In a virtual environment, on the contrary, vergence and accommodation will dissociate in two different points. This well-known vergence - accommodation conflict results in headaches after a long period of use [8].
The importance of the FOV in distance estimation has been widely studied in previous studies. Especially these have shown that the size of the FOV in a real environment is decisive in distance estimation. For example, a vertically limited FOV (21° or less) leads to an underestimation in a real environment [29] and to the degradation of some distance indicators (linear perspective and relative dimension) [28]. However, in an HMD, it has been shown that for medium distances (from 2 to 15 m) a vertically limited FOV does not influence the observers’ appreciation regarding absolute distances estimation [12].
Even though the FOV is not such an important factor in absolute distance estimation, together with others factors (inertia, weight of the HMD), it can contribute to compression appreciations in virtual environments [25], influencing the observers perception [19].
Presence is also a source of misperception of distances [23]. Indeed, perceiving both the real and virtual environments as being different may induce a lack of presence, which will affect distance perception [10]. Therefore, to reduce the source of compression, the effect of high fidelity of virtual immersive environments has been studied, showing very good results in absolute distances estimation (around 95%). Also, distance compression can be reduced if those distances are well known (that means distance underestimation is not necessarily defined by the used technology) [10].
Mohler et al. showed that using a precise avatar instead of an own observer image/body will lead to a smaller number of errors when absolute distances are estimated [18].
In HMD systems, observers are totally shielded from the real environment. Whereas these systems allow increased presence and interaction with the virtual world, past research on absolute distance perception using HMDs showed an important underestimation (than can be up to 50%) in certain situations (depending on the immersive systems used, the textures, the quality of the system parameters) [14]. However, recently launched HMDs showed much less severe distance underestimation [11], as they provide much higher image resolution.
With large screens displays, despite fewer literature, distance estimations are found to be more accurate compared to HMDs, though distances are still underestimated [6, 21]. Piryankova et al. found similar results but they identified an effect of stereoscopy on distance perception [20]. Marsh et al. showed that observers use physical cues, more specifically the physical boundaries of the CAVE, to estimate distances, however still underestimating them [15]. Bruder et al. studied the effect of parallax on distance perception in a CAVE system [1]. They showed that distance perception is more accurate when target objects are in front of the screen or at screen-depth.
Dorado et al. presented a study comparing a low cost HMD and a CAVE system to select the best opera seat [3]. In this study, observers had to select the best seat in an opera theater from their point of view based on the view to the scene and on auditory considerations. Results showed that observers’ decisions were not substantially affected by the display system; however their performance judgment could be affected by the display factors.
Examples of comparison between a CAVE system and an HMD are still rare in the literature (most of past work concentrate on one system at a time but do not compare both of them together). We propose here to fill this gap.
2.2 Evaluation Methods
Several evaluation methods for distance estimation have been used in past work: verbal estimation, perceptive adjustment or measurement based on motor behaviors (blind walking, triangulation). However, the choice of the method may influence results [22].
The simplest method to evaluate distance perception is verbal estimation, where observers stand still within the virtual environment and just estimate the distances counting certain measurement units or using the size of a virtual object to measure a specific distance (for example [20]). Obviously, it is widely accepted that this method is less accurate than measurements based on motor behavior (action-based metrics) [14].
Another static method based on visual perception is the distance bisection method. Observers must, using a joystick, find the middle point on the distance between them and the target [16].
Blindfolded walking is an action-based method requiring observers to go to the target, blindfolded [10, 26]. This method was demonstrated to be useful for distances below 20 m, otherwise distances were strongly underestimated.
Another action-based method is triangulated walking, where observers have to go to the target seen before. This method was shown to be well suited for long distances [4]. Perception adjustment is another motor-based technique to evaluate distances. Observers estimate distances by moving the target object to the expected right position. Adjustment is done manually, however recent work proposed a correction algorithm for HMDs allowing users to maintain the distance perception equal in both the real and the virtual spaces [30].
Here we select evaluation methods that can comply with the VR systems we want to use, namely an HMD and a CAVE. Because the CAVE does not allow for large displacements, we choose the perception adjustment method.
3 User Study
3.1 Problem Definition
Consider in a virtual environment an object is located at a reference distance Dref to the observer, the problem is to determine the minimal distances d+ and d− leading to the detection of differences in the depth (Fig. 1). The distances Dref + d+ and Dref − d− are the planar coordinates of the object found by the subjects while adjusting their view. The theoretical objective is to measure d+ and d− for several values of Dref.

Representation of the reference distance Dref, d+ and d− (left) and different values of the reference distance (right).
Determining d+ and d− will offer a global idea on the smoothness of the space representation within the virtual environment. Recall that the appreciations on observed distances are smaller in VR than in the real world and this compression increases with the distance. Therefore studying d+ and d− will allow understanding this evolution as a function of the distance.
After several trials, this evolution will be plotted to visualize and compare the results for both VR systems (HMD and CAVE). This will represent an important indicator regarding the systems capabilities to offer an accurate measured depth.
3.2 Experimental Conditions
We used a four-sided CAVE system (vertical screens: 2.74 × 3.00 m; ground screen: 3 × 3 m). The images are produced at a 60 Hz frame rate by eight Projection Design F30 video-projectors, two for each screen (one for each eye) with a resolution of 1160 × 1050 pixels per side. Passive technology is used for stereoscopy and an ART tracking system is used to track the subjects.
Regarding the HMD, we used a VFX 3D HMD that can have a resolution up to 1600 × 1200 pixels (64 frames/sec). Note that though this HMD does not offer today’s available HMDs capabilities, it allows to compare more easily with the CAVE as the image quality is close. No tracking of the subjects were performed to simplify the setup. A small calibration was made, in order to establish the eye position of each subject, as past literature showed HMD calibration to have an effect on distance estimation [13].
To interact with the virtual environment, a Flystick is used in the CAVE while a keyboard is used with the HMD.
To avoid any biases during the experiment, head movements are not allowed either in the CAVE, either in the HMD, while vergence is accepted. Also, a head support was designed ensuring the subjects do not use motion parallax during the experiment in the CAVE. The subjects are therefore asked to put their head on it all along the experiment in the CAVE. Also, as no tracking is used in the HMD, this support allows reproducing the same eye position in the CAVE as in the HMD. Figure 2 shows the design of the head support, where θ is the deflection angle, H the eye position, and h the cube position on the vertical axis. These dimensions are used to calculate the absolute distance from the subject eyes to the virtual cube displayed in the virtual space. The deflection angle can be used to calculate the absolute distance when h is a known parameter. Modifying this variable can also alter the perceived distance for the objects in the virtual/real environment [5, 19].

Variables used to calculate the absolute distance to the cube (left) and position of the head support (right).
The virtual environment is composed of a corridor, with many visual cues regarding distances (linear perspective, relative size, light, etc.). The environment is textured to provide more realistic conditions to subjects, however, studying the influence of the textures will be beyond the scope of this paper.
For the experimental study, eight subjects (two women and six men) participated on a voluntary basis. They were asked to perform with each visualization system distance estimation for the five different reference distances shown in Fig. 1 right and 20 times for each distance. The distances were displayed in a random order. After each series of tests, the subjects took a small break. The subjects performed the experiment seated.
Before and after the experiment, the subjects had to fill two questionnaires: the first one related to issues and performance of their vision system and to previous experiences in VR, while the second one was related to technical aspects such as immersive visualization and virtual interaction.
3.3 Experimental Protocol
For each test, the subjects performed the following steps:
-
1.
Preparation: the subject visualizes the target (a blue cube) placed exactly in front of him (the initial position of the cube) (Fig. 3, left). In order to move the cube, the subject must press the trigger button of the Flystick (in the CAVE mode) or press the Space key of a keyboard when the HMD system is used.
Fig. 3. 
The initial position of the cube in the virtual space (left) and its final position (right). (Color figure online)
-
2.
Learning: the blue cube is automatically moved instantly from its initial position to the final one (one of the reference distances, Fig. 3, right). The subject sees the cube position for only two seconds. Then, the cube disappears and reappears at its initial position. At this point, to facilitate the understanding of the distance between the start and the end positions, the subject can see the first reference distance (Dref.perc) that is an internal representation of Dref (Dref.perc = f (Dref)) (Fig. 4, left).
Fig. 4. 
Representation of the internal processes during the learning phase (left), during the adjustment phase (middle) and after the adjustment phase (right).
-
3.
Adjustment: the subject is asked to reproduce the reference distance as learned in the previous phase. To set the cube position, the subject can use the grid displayed on the floor. In order to see much better the grid, the position of the object is set at a height of 0.5 m from the floor. Using the Flystick in the CAVE or the keyboard for the HMD, the subject moves the cube toward the final position. The supposed final position is validated by pushing the trigger button of the Flystick or twice on the <Space> key. The adjustment is done when the perceived distance D′perc is equal to the memorized reference distance (Dref.perc) (Fig. 4, middle). After adjusting the distance, the subject takes the reproduced distance Dreprod as being equal to Dref (Dreprod = Dref). More precisely, the perceived distance is equal to the perceived reference distance Dreprod.perc = Dref.perc. As we propose to characterize the distance perception by the visual system, we get Dreprod.perc = f (Dreprod). Also, we have f (Dreprod) = f (Dref), therefore, by simplifying, we have Dreprod = Dref (Fig. 4, right).
-
4.
Data recording: all the data from the subjects’ performance are recorded.
Figure 5 shows the two conditions as performed by the subjects.
Fig. 5. 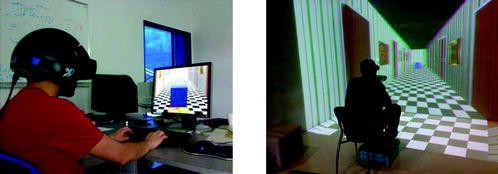
Tests with the HMD (left) and the CAVE system (right).


3.4 Hypothesis
For each test, a standard deviation σ is calculated in order to establish the dispersion of the reproduced distances Dreprod depending on the reference distance Dref. We make the following hypotheses:
-
1.
the dispersion of the standard deviation is wider in the HMD than in the CAVE system (Fig. 6), meaning that the CAVE allows more accurate estimations than with the HMD.
Fig. 6. 
Evolution of the dispersion for both the CAVE and the HMD systems.
-
2.
the dispersion of the standard deviation as a function of the reference distance increases following a power law, for example Weber’s law, with the following relation (Fig. 7):
Fig. 7. 
Evolution of the data dispersion depending on Dref for all three values of β.
$$ \sigma \left( {D_{ref} } \right) = k \cdot D_{ref}^{\beta } $$(1)


4 Results
For each subject, the standard deviation σ was calculated as follows:
where N denotes the number of tests. The reproduced distances were grouped depending on Dref. On the same graph, for each subject, we plotted the results in each condition (CAVE and HMD). We can therefore find which distance indicator globally influences the accuracy of the perceived distances. Figure 8 shows the results for all eight subjects. Table 1 summarizes the analysis of the results from Fig. 8.

Repartition of the standard deviation depending on the reference distance for both immersion systems for each subject.
Figure 9 presents the average standard deviations versus the reference distances. We conducted a statistical analysis to determine whether the display system had an influence on distance perception. A t-test did not return a significant difference for any of the reference distances.

Average standard deviations versus reference distances (for both immersive systems).
5 Discussion and Conclusions
Our goal was to measure the precision of the perceived distances in a 3D virtual environment displayed in different systems: a CAVE and an HMD. Past research has assumed that the deviation increases with distances. Excepting few situations, our study follows these findings.
For the distance range (5…10 m), dispersion curves respect Weber’s law. The study of the standard deviation values for each distance range revealed that the dispersion increases with the increase of Dref (especially for closer distances, 2…3 m).
Recalling the first hypothesis, it was estimated that the subjects were more precise in the CAVE system than with the HMD, for any reference distance. Contrary to our hypothesis, the measurement spectrum is strongly different for each system and for each subject. For the CAVE system, almost all the subjects were more precise for close distances (2…3 m and 5…7 m). On the other hand, all the good results for the HMD are found over 7 m, though it was not significantly different.
A possible explanation for incorrect appreciations in the CAVE system can be the shape, accuracy, dimensions and resolution of all the virtual cues designed in the virtual space. In the close distances case, the subjects could distinguish the graphical elements of the cues, and thus their task was more precise. These observations were mentioned by almost all subjects in their final questionnaire. As a second hypothesis, we supposed that the deviations would increase following a power law, for example Weber’s law (the subjective discrimination threshold of a stimulus depends linearly on its intensity). Here, in some cases, Weber’s law was not confirmed. An important reason can be a degradation in the distance indicators (vergence-accommodation conflict, relative size, etc.) or an excessive density of some indicators [2]. Finally, it must be mentioned that each subject has a personal strategy to pass the experiment. Thus, to improve the results, as a future work, a much higher number of subjects should be part of the experiment.
References
Bruder, G., Argelaguet, F., Olivier, A.H., Lcuyer, A.: CAVE size matters: effects of screen distance and parallax on distance estimation in large immersive display setups. Presence Teleoperators Virtual Environ. 25(1), 1–16 (2016). https://doi.org/10.1162/PRES_a_00241
Cutting, J.E., Vishton, P.M.: Perceiving layout and knowing distances: the integration, relative potency, and contextual use of different information about depth. In: Perception of Space and Motion, pp. 69–117 (1995). https://doi.org/10.1016/B978-012240530-3/50005-5
Dorado, J.L., Figueroa, P., Chardonnet, J.R., Merienne, F., Hernandez, T.: Comparing VR environments for seat selection in an opera theater. In: IEEE Symposium on 3D User Interfaces (3DUI), pp. 221–222 (2017). https://doi.org/10.1109/3DUI.2017.7893351
Fukusima, S.S., Loomis, J.M., Da Silva, J.A.: Visual perception of egocentric distance as assessed by triangulation. J. Exp. Psychol. Hum. Percept. Perform. 23(1), 86–100 (1997). https://doi.org/10.1037/0096-1523.23.1.86
Gardner, P., Mon-Williams, M.: Vertical gaze angle: absolute height-in-scene information for the programming of prehension. Exp. Brain Res. 136(3), 379–385 (2001). https://doi.org/10.1007/s002210000590
Grechkin, T.Y., Nguyen, T.D., Plumert, J.M., Cremer, J.F., Kearney, J.K.: How does presentation method and measurement protocol affect distance estimation in real and virtual environments? ACM Trans. Appl. Percept. 7(4), 26:1–26:18 (2010). https://doi.org/10.1145/1823738.1823744
Howard, J.P., Rogers, B.J.: Stereoacuity. In: Seeing in Depth. University of Toronto Press (2002)
Huckauf, A.: Virtual and real visual depth. In: APGV 2005 Proceedings of the 2nd Symposium on Applied Perception in Graphics and Visualization, p. 172 (2005). https://doi.org/10.1145/1080402.1080456
Iachini, T., Logie, R.: The role of perspective in locating position in a real world, unfamiliar environment. Appl. Cogn. Psychol. 17, 715–732 (2003). https://doi.org/10.1002/acp.904
Interrante, V., Anderson, L., Ries, B.: Distance perception in immersive virtual environments, revisited. In: Proceedings of the IEEE Conference on Virtual Reality, pp. 3–10 (2006). https://doi.org/10.1109/VR.2006.52
Kelly, J.W., Cherep, L.A., Siegel, Z.D.: Perceived space in the HTC Vive. ACM Trans. Appl. Percept. 15(1), 1–16 (2017). https://doi.org/10.1145/3106155
Knapp, J.M., Loomis, J.M.: Limited field of view of head-mounted displays is not the cause of distance underestimation in virtual environments. Presence Teleoperators Virtual Environ. 13, 572–577 (2004). https://doi.org/10.1162/1054746042545238
Kuhl, S., Thompson, T., Creem-Regehr, S.: HMD calibration and its effects on distance judgments. ACM Trans. Appl. Percept. 6(3) (2009). https://doi.org/10.1145/1577755.1577762
Loomis, J.M., Knapp, J.M.: Visual perception of egocentric distance in real and virtual environments. In: Virtual and Adaptive Environments, pp. 21–46 (2003)
Marsh, W.E., Chardonnet, J.-R., Merienne, F.: Virtual distance estimation in a CAVE. In: Freksa, C., Nebel, B., Hegarty, M., Barkowsky, T. (eds.) Spatial Cognition 2014. LNCS (LNAI), vol. 8684, pp. 354–369. Springer, Cham (2014). https://doi.org/10.1007/978-3-319-11215-2_25
Meng, J., Rieser, J., Bodenheimer, B.: Distance estimation in virtual environments using bisection. In: APGV 2006 Proceedings of the 3rd Symposium on Applied Perception in Graphics and Visualization, p. 146 (2006). https://doi.org/10.1145/1140491.1140523
Messing, R., Durgin, F.: Distance perception and the visual horizon in head mounted displays. ACM Trans. Appl. Percept. 2(3), 234–250 (2005). https://doi.org/10.1145/1077399.1077403
Mohler, B., Bülthoff, H., Thompson, W., Creem-Regehr, S.: A full-body avatar improves egocentric distance judgments in an immersive virtual environment. In: APGV 2008 Proceedings of the 5th Symposium on Applied Perception in Graphics and Visualization, p. 194 (2008). https://doi.org/10.1145/1394281.1394323
Ooi, T.L., Wu, B., He, Z.J.: Distance determined by the angular declination below the horizon. Nature 414, 197–200 (2001). https://doi.org/10.1038/35102562
Piryankova, I.V., de la Rosa, S., Kloos, U., Bülthoff, H.H., Mohler, B.J.: Egocentric distance perception in large screen immersive displays. Displays 34(2), 153–164 (2013). https://doi.org/10.1016/j.displa.2013.01.001
Plumert, J., Kearney, J., Cremer, J.: Distance perception in real and virtual environments. In: APGV 2004 Proceedings of the 1st Symposium on Applied Perception in Graphics and Visualization, pp. 27–34 (2004). https://doi.org/10.1145/1012551.1012557
Renner, R.S., Velichkovsky, B.M., Helmert, J.R.: The perception of egocentric distances in virtual environments - a review. ACM Comput. Surv. 46(2), 23:1–23:40 (2013). https://doi.org/10.1145/2543581.2543590
Ries, B., Interrante, V., Anderson, L., Lindquist, J.: Presence, rather than prior exposure, is the more strongly indicated factor in the accurate perception of egocentric distances in real world co-located immersive virtual environments. In: APGV 2006 Proceedings of the 3rd Symposium on Applied Perception in Graphics and Visualization, p. 157 (2006). https://doi.org/10.1145/1140491.1140534
Thompson, W.B., Willemsen, P., Gooch, A.A., Creem-Regehr, S.H., Loomis, J.M., Beall, A.C.: Does the quality of the computer graphics matter when judging distances in visually immersive environments? Presence Teleoperators Virtual Environ. 13(5), 560–571 (2004). https://doi.org/10.1162/1054746042545292
Willemsen, P., Colton, P., Creem-Regehr, S., Thompson, W.: The effects of head mounted display mechanics on distance judgments in virtual environments. In: APGV 2004 Proceedings of the 1st Symposium on Applied Perception in Graphics and Visualization, pp. 35–38 (2004). https://doi.org/10.1145/1012551.1012558
Willemsen, P., Gooch, A.: Perceived egocentric distances in real, image-based, and traditional virtual environments. In: Proceedings of the IEEE Virtual Reality Conference 2002, p. 275 (2002). https://doi.org/10.1109/VR.2002.996536
Witmer, B.G., Kline, P.B.: Judging perceived and traversed distance in virtual environments. Presence Teleoperators Virtual Environ. 7(2), 144–167 (1998). https://doi.org/10.1162/105474698565640
Witmer, B.G., Sadowski, W.: Nonvisually guided locomotion to a previously viewed target in real and virtual environments. Hum. Factors 40(3), 478–488 (1998). https://doi.org/10.1518/001872098779591340
Wu, B., Ooi, T., He, Z.: Perceiving distance accurately by a directional process of integrating ground information. Nature 428, 73–77 (2004). https://doi.org/10.1038/nature02350
Yang, U., Kim, N.G., Kim, K.H.: Perception adjustment for egocentric moving distance between real space and virtual space with see-closed-type HMD. In: SIGGRAPH Asia 2017, pp. 23:1–23:2 (2017). https://doi.org/10.1145/3145690.3145721
Author information
Authors and Affiliations
Corresponding author
Editor information
Editors and Affiliations
Rights and permissions
Copyright information
© 2018 Springer International Publishing AG, part of Springer Nature
About this paper

Cite this paper
Ghinea, M., Frunză, D., Chardonnet, JR., Merienne, F., Kemeny, A. (2018). Perception of Absolute Distances Within Different Visualization Systems: HMD and CAVE. In: De Paolis, L., Bourdot, P. (eds) Augmented Reality, Virtual Reality, and Computer Graphics. AVR 2018. Lecture Notes in Computer Science(), vol 10850. Springer, Cham. https://doi.org/10.1007/978-3-319-95270-3_10
Download citation
DOI: https://doi.org/10.1007/978-3-319-95270-3_10
Published:
Publisher Name: Springer, Cham
Print ISBN: 978-3-319-95269-7
Online ISBN: 978-3-319-95270-3
eBook Packages: Computer ScienceComputer Science (R0)