
Abstract
In this work we present a system able to simulate crowds in complex urban environments; the system is built in two stages, urban environment generation and pedestrian simulation, for the first stage we integrate the WRLD3D plug-in with real data collected from GPS traces, then we use a hybrid approach done by incorporating steering pedestrian behaviors with the goal of simulating the subtle variations present in real scenarios without needing large amounts of data for those low-level behaviors, such as pedestrian motion affected by other agents and static obstacles nearby. Nevertheless, realistic human behavior cannot be modeled using deterministic approaches, therefore our simulations are both data-driven and sometimes are handled by using a combination of finite state machines (FSM) and fuzzy logic in order to handle the uncertainty of people motion.
You have full access to this open access chapter, Download conference paper PDF
Keywords
1 Introduction
The problem of constructing large and complex urban environments for real-time simulations implies several challenges that arise in terms of acquisition and management of large geometric and topological models, real time visualization, and the complexity of the virtual human simulation. This field is increasingly incorporating mathematical and computational tools within the processes of designing urban spaces, consequently there is a need for plausible and realistic crowd simulations in large scale urban environments that can be used by expert designers [1].
Behavior of human crowds in the real world varies significantly depending on time, place, stress levels, the age of the people, and many other social and psychological factors, these variations shown in group behaviors are often characterized by observable traits such as interpersonal space, the fluidity of formation, the level of energy, the uniformity of distribution, the style of interactions, and so on. It is difficult to achieve realistic simulations due to the complex behavior and structures within the crowd.
The aim of the present work is to generate steering behaviors to simulate agents in real scenarios without the need of having a huge amount of data (like hundreds or even thousands of Mb) and with just a few parameters to adjust. We propose a hybrid method that takes into consideration real data for pedestrian navigation and finite state machines combined with fuzzy logic that help us model variety in each of the individual elements of the crowd, this way characters that share similar profiles might react completely different in the same situation.
2 Related Work
Producing a realistic and useful urban environment requires some steps such as modeling, processing, rendering, animating and displaying heterogeneous set of models [21]. In this section we briefly discuss some of the major work that was considered in the creation of the system.
2.1 Geographic Information Systems
Visualization software such as 3D globe based interfaces, navigation systems presenting a 3D perspective are increasing rapidly due to the recent developments in geographic information systems and data acquisition. This has created a need for the development of algorithms to reconstruct 3D data using 2D objects [15].
The work of Essen [5] describes a method used to produce 3D maps taking as a base a 2D city maps which contains relevant features. We extend this work by using GPS traces that allows us to extract urban and city information to create complex environments using real data and combining it with an interactive crowd.
The work of Thomsen et al. [23] introduces a general approach for modeling topology in 3D GIS, and addresses the problem of using real 3D data in comparison with traditional 2D or 2.5D and how the context of topological abstraction influences the final result, depending on the operations applied to a certain set of data. Using a cell layout hierarchies are created and geometry can have a mesh representation.
2.2 Crowd Visualization
Open world games are massively successful because they grant players absolute freedom in exploring huge, detailed virtual urban environments. The traditional process of creating such environments involves many person-years of work. A potential remedy can be found in procedural modeling using shape grammars. However the process of generating a complete, detailed city the size of Manhattan, which consist of more than 100,000 buildings, can take hours, producing billions of polygons and consuming tera-bytes of storage [13]. Steinberg et al. introduces a parallel architecture system designed for efficient, massively parallel execution on current graphics processing unit (GPU). This work takes into consideration account visibility and different level of detail. This way faster rendering is achieved due to less geometry. An adaptive level of detail is used as well and a dynamic vertex buffer and index buffer that allows geometry to be generated at any point during grammar derivation on the GPU. It is important to address that this simulations must run at interactive frame rates (at least 30 frames per second). Thalmann and Boatright [2, 22] stated that additional challenges such as Variety in both appearance and animation and behaviors. Steering also has a big impact in the creation of realistic simulations [16].
The work of da Silveira et al. [21] presents an approach for real-time generation of 3D virtual cities, providing a generic framework that supports semi-automatic creation, management and visualization of urban complex environments for virtual human simulation. It intends to minimize efforts in modeling of complex and huge environments.
2.3 Pedestrian Steering Behaviors
Pedestrian steering behaviors or pedestrian motion involves the behavior of an individual taking into consideration the other members of the crowd. According to Pettre [16], steering has a big influence as a factor to get a plausible and a realistic crowd. In order to address steering behavior, researchers have proposed different approaches. One way is dealing the crowd as macroscopic phenomena treating the crowd as a whole like Shinohara [20], other authors state that the movement of a group of pedestrians is driven by physical laws similar to those valid for dynamics of compressed fluids or gases like the work presented by Hoogendoorn and Hughes [8, 9]. However, these models have problems in simulating complex behaviors [4]. An alternative to the macroscopic approach is treating every agent in the crowd individually. This approach is called microscopic like vector based [17] and agent based [7, 14]. The aforementioned methods may lead to realistic results for specific situations, in order to do so, many finely tuned specific rules are required, in some cases up to 24 parameters [10]. As an alternative, researches have used data-driven techniques [3] by using video samples to construct a large example database containing the motion of nearby agents observed in video sequences to determine the moving trajectories of each simulated agent. The drawback of pure Data-driven is that they usually don’t model social group behaviors and when they do the data base grows significantly. In other words, data-driven models create very realistic results but require many examples and large amounts of memory in order to cover the complexity of social human behavior.
3 Urban Crowd Visualization
As discussed previously, the process of creating a complex urban environment is not a trivial task, many variables are involved in the process. Computational resources must be addressed when creating large scenes and memory consumption becomes bigger for every additional element in the given scene. Nevertheless memory is not the only problem, since these scenarios also consider high density crowds within the simulation processing time is required as well and must be properly bounded to ensure an acceptable performance. Figure 1 shows an example of an environment that uses visualization and level of detail techniques in order to have urban scenarios with crowds composed by hundreds of thousands of varied animated characters running at interactive frame rates without compromising visual quality [24].

Urban environment created using real data.
Rudomin et al. [18, 19] state that large scale crowd simulations and visualizations combine aspects from different disciplines, from computer graphics to artificial intelligence and high performance computing. Accordingly, We adapt the mechanism to compute spatio-temporal data such as pedestrians or vehicles, and combine it with map and geometric data used to describe specific places in the world.
Figure 1 shows how we create the urban environment using the previously discussed techniques, we use WRLD3D plug-in which gives us detailed information about geographic locations, in this case we construct the simulation using Barcelona city as a reference. Once the environment is created, we incorporate the crowd into the simulation, our goal is to make the simulations as complex as possible, to reach that goal we consider two different techniques that we combine; first, we collect real data from GPS traces that describe routes that pedestrians take within the city, this trace includes information about the latitude, longitude, elevation and the time when the sample was taken, and our agents can follow the given routes and be animated accordingly. Second, we consider autonomous characters that can navigate the environment. We include simple behaviors such as patrolling, following, avoiding obstacles or pedestrians just to state a few. This behavior is controlled by finite state machines in which each agent has the freedom to decide how to change states accordingly. Nevertheless, pedestrian behavior cannot be modeled realistically using deterministic models, thats why we incorporate fuzzy logic into the simulation, this way we can create different profiles for each character, and work with concepts such as fast or slow inside the simulation, what is true for an agent might not work in the same way for other. To decide whether a character is moving fast or slow and simulate properly we use a shared library of parameters that all characters inherit from, we can manually tweak each of the variables for any given character or randomly assign values. This allows us to create two different profiles for all the elements in the simulation, the first profile is focused in information such as vision range, maximum speed, weight, turn speed, to state some. The second profile is oriented towards how each character understands fuzzy concepts such as fast or slow, this way even if the members of the crowd have the same physical profile they might behave very different according to their fuzzy parameters. One of the main advantages of this method is that all agents have access to this knowledge and without any changes to the script we can achieve a lot of variety in the crowd behavior.
4 Generating Pedestrians Motion
Pedestrian motion is generated by mixing data-driven steering and group social forces. We use trajectories of pedestrians stored as a set of vectors. Those vectors encode the steering motion of real pedestrian interacting with each other in public spaces. This data is used to generate a steering action given a set of states affecting the surroundings of a virtual character. This steering action is complemented by Helbing’s social group forces to allow the generation of groups of people usually found on real scenarios [14].
4.1 Trajectories Structure Definition
The dataset of steering actions is conformed by a group of pedestrian trajectories \(\tau \) of each pedestrian k, formally \(\tau _k\) which defines a set of N displacements \(\delta _i\) from position \(P_i(x_i,y_i)\) to \(P_{i+1}(x_{i+1},y_{i+1})\). In consequence each displacement \(\delta \) is given by:
Therefore \(\tau _k\) is conformed as:
All the trajectories from the dataset are raw material to create a set of features and actions stored in memory as vectors [11]. We propose a set of 3 features which have strong influence in the steering decision of a pedestrian, those are presented bellow.
-
Goal vector: The goal vector is defined by Eq. 3.
$$\begin{aligned} {\varvec{goal}}=\sum _{i=0}^{N}\delta _i \end{aligned}$$(3)Due to datasets exhibiting a wide range of origins and destinations originated for each pedestrian and this is not desirable, we propose a vector alignment for all vectors of each trajectory in the dataset. To do so, we decided to apply a rotation to the global coordinate system from the original data to one who is always pointing to the “Y” axis. Accordingly given a \(\mathbf{goal }\) vector, We use a vector \(\hat{e}_2=(0,1)\) to get a normalization angle \(\eta \), which is needed to align the goal with “Y” axis. We call it a normalization angle which is calculated using the following equation:
$$\begin{aligned} \eta = cos^{-1}\left( \frac{\mathbf {\hat{e}_2} \cdot \mathbf{goal }}{\left| \mathbf {\hat{e}_2} \right| \cdot \left| \mathbf{goal } \right| } \right) \end{aligned}$$(4)Given a vector displacement \(\varvec{\delta }\). The normalized version \(\varvec{\gamma }\) of that vector according to angle \(\eta \) is given by:
$$\begin{aligned} \varvec{\gamma } = \left| \begin{array}{c} \varvec{\delta }_x*Cos(\eta ) - \varvec{\delta }_y*Sin(\eta ) \\ \varvec{\delta }_y*Cos(\eta ) + \varvec{\delta }_x*Sin(\eta ) \end{array} \right| \end{aligned}$$(5) -
Velocity: This factor comprises the rate of change of time, \(\varDelta t\) of the displacement of the pedestrian as a function of time. The velocity given by Eq. 6 provides part of the component of behaviors that describe collision avoidance.
$$\begin{aligned} {\varvec{v}}_{\varvec{i}}=\frac{\gamma _{i+1} - \gamma _i}{\varDelta t} \end{aligned}$$(6) -
Closeness to goal: This feature outlines how close (in percentage) the pedestrian is from its current position to the final destination observed in the trajectory dataset. The closeness to goal factor is defined by:
$$\begin{aligned} \sigma _i = \frac{\varvec{\gamma }_{\varvec{i}} \cdot {\varvec{goal}}_{\varvec{i}}}{{goal_i}_x^2+{goal_i}_y^2 } \end{aligned}$$(7) -
Obstacle code: The obstacle code \(\varphi \) is a factor that is calculated by using eight discrete radial regions. This kind of subdivision has been frequently used to capture the influence of the neighborhood in data-driven approaches [25]. Perceptual studies have demonstrated that regions toward the intended direction have a larger radius of influence on the trajectory of pedestrians [12] that fact lead us to introduce a slight difference consisting on incrementing the radius of the section pointing toward the direction of pedestrian’s motion (see Fig. 2). The angle of obstruction \(\beta \) of a pedestrian j in the neighborhood of a pedestrian i walking at a velocity \({\varvec{v}}_{\varvec{i}}\) is given by:
$$\begin{aligned} \begin{aligned} \alpha = atan2\left( {{\varvec{e}}_{{{\varvec{i}}},{{\varvec{j}}}}}_x,{{\varvec{e}}_{{{\varvec{i}}},{{\varvec{j}}}}}_y\right) - atan2\left( {{\varvec{v}}_{{\varvec{i}}}}_y,{{\varvec{v}}_{{\varvec{i}}}}_x\right) \end{aligned} \end{aligned}$$(8)$$\begin{aligned} \alpha _1={\left\{ \begin{array}{ll}\alpha +2*\pi &{} \alpha < 0\\ \alpha &{} \alpha \ge 0\end{array}\right. } \end{aligned}$$(9)From the Eq. 8, \(e_{i,j}\) the vector is pointing from pedestrian i to j. With the angle of obstruction \(\alpha _1\) the next quadrant adjustment is performed:
$$\begin{aligned} \beta ={\left\{ \begin{array}{ll}\alpha _1+\frac{\pi }{2} &{} \alpha _1< \frac{\pi }{2}\\ -1 &{}\frac{\pi }{2} \le \alpha _1 < \frac{3\pi }{2}\\ \alpha -\frac{3\pi }{2} &{} \alpha _1\ge \frac{3\pi }{2}\end{array}\right. } \end{aligned}$$(10)Finally the quadrant obstructed by pedestrian j is:
$$\begin{aligned} \varphi = \lceil \frac{\beta * 8}{\pi }\rceil \end{aligned}$$(11)Fig. 2. 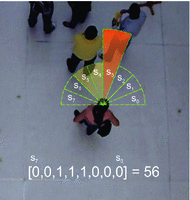
The space around the agent is divided into eight regions of radius r. The occupied regions establish the obstacle code \(\varphi \).

The set of features \({\varvec{v}},\sigma ,\varphi ,A_x,A_y\) define a state vector \({\varvec{S}}\) (see Eq. 12). In this case \(A_x\) and \(A_y\) forms a 2D the vector defining the motion performed by the pedestrian provides a certain state. All the vectors \({\varvec{S}}\) which match the same goal \(goal_k\) are packed in a look-up table \({\varLambda }_m\) see Eq. 13.
Therefore table \({\varLambda }\) represents our knowledge-base. The input of the knowledge base will be a state \({\varvec{s}}\), the system finds the closest match between the incoming state vector inside the knowledge-base. Once we have a match, the system returns the action vector \({\varvec{A}}=\left( A_x,A_y\right) \).
4.2 Social Data Driven Simulation Model
Finally the resulting steering vector of a pedestrian is modeled according to Eq. 14. The \({\varvec{A}}\) component of the steering force is given by the knowledge base as a function of the pedestrian state presented in the simulation. The rest of the components are given by \({{\varvec{f}}_{\varvec{i}}^{\varvec{group}}}\) which is the last component of the Moussaïd model of group social forces [14]. This fact allowed us to avoid demanding more memory resources to store persistent data related to group formations in the knowledge base. We chose the group force equation presented by Moussaïd because reproduces faithfully the group formations in pedestrians.
5 Results
In order to evaluate the simulation of the pedestrian steering motions, we employ a metric based on entropy as a measure of the size of the predicted error. Entropy has proven to be applicable to data generated with small and large number of pedestrians in sparse and dense scenes [6]. The measure of entropy is defined as follows: Given a state of a real scene \({\varvec{Z}}_k\) the difference between the action vector \({\varvec{A}}({\varvec{Z}}_k )\) and the next state \({\varvec{Z}}_{k+1}\) is calculated giving an entropy vector. In this case the total entropy for a given path is calculated using Eq. 15. In this case, the smaller the entropy the better the simulation.
We ran a test measuring the entropy for a single path followed by a pedestrian again different simulation models: vector based, data-driven based and our hybrid model (Fuzzy data-driven with group forces “FDDGF”), the result of this test is presented in Fig. 3. Our system ranked in the second place just slightly above over pure data driven techniques. It is a fact that Data-driven methods closely reflect the behavior of pedestrians in real scenes, but a major drawback in this approach is that they require large amounts of data and scaling sometimes becomes unfeasible. On the other hand, vector-based methods and rule-based methods demand less memory but instead of that they need hard fine tuning parameters that govern agent behaviors, which can be a very demanding task. Our experiments show that mixing data-driven methods with group forces allow us to achieve results comparable to those obtained with data-driven systems but using less memory and avoiding fine tuning parameters jobs.

We present the measurement of average entropy on the prediction made by vector-based models, data-driven models and our hybrid model (DDFG). Whiskers show the standard error for each sample. The sample size was of fifty random pedestrians walking alone.
For our experiments we executed the simulation and visualization process in a workstation with these characteristics: Intel Core i7-4810MQ CPU @ 2.80 GHz 8, 16 Gb of RAM, GeForce 880M with Gb of video memory. For a simulation in the city (Barcelona) with one thousand characters 4.3 million triangles are needed and 3.1 million vertices. We use 1115 draw calls and 39 batched draw calls. It takes a total of 300 MB of RAM memory, 112 MB of video memory and it takes 28 ms to render each individual frame giving us a 35.71 frame rate. In average each frame has 18000 objects and the total scene is composed by 42767 objects as shown in Fig. 4.

An example of the system running with the described specs.
6 Conclusions and Future Work
The previously discussed works show a robust approach for urban crowd simulation at interactive frame rates, the system is powerful enough to handle large environments with many agents in real time without compromising visual quality and the simulation of individual behavior. The system proves to be successful in achieving meaningful diversity in terms of how characters react for specific input or situations. Nevertheless this stage can be further optimized by including LOD techniques not only to rendering stages but to simulation, animation, collision avoidance and behavior taking into consideration the viewer position inside the environment. This way simulation overhead could be further reduced.
Applications for virtual city generation range from research and educational purposes such as urban planning and creation of virtual environments for simulation. Movie and game industries have a high demand for quick creation of complex environments in their applications, since they are in constant need for more art assets that form virtual worlds to support interaction, training, evaluation, virtual sets, and other uses. Security, crisis management and virtual training can take advantage of this environments as well.
References
Besserud, K., Hussey, T.: Urban design, urban simulation, and the need for computational tools. IBM J. Res. Dev. 55(1&2), 13–29 (2011). https://doi.org/10.1147/JRD.2010.2097091
Boatright, C.D., Kapadia, M., Shapira, J.M., Badler, N.I.: Context-sensitive data-driven crowd simulation. In: Proceedings of the 12th ACM SIGGRAPH International Conference on Virtual-Reality Continuum and Its Applications in Industry - VRCAI 2013, pp. 51–56 (2013). http://dl.acm.org/citation.cfm?doid=2534329.2534332
Charalambous, P., Chrysanthou, Y.: The PAG crowd: a graph based approach for efficient data-driven crowd simulation. Comput. Graph. Forum 33, 95–108 (2014). http://doi.wiley.com/10.1111/cgf.12403
Dai, J., Li, X., Liu, L.: Simulation of pedestrian counter flow through bottlenecks by using an agent-based model. Phys. A Stat. Mech. Appl. 392(9), 2202–2211 (2013). http://linkinghub.elsevier.com/retrieve/pii/S0378437113000265
van Essen, R.: Maps Get Real: Digital Maps evolving from mathematical line graphs to virtual reality models. In: van Oosterom, P., Zlatanova, S., Penninga, F., Fendel, E.M. (eds.) Advances in 3D Geoinformation Systems. LNGC, pp. 3–18. Springer, Heidelberg (2008). https://doi.org/10.1007/978-3-540-72135-2_1
Guy, S.J., van den Berg, J., Liu, W., Lau, R., Lin, M.C., Manocha, D.: A statistical similarity measure for aggregate crowd dynamics. ACM Trans. Graph. 31(6), 1 (2012). http://portal.acm.org/citation.cfm?doid=42005.42006dl.acm.org/citation.cfm?doid=2366145.2366209
Helbing, D., Molnár, P.: Social force model for pedestrian dynamics. Phys. Rev. E 51(5), 4282–4286 (1995). http://link.aps.org/doi/10.1103/PhysRevE.51.4282
Hoogendoorn, S.P., Bovy, P.H.L.: Normative pedestrian behaviour theory and modelling. In: Proceedings of the 15th International Symposium on Transportation and Traffic Theory, Adelaide, Australia, pp. 219–245 (2002)
Hughes, R.L.: The flow of human crowds. Ann. Rev. Fluid Mech. 35(1997), 169–182 (2003). http://www.annualreviews.org/doi/abs/10.1146/annurev.fluid.35.101101.161136
Lakoba, T.I.: Modifications of the Helbing-Molnar-Farkas-Vicsek social force model for pedestrian evolution. Simulation 81(5), 339–352 (2005). http://sim.sagepub.com/cgi/doi/10.1177/0037549705052772
Lee, K., Choi, M., Hong, Q., Lee, J.: Group behavior from video: a data-driven approach to crowd simulation. In: Proceedings of the 2007 ACM, San Diego, California, pp. 109–118 (2007). http://dl.acm.org/citation.cfm?id=1272706
Lerner, A., Chrysanthou, Y., Lischinski, D.: Crowds by example. Comput. Graph. Forum 26, 655–664 (2007)
Loviscach, J.: Deformations: wrinkling coarse meshes on the GPU. Comput. Graph. Forum 25(3), 467–476 (2006)
Moussaïd, M., Perozo, N., Garnier, S., Helbing, D., Theraulaz, G.: The walking behaviour of pedestrian social groups and its impact on crowd dynamics. PloS One 5(4), e10047 (2010). http://www.pubmedcentral.nih.gov/articlerender.fcgi?artid=2850937
van Oosterom, P., van Oosterom, P., Zlatanova, S., Penninga, F., Fendel, E.: Advances in 3D Geoinformation Systems, 1st edn. Springer, Heidelberg (2007). https://doi.org/10.1007/978-3-540-72135-2
Pettré, J., Ondrej, J., Olivier, A.h., Cretual, A., Donikian, S.: Experiment-based modeling, simulation and validation of interactions between virtual walkers. In: Proceedings of the 2009 ACM SIGGRAPH/Eurographics Symposium on Computer Animation 2009, p. 189 (2009). http://portal.acm.org/citation.cfm?doid=1599470.1599495
Reynolds, C.W.: Flocks, herds and schools: a distributed behavioral model. ACM SIGGRAPH Comput. Graph. 21(4), 25–34 (1987). http://portal.acm.org/citation.cfm?doid=37402.37406
Rudomín, I., Hernández, B., De Gyves, O., Toledo, L., Rivalcoba, I., Ruiz, S.: Generating large varied animated crowds in the GPU. In: Proceedings of ISUM 2013, pp. 1–11 (2013)
Rudomín, I., Solar, G.V., Oviedo, J.E., Pérez, H., Martini, J.L.Z.: Modelling crowds in urban spaces. Computación y Sistemas (CyS) 21, 57–66 (2017)
Shinohara, K., Georgescu, S.: Modelling adopter behaviour based on the Navier stokes equation. ISRN Mathematical Analysis 2011, pp. 1–10 (2011). http://www.hindawi.com/journals/isrn.mathematical.analysis/2011/894983/
da Silveira, L.G., Musse, S.R.: Real-time generation of populated virtual cities. In: Proceedings of the ACM Symposium on Virtual Reality Software and Technology, VRST 2006, pp. 155–164. ACM, New York (2006). http://doi.acm.org/10.1145/1180495.1180527
Thalmann, D., Grillon, H., Maim, J., Yersin, B.: Challenges in crowd simulation. In: 2009 International Conference on CyberWorlds, pp. 1–12 (2009). http://ieeexplore.ieee.org/lpdocs/epic03/wrapper.htm?arnumber=5279720
Thomsen, A., Breunig, M., Butwilowski, E., Broscheit, B.: Modelling and managing topology in 3D geoinformation systems. In: van Oosterom, P., Zlatanova, S., Penninga, F., Fendel, E.M. (eds.) Advances in 3D Geoinformation Systems. LNGC, pp. 229–246. Springer, Heidelberg (2008). https://doi.org/10.1007/978-3-540-72135-2_14
Toledo, L., De Gyves, O., Rivalcoba, I., Rudomn, I.: Hierarchical level of detail for varied animated crowds. Vis. Comput. 30, 949–961 (2014)
Torrens, P., Li, X., Griffin, W.a.: Building agent-based walking models by machine-learning on diverse databases of space-time trajectory samples. Trans. GIS 15, 67–94 (2011)
Acknowledgment
Special thanks to SECITI in Mexico for providing part of the founding for the present research, also we must express our gratitude for all the team that conforms the Barcelona Super Computing Center for facilitate the equipment and the infrastructure for the project.
Author information
Authors and Affiliations
Corresponding author
Editor information
Editors and Affiliations
Rights and permissions
Copyright information
© 2018 Springer International Publishing AG, part of Springer Nature
About this paper

Cite this paper
Toledo, L., Rivalcoba, I., Rudomin, I. (2018). Fuzzy and Data-Driven Urban Crowds. In: Shi, Y., et al. Computational Science – ICCS 2018. ICCS 2018. Lecture Notes in Computer Science(), vol 10862. Springer, Cham. https://doi.org/10.1007/978-3-319-93713-7_23
Download citation
DOI: https://doi.org/10.1007/978-3-319-93713-7_23
Published:
Publisher Name: Springer, Cham
Print ISBN: 978-3-319-93712-0
Online ISBN: 978-3-319-93713-7
eBook Packages: Computer ScienceComputer Science (R0)