
Abstract
Ever-increasing advances seen in barley genome sequencing over the last years have enabled scientists to generate databases and tools specially designed in helping researchers and breeders. Both genomic as well as expressed sequences were obtained through various experimental setups ranging from BAC sequencing over Illumina iSelect 9k SNP chip to RNA-Seq to form heterogeneous datasets. Where possible datasets were crosslinked and enriched in information to build a basis for further research. Ensembl Plants, a web portal designed for exploring genomic data for various plant species, have been utilized to explore differences and similarities between barley and its related species. Furthermore, the barley genome explorer BARLEX was constructed to be the central repository and hub of genomic sequences of barley sequencing efforts. Powerful visualizations of interconnected BACs and other sequencing information enable to backtrack every position that makes up the barley reference sequence and help in understanding the connection to other datasets. Further tools utilizing other barley data are discussed and described for more specialized use cases. Last but not least a list of URLs is given for a comprehensive overview of barley-centric resources.
Access provided by CONRICYT-eBooks. Download chapter PDF
21.1 Introduction
The molecular characterization of the barley genome has advanced rapidly in recent years, with the publication of successively more complete assemblies of the barley genome reference sequence (International Barley Genome Sequencing International Barley Genome Sequencing Consortium et al. 2012; Mascher et al. 2017). These assemblies are written as strings composed from a four characters alphabet, representing the succession of nucleotide bases that comprise a strand of DNA. But additional information is required to use these data for the understanding (and potential manipulation) of biological processes, and allow for the identification of functional elements, particularly the sequences of other individuals, populations and species—with patterns of conservation (and change) indicating likely functional roles (and their scope across the taxonomy). But other types of information are also critical—including expression data (directly indicating which elements of the genome are used, and when), and phenotypic observations (which typically result from the interaction of the genome and the environment). The resulting data sets are often very large, so to accelerate their search and interpretation, a number of resources have been developed, providing access to data and implementations of common algorithms for data analysis. Such tools allow researchers to quickly summarize what is known (and what, even if not previously explicitly stated, is easily inferable) and formulate new hypotheses (or, in the case of barley breeders, plan a breeding program), in full knowledge of the relevant facts.
The dominant paradigm for interactive exploration of genome-scale data is a software platform known as a ‘genome browser’, typically accessible via the World Wide Web. Genome browsers represent chromosomes (or chromosome fragments) as linear sequence (i.e. using the primary structure of the DNA polymer as the organizing principle), and allow users to zoom and scroll through each region of contiguous sequence (treating it as a one-dimensional map). Functional elements in the genome (e.g. genes, promoters) are marked, as are elements that code for functional features in molecules transcribed from the genome (e.g. splice sites, translational start sites, etc.). In addition to this positional information, additional views within the application provide non-positional information (e.g. names, functional descriptions, hyperlinks to other web resources representing the same object or related objects). As the reference barley genome assembly has become steadily more complete, it has become more suitable for dissemination through such a tool.
Any large map needs an index in order to be useful. Two sorts of index are commonly used in association with genome browsers (and other bioinformatics tools). First, there are tools that index metadata, associated with the sequence and annotation. These tools, often based on common text-search algorithms (e.g. Apache Lucene), but are more powerful if the data is structured, which allows the development of more advanced search tools and reduces the probability that interesting data is missed by accident, because it happens to have been described in an unexpected way. This observation has driven efforts by data generators and custodians to agree on common data formats, grammars and structured vocabularies to express this information. Second, the actual sequence can be indexed, allowing users to find portions of the genome that match (exactly or approximately) to a query sequence already of interest. As molecular sequences can be represented as character strings, essentially these are text-matching algorithms refined to better meet biological use cases (by favouring alignments that are more likely to indicate the evolution and function of the sequences), e.g. (Needleman and Wunsch 1970; Smith and Waterman 1981; Altschul et al. 1990). Either type of search can be used to find a region of interest within the genome, which users can then explore using the browser and associated functionality.
Other tools are also important for accessing genome data. Specialized tools provide the evidence supporting the construction of the genome assembly, e.g. the sequencing of BACs along a minimal tiling path or the creation procedure of pseudomolecules. Where contiguous sequence is unavailable, genetic information can provide a scaffold (and indeed, the language of the ‘genetic map’ precedes the development of software visualizations). Where sequence is missing from the genome, transcriptome data may be searched to locate missing genes. In addition, certain large-scale analyses may provide vital context for interpretation. Numerous algorithms apply the principles of sequence alignment to propose functions and histories for families of related genes, and to identify events that have had causative impact on phenotypes and traits such as gene sequence mutation, duplication and extinction, defunctionalization and neofunctionalization. Data sets linked to such algorithms are available as part of many resources, as well as tools that allow users to perform such analyses with a combination of private data and public reference resources.
Of particular relevance to the barley genome is the fact that many related species have also had their genomes sequenced, providing a wealth of interpretable context. These include other species from within the grass family (Poaceae) closer relatives from the Triticeae tribe, including other important crops. In addition, genomic data is also available from an increasing number of cultivated and wild barleys, which can (in the most part) be organized using the reference genome sequence as an anchor.
21.2 Overview of Barley Resources
21.2.1 Ensembl Plants and Gramene
Ensembl Plants (http://plants.ensembl.org) (Kersey et al. 2016) is a web portal offering access to genomic data for 45 different plant species, at the moment of this writing, including barley. Current and previous barley genome assemblies are available through the site and can be explored using a genome browser interface. The portal also contains several additional tools for exploring the data, and in addition, provision is made for accessing the data programmatically, in bulk, and through fast, specialized interfaces supporting frequent use cases. Ensembl Plants manages a joint data set and common interface tools with the Gramene database (http://www.gramene.org) (Tello-Ruiz et al. 2016), and the same data can be accessed through either site.
Available data types include assembled genome sequence, protein-coding and nonprotein-coding gene structures, protein domain analysis and functional classification, and comparative analysis amongst related genomes. The platform also supports genetic variation data, which can be linked to populations and phenotypes, or analysed on the fly. New genome assemblies are often originally made available first via a prerelease site (http://pre.plants.ensembl.org), before subsequent full integration into the resource. Older assembly versions remain available after release on an archive site (http://archive.plants.ensembl.org). As of August 2017, the site currently includes two versions of the barley genome assembly, including an improved version of the IBSC_1.0 assembly (International Barley Genome Sequencing International Barley Genome Sequencing Consortium et al. 2012) (with additional information used to scaffold the contigs derived from population genomics (Ariyadasa et al. 2014; Mascher et al. 2013a) (located on the main site) and the new assembly (Mascher et al. 2017) (located on the pre-site). An assembly of the chloroplast genome (Middleton et al. 2014) has also been included in both assemblies. When the new assembly migrates into the main site, the previous assembly will remain visible in the archive.
Specific data for barley within Ensembl Plants includes mappings to the genome of the probe sets from Barley1 GeneChip array, the Agilent barley full-length cDNA array, and the barley PGRC1 10k A and B arrays. Transcriptomic data has also been aligned from 21 experiments in barley. Variation has been identified from five sources: the WGS survey sequencing of four cultivars (Barke, Bowman, Igri, Haruna Nijo and a wild barley (H. spontaneum)) (International Barley Genome Sequencing International Barley Genome Sequencing Consortium et al. 2012); RNA-Seq performed on the embryo tissues of 9 spring barley varieties (Barke, Betzes, Bowman, Derkado, Intro, Optic, Quench, Sergeant and Tocada) and Morex using Illumina HiSeq 2000 (International Barley Genome Sequencing International Barley Genome Sequencing Consortium et al. 2012); ~5 million variations from population sequencing of 90 Morex × Barke individuals (Mascher et al. 2013a); ~6 million variations from population sequencing of 84 Oregon Wolfe barley individuals (Mascher et al. 2013a); and SNPs from the Illumina iSelect 9k barley SNP chip. 2600 markers associated with the iSelect SNPs are also displayed (Comadran et al. 2012). The browser also provides access to alignments to the barley genome of transcriptomic data from related organisms, including RNA-Seq, EST and Unigene data sets derived from Triticum aestivum, and RNA-Seq assemblies of two subspecies of Triticum monococcum.
Within Ensembl Plants, barley protein sequences are analysed using the domain and family classification tool InterProScan (Finn et al. 2017), and from the domain assignments, functional annotation is derived, expressed in the language of the Gene Ontology (Gene Ontology Gene Ontology Consortium 2015). In addition, with each release, protein sequences from the entirety of Ensembl Plants are clustered, a tree is constructed from each cluster, and each tree is compared with the species history to infer gene duplication and deletion events and thus the existence of true orthologues and paralogues within each cluster (Vilella et al. 2009). In addition, whole genome alignments have been performed between barley and several closely related species, including Aegilops tauschii, Brachypodium distachyon, Oryza sativa (Japonica group), and Triticum urartu.
21.2.2 BARLEX—A Network-Based Genome Explorer for Barley Assembly Components
Genome projects usually combine a large amount of heterogeneous data types that in a final step are combined into a single resource. Although intermediate products of genome sequencing harbour untapped potential and evidence of biological interest, they are rarely reported in scientific literature. Often just a simple linear sequence of pseudomolecules is reported as the final product of a genome sequencing endeavour. For complex organisms like the barley genome, constructing a linear sequence is a considerable piece of work. To the author’s knowledge, this has been the first genome to combine such a large diversity of data sources for a complex genome. Among the genome size, the high amount of repetitive content makes sequencing and assembling the barley genome a tremendous challenge. Short read sequencing alone cannot overcome this problem so the international barley sequencing consortium had to facilitate many different techniques and combine numerous data sets to finally arrive at the destination of presenting the first linear ordered reference sequence of barley. These resources cover physical (Ariyadasa et al. 2014) and genetic maps (Mascher et al. 2013a), several libraries of bacterial artificial chromosomes (Mascher et al. 2013a; Schulte et al. 2009), Sanger-sequenced BAC ends, chromosome conformation capture sequences, the gene centric draft genome based on whole genome shotgun sequencing (Schulte et al. 2009; Mascher et al. 2013a; International Barley Genome Sequencing International Barley Genome Sequencing Consortium et al. 2012), exome capture data (Mascher et al. 2013b) and expression profile based on RNA-Seq and Iso-Seq.
As a complement to the linear genome browser Ensembl Plants, a network-based view for the visualization of the genome increases the usage possibilities of the barley resources. With this network illustration, the high interconnectivity between different approaches, like BAC sequencing, genetic maps, exome capture data or other resources could be illustrated. The web-based application BARLEX (Colmsee et al. 2015) was developed to fulfil these requirements.
For this endeavour, a powerful Oracle database and the Oracle Application Express (APEX) software with the graphical plugin Cytoscape Web (Lopes et al. 2010) was combined. The plugin enabled us to visualize graph networks. Each edge and each node can be dragged around, giving the user the possibility to entangle complex graph structures within the given boundaries of the application and page. Tooltips and many interlinked pages based on sequencing effort can be accessed and navigated in an intuitive way.
The backbone of BARLEX is the minimal tiling path of BACs that was utilized to sequence the genome of barley. Each BAC clone has information based on its assembly such as the number of contigs, complete sequenced size of individual BAC assemblies and other key figures displayed in a tabular manner. In the process of fingerprinting, the whole collection of BACs so-called fingerprinted contigs were assembled with the utilization of restriction enzyme digestion (Soderlund et al. 1997). As a possibility to compare the sequencing effort with these physical contigs, sequenced BACs were screened for homology with megaBLAST (Zhang et al. 2000). With this concept, sequence clusters were formed and are visualized directly beside the physical contig for comparison.
Currently, the information of 87 075 BAC clones (consisting of minimal tiling path clones from all seven chromosomes and gene-bearing clones (Munoz-Amatriain et al. 2015) sequenced independently) are available in the BARLEX database. Two different gene sets were imported into BARLEX as well. The first published gene set based on several RNA-Seq experiments, cDNA libraries and the WGS assembly published by the International Barley Sequencing Consortium. The most recent gene set comprises of 39 734 high confidence and 41 949 low confidence genes. Additional links to Gene Ontology (Ashburner et al. 2000), InterPro (Finn et al. 2017) and Pfam (Finn et al. 2016) were also imported. Expression profiles for 16 developmental stages as well as exome capture targets have been integrated into BARLEX too.
Repeat annotation of mobile elements based on the pseudomolecule sequence has been integrated and gives a first overview over the composition of these elements of the complete barley genome. Sequences were screened against the REdat_9.7_Poaceae section of the PGSB transposon library (Spannagl et al. 2016) with vmatch (Kurtz 2003).
Inspecting of sequence complexity can also be done by looking at K-mer frequencies over the length of sequenced BAC contigs and is visualized insight BARLEX with the Kmasker software (Schmutzer et al. 2014). This particular visualization shows how the sequence composition is represented by short K-mers common to the barley genome. High abundance sequences will show a high occurrence in common K-mers while unique or low copy sequence will show a low occurrence of common K-mers.
Several entry points for BARLEX were set up. Fingerprinted contigs, sequence cluster, and BACs can be looked up with their names or their positions (genetic/physical). Likewise, a table of annotated genes can be searched with gene identifiers or the names of the sequence contig carrying them and is directly linked to the BAC information. All BLAST results underlying the links between BACs and contigs are also accessible as searchable tables with hyperlinks to information pages. Marker information from the 9k Illumina iSelect SNP chip were mapped to the reference sequence and can be accessed in BARLEX (Comadran et al. 2012).
Finally, direct links to the barley BLAST server and a portlet connecting BARLEX to the LAILAPS search engine (Lange et al. 2009) are embedded on the front page of BARLEX.
21.2.3 IPK Barley BLAST Server
For homology-based searches, several BLAST databases (Deng et al. 2007) have been set up at the IPK. They include the published draft assemblies of the barley cultivars Morex, Barke and Bowman (International Barley Genome Sequencing International Barley Genome Sequencing Consortium et al. 2012), as well as multiple special purpose databases (e.g. exome capture, BAC end sequences, full-length cDNA). Furthermore, the new pseudomolecule sequence and all associated resources are presented in this database as well. This includes the pseudomolecule sequence of the reference cultivar Morex, the annotated gene prediction (high- and low confidence gene sets) and the individual BAC assemblies used for the construction of the pseudomolecule sequence. These can be accessed via http://webblast.ipk-gatersleben.de/barley (Tables 21.1 and 21.2).
21.2.4 PGSB/MIPS PlantsDB Resources for Barley Genome Data
PGSB (Plant Genome and Systems Biology; formerly MIPS—Munich Institute for Protein Sequences) PlantsDB (Spannagl et al. 2016) is a database framework for the integration and analysis of plant genome data, with a major focus on comparative genomics and intuitive user navigation. PlantsDB is maintained over a decade now and stores and integrates data for individual (reference) genomes from both model and crop plants. Comparative genomics and analysis tools include CrowsNest, a viewer to explore conserved gene order (synteny), as well as RNASeqExpressionBrowser. The Repeat Element Database (pgsb-REdat) and the Repeat Element Catalog (pgsb-REcat) provide access to repetitive elements from various plant genomes, including a classification scheme. Data exchange with partners as well as integrated search functionality is facilitated using standards and technology developed within the transPLANT project.
PGSB PlantsDB can be accessed at http://pgsb.helmholtz-muenchen.de/plant/genomes.jsp.
21.2.5 PGSB PlantsDB Data Content and Access
PlantsDB currently stores and integrates genome data for the plant model organisms Arabidopsis thaliana, Oryza sativa (Rice), Medicago truncatula, Zea mays (Maize), Solanum lycopersicum (Tomato) and many more. To accommodate data and analysis results from the complex genomes of barley, wheat and rye, an instance specifically attributed to Triticeae genomes was generated within PlantsDB.
To access data interactively within PlantsDB, users navigate the database in a genome-oriented way. For every plant species, a dedicated database instance has been set up and can be accessed from the entries’ page phylogenomic tree. Every genome database features the same basic navigation structure, with views and interfaces for many genetic elements such as genes, transposable elements, noncoding RNA, sequence contigs and many more. Genetic element reports, representing detailed information on particular genes, provide download options in HTML, XML or FASTA format. Cross-references were set up to access entries in external databases associated with the entry (e.g. links to the corresponding gene report in Ensembl Plants (Bolser et al. 2017) or BARLEX (Colmsee et al. 2015)). Other options to access data in PlantsDB include a generalized search function, a sequence similarity search via BLAST and various download options. Besides gene IDs, the generalized search option operates on a set of pre-calculated functional gene descriptions, also referred to as ‘human readable descriptions’. These descriptions either were derived from curated resources (such as from TAIR for Arabidopsis thaliana (Lamesch et al. 2012)) or computed using the AHRD (‘Automatic assignment of human-readable descriptions’) tool (Tomato Genome Tomato Genome Consortium 2012).
Beside information on individual genetic elements, more and more combinatorial and comparative queries become important to address more complex scientific questions. To address these more specific tasks, specialized tools and interfaces were developed or integrated in PlantsDB, including the synteny browser CrowsNest and the RNASeqExpressionBrowser, both outlined in more detail later.
21.2.6 Barley Genome Resources in PlantsDB
Genome resources in PlantsDB for barley mainly originated from the whole genome shotgun (WGS) analysis study and draft genome sequence published in 2012 (International Barley Genome Sequencing International Barley Genome Sequencing Consortium et al. 2012). PGSB has set up a database instance to integrate, manage and accommodate the resulting, often heterogeneous, data sets and provide users an entry point to search, browse, analyse and download that data in various ways and formats. With the emergence and availability of the barley reference genome sequence (expected in 2017), the PlantsDB barley database instance will be updated with the latest genome assembly, predicted gene calls and transposable elements as well as with associated data. PlantsDB views and tools that feature barley genome data include:
-
A.
Access to Chromosome-arm sorted whole genome draft sequences (cultivars Morex, Barke and Bowman), generated by (International Barley Genome Sequencing International Barley Genome Sequencing Consortium et al. 2012). Gene predictions as well as functional annotation were performed by PGSB and data can be downloaded from PlantsDB (via structured FTP server at ftp://ftpmips.helmholtz-muenchen.de/plants/barley/public_data/). This download also provides access to expression data, physical and genetic maps plus their integration/anchoring, POPSEQ data (Mascher et al. 2013a), GenomeZipper data (see B.) and repeat annotation.
-
B.
GenomeZipper data for barley: To overcome limitations introduced by often fragmented genome sequence assemblies and short contigs, virtually ordered gene maps were constructed for barley (Mayer et al. 2011), rye (Martis et al. 2013) and wheat (International Wheat Genome Sequencing International Wheat Genome Sequencing Consortium 2014). The GenomeZipper concepts (Mayer et al. 2011) hereby utilize the observation of long stretches of conserved gene order between many grass genomes (‘synteny’) (Moore et al. 1995), and integrate next generation sequencing data, chromosome sorting, array hybridization and fl-cDNAs, ESTs and genetic markers. That way, information-rich scaffolds of complex cereal crop genomes can be constructed from less complex, fully sequenced grass model species such as rice, sorghum and Brachypodium distachyon. To visualize GenomeZipper data and make all integrated data searchable to users, PlantsDB provides dedicated GenomeZipper interfaces. These provide access to all raw data/sequences anchored and Zipper results can be queried either via a visual map interface or via reference gene models from rice, Sorghum or Brachypodium distachyon. Download options include Excel- and/or CSV-formatted files (http://pgsb.helmholtz-muenchen.de/plant/barley/gz/download/index.jsp).
-
C.
Barley gene predictions based on 2012 WGS draft genome sequence: all gene models predicted on the IBSC 2012 WGS draft genome sequence (International Barley Genome Sequencing International Barley Genome Sequencing Consortium et al. 2012) have been integrated into PlantsDB and are available for search by ID, keyword, functional description or sequence similarity via BLAST. Gene reports were set up for all barley genes, summarizing gene structure, sequence features, domains, GO terms, external links, confidence assignment and sequence downloads.
21.2.7 CrowsNest—A Tool to Explore and Visualize Syntenic Relationships in Grasses
To analyse structural genome characteristics of plants such as conserved gene order between plant genomes, customized visualization tools are required. As a part of PlantsDB, CrowsNest was developed as a synteny viewer to facilitate comparisons on the basis of genetically and physically anchored genomes. Four different hierarchically ordered view levels visualize syntenic segments, orthologous and homologous gene pairs for selected plant genome comparisons (Table 21.3). CrowsNest allows the comparison of up to three genomic datasets (one target and one or two reference datasets). The CrowsNest tool can be accessed at http://pgsb.helmholtz-muenchen.de/plant/crowsNest/.
For barley, CrowsNest makes use of the integrated genome map and gene calls generated and published by IBSC in 2012 (International Barley Genome Sequencing International Barley Genome Sequencing Consortium et al. 2012). Figure 21.1 provides an example view comparing the gene order in barley (on the basis of the 2012 IBSC genome orientation) with the gene order in Brachypodium distachyon. This view corresponds to level 2 with visualization of individual chromosomes.

CrowsNest view illustrating conserved gene order between segments of barley chromosome 1 and Brachypodium distachyon chromosomes 2 and 3. Additional (hierarchical) views can be accessed using the navigation bar in the top left corner
21.2.8 PGSB RNASeqExpressionBrowser to Explore and Analyse Barley Transcriptome Data
With the emergence and availability of multiple expression data sets for individual species, it has become increasingly important to both structure and visualize these data in the context of the genome data. To facilitate the analysis, communication and sharing of RNA-Seq transcriptome data, RNASeqExpressionBrowser (Nussbaumer et al. 2014) was developed as a web-based tool and integrated into PlantsDB (accessible at http://pgsb.helmholtz-muenchen.de/plant/RNASeqExpressionBrowser).
At date, the RNASeqExpressionBrowser stores the RNA-Seq expression data for two different barley experiments: (i) publically available RNA-Seq data from the IBSC 2012 publication (International Barley Genome Sequencing International Barley Genome Sequencing Consortium et al. 2012) (ii) expression data from a study related to Bacteria-triggered systemic immunity in barley (Dey et al. 2014). The RNASeqExpressionBrowser provides three different ways to access the processed RNA-Seq datasets: Wildcard-search based on keywords (such as gene identifier or domain annotation), a BLAST search against the corresponding sequences, or a search based on a gene list. The RNASeqExpressionBrowser is also available as a portable stand-alone software platform enabling import and visualization of own RNA-Seq derived expression data.
21.2.9 PGSB Repeat Element Database (mips-REdat) and Catalog (mips-REcat)
The Repeat Element Database (pgsb-REdat) and the Repeat Element Catalog (pgsb-REcat) provide various interfaces for browsing and downloading repetitive elements. pgsb-REdat stores repetitive sequences from many different plant genomes/species which can be downloaded and used for, e.g. masking repetitive elements in gene prediction efforts. The mips-REcat repeat catalog provides a hierarchical classification scheme for repetitive elements with different levels, starting from main groups down to more specific repeat families. Both pgsb-REdat and pgsb-REcat assist users in the in silico detection of repeats and in the analysis of more complex and nested repeat insertions, e.g. present in the barley genome. pgsb-REdat and pgsb-REcat can be accessed via the PlantsDB tools section or directly at http://pgsb.helmholtz-muenchen.de/plant/recat/index.jsp.
21.2.10 Specialized Resources
GrainGenes (Carollo et al. 2005), a database for Triticeae and Avena, is a comprehensive resource for molecular and phenotypic information for wheat, barley, rye and other related species, including oat. The main data types provided for barley (https://wheat.pw.usda.gov/GG3/barley_blvd) are genetic maps, markers and germplasm information.
RNA-Seq data from the Morex cultivar can be searched at morexGenes (https://ics.hutton.ac.uk/morexGenes/), and epigenomic data can be accessed in the barley epigenome browser (https://ics.hutton.ac.uk/barley-epigenome/) (Baker et al. 2015). The Triticeae Toolbox (http://triticeaetoolbox.org) is a database schema enabling plant breeders and researchers to combine, visualize and interrogate the wealth of phenotype and genotype data generated by the Triticeae Coordinated Agricultural Project (TCAP) (Blake et al. 2016).
A database for barley genes and genetic stocks, including nomenclature for many genes, is available at NordGen (http://www.nordgen.org/bgs/index.php?pg=bgs_tables&m=loc).
21.3 Specific Use Cases for the Barley Genome
Use Case 1:
(International Barley Genome Sequencing International Barley Genome Sequencing Consortium et al. 2012; Yang et al. 2014) was able to identify two fingerprinted contigs (FPCs) containing flanking genetic markers for a gene that induces susceptibility to barley yellow mosaic virus (BaYMV). In order to detect the gene, 17 BACs were sequenced between these markers. The hypothesis was that both FPCs were overlapping and manual inspection showed that to be true. With this information (Yang et al. 2014) was able to locate a candidate gene.
By using only the tools available in BARLEX, we were able to reproduce these results (Fig. 21.2).

Automatic determination of sequence overlaps between BACs (Yang et al. 2014). The automatic determination based on homology in the BARLEX system was able to reproduce and visualize the previously shown overlap between two FPCs (a). The Dotplot of the two connecting BACs showed a clear sequence shared by both clones represented by their identifiers: HVVMRX83kHA0173N06 and HVVMRX83kHA0172K23 (b)
Use Case 2:
A general approach in finding your region of interest in the barley genome: You usually start with a protein of interest. On the BARLEX website, you paste the sequence into the BLAST field and hit the button ‘go to BLAST search’. This will automatically open the BLAST tool. The output of this homology search is directly linked to the BARLEX system and will show you the sequence with the highest homology in the barley data set, usually a BAC sequence contig (or a gene). Using the hyperlinks will bring you to that specific BAC contig and its complexity plot (from Kmasker analysis (Schmutzer et al. 2014)). From here, there are two possible ways to obtain more information.
Either you follow the link to the parent BAC and then proceed in looking at its FPC and other neighbouring BACs from its cluster or you can try the AGP List and paste the BAC contig identifier into the ‘Sequence Position -> AGP Position’-tool. If the BAC contig is part of the nonredundant sequence you will be able to find a corresponding position in the pseudomolecules and can use this for downstream analysis.
Use Case 3
Use a sequence to find a gene in barley and then its homologues in other Triticeae species; obtain functional information about the gene family, and identify differences in sequence likely to account for any divergence in function.
-
1.
Go to http://plants.ensembl.org/index.html and click on ‘HMMER’ in the header. HMMER is an alternative sequence search tool to BLAST and is a quick and accurate way of matching protein sequences, that uses Hidden Markov Models to identify likely conserved domains (Finn et al. 2015).
-
2.
Paste your sequence into the search box, and press ‘return’. Figure 21.3 contains a query sequence used in this example.
Fig. 21.3 
Example sequence for use in use case
-
3.
After a short delay, a results page appears, showing the protein domains identified within your query sequence and below, a ranked list of protein sequence matches from plant genomes (see Fig. 21.4). Select the best match from barley.
Fig. 21.4 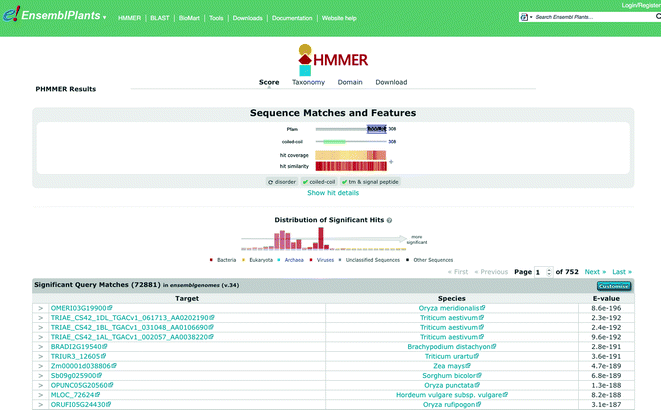
Results panel from using the HMMER search in Ensembl Plants
-
4.
Clicking on the gene name (‘MLOC_72624’ if you used the example sequence, above) takes you to a page providing an overview about this gene. In the left-hand margin, there are various options to view additional information. Click on the link entitled ‘Gene tree’.
-
5.
The view shows an inferred evolutionary history of the gene family containing the selected gene. When (as in the example case) the family is large, the tree is shown in a contracted fashion. However, it can be expanded, in whole or in part. The selected gene is shown in red where portions of the tree are compressed shown by a solid triangle, the taxonomic range of the compressed portion of the tree is indicate to the right of the triangle. Meanwhile, each implied speciation or gene duplication event in the history of the family is shown by a small square box within the tree. Find the box corresponding to the node whose descendants contain the selected gene and other members of the Poeceae family. Hovering over the node reveals information about the event and options for analysis or visualization. Click on ‘expand all-sub trees’ to fully see the descendants of this node. The expanded tree is shown in Fig. 21.5.
Fig. 21.5 
Ensembl gene tree for barley gene MLOC_72624, expanded for the Poeceae (true grass) family
-
6.
Find the homologue of the gene in the well-annotated genome of Oryza sativa japonica. Click on it, and learn what you can about the gene’s function.
-
7.
Now click on the node in the tree covering just the selected genes and its orthologues in the Triticeae. There are various options for viewing an alignment of these genes, including the interactive Wasabi alignment browser or export in various formats.
-
8.
Notice that the tree indicates the selected gene has at least one paralogue, shown in blue. Click on the ‘Paralogues’ link in the left-hand menu to find out more.
-
9.
Some of these paralogues are only distant family members. Identify the closest paralogue in the list and click on ‘Alignment (protein)’ in the ‘Compare’ column to see how the two paralogues have diverged.
-
10.
Now click on ‘Variant image’ in the left-hand margin. This produces a graphic of known sequence polymorphisms in the barley population. Colours are used to indicate which variants are likely to disrupt the function of coding genes.
-
11.
Click on ‘Variant table’, and use the button marked ‘Consequences’ to filter the contents of the table to see only missense variants.
-
12.
Click on the variant ID to see more information about this variant.


21.4 Discussion: Future Perspectives
One limitation of the current barley genome and annotation is the relatively low availability of detailed functional information about barley genes. In the case of many genes, their function is unknown; their biochemical activity may be inferable from the presence of common domains in the proteins they encode, but their precise biological role is unknown. The availability of a high-quality reference genome sequence opens the way to large-scale genotypic-phenotypic analysis, and to the characterization of genes based on the molecular and morphological traits associated with variant forms. A major challenge is to incorporate this information in gene annotations, and find other appropriate ways to make the results of such analyses available to users.
Another source of information is from comparisons to genomes from other species. As genomes become more complete, orthology can be more reliably determined and information projected from well-studied sequences to others. A further benefit for barley could be provided from a standardization of naming across the Triticeae, providing an easy way to identify equivalent genes. This is made difficult by the complex evolutionary history of the tribe, and the existence of established, but inconsistent, naming conventions between barley and wheat.
We future developments in sequencing technology to drive further improvements in the reference assembly, but also in future sequencing of other strains of cultivated barley, wild barley and less studied relatives. High-quality assemblies will allow the construction of a definitive catalogue of genome diversity at all scales, including large-scale structural variation; and identify a wealth of usable genes that might be incorporated into elite lines. In an ideal model, this catalogue would be searchable, linked to gene banks and to repositories of phenotypic information, and available for on-demand search and genome-wide association analysis. But challenges remain in sequencing this material and disseminating the information a number of broadly based international groups have formed an organization, DivSeek (http://divseek.org), to coordinate in this task for many crops. Phenotyping data, which can include molecular, laboratory, greenhouse or field data, presents further challenges owing to its diverse nature, the absence of generic repositories and the relative lack of standard ways of representing this information. A barley trait dictionary has been developed as part of the Crop Ontology (http://www.cropontology.org/ontology/CO_323/Barley%20Trait%20Dictionary) and is a first step towards being able to support the representation of barley phenotypes in a consistent fashion across multiple experiments. An overview of barley resources are summarized in Table 21.4.
Abbreviations
- AA:
-
Amino acid
- AGP:
-
A golden path (filetype)
- AHRD:
-
Automatic assignment of human-readable description
- BAC:
-
Bacterial artificial chromosome
- BLAST:
-
Basic local alignment search tool
- CDS:
-
Coding sequence
- cDNA:
-
Copy DNA
- CSH:
-
Cold Spring Harbor laboratory
- DNA:
-
Deoxyribonucleic acid
- EBI:
-
European Bioinformatics Institute
- EI:
-
Earlham Institute (formerly TGAC)
- EST:
-
Expressed sequence tag
- FPC:
-
Fingerprinted contig
- FTP:
-
File transfer protocol
- GO:
-
Gene ontology
- HC:
-
High confidence
- HTML:
-
Hypertext markup language
- IBSC:
-
International Barley Genome Sequencing Consortium
- IPK:
-
Leibniz Institute of Plant Genetics and Crop Plant Research
- Iso-Seq:
-
Isoform sequencing
- JHI:
-
James Hutton Institute
- LC:
-
Low confidence
- PGSB:
-
Plant Genome and Systems Biology unit at the Helmholtz Center Munich
- QTL:
-
Quantitative trait loci
- RNA:
-
Ribonucleic acid
- RNA-Seq:
-
RNA sequencing
- SNP:
-
Single nucleotide polymorphism
- TAIR:
-
The Arabidopsis Information Resource
- TCAP:
-
Triticeae Coordinated Agricultural Project
- TGAC:
-
The Genome Analysis Centre
- WGS:
-
Whole genome shotgun
- XML:
-
Extensible markup language
References
Altschul SF, Gish W, Miller W, Myers EW, Lipman DJ (1990) Basic local alignment search tool. J Mol Biol 215(3):403–410. https://doi.org/10.1016/S0022-2836(05)80360-2
Ariyadasa R, Mascher M, Nussbaumer T, Schulte D, Frenkel Z, Poursarebani N, Zhou R, Steuernagel B, Gundlach H, Taudien S, Felder M, Platzer M, Himmelbach A, Schmutzer T, Hedley PE, Muehlbauer GJ, Scholz U, Korol A, Mayer KF, Waugh R, Langridge P, Graner A, Stein N (2014) A sequence-ready physical map of barley anchored genetically by two million single-nucleotide polymorphisms. Plant Physiol 164(1):412–423. https://doi.org/10.1104/pp.113.228213
Ashburner M, Ball CA, Blake JA, Botstein D, Butler H, Cherry JM, Davis AP, Dolinski K, Dwight SS, Eppig JT, Harris MA, Hill DP, Issel-Tarver L, Kasarskis A, Lewis S, Matese JC, Richardson JE, Ringwald M, Rubin GM, Sherlock G (2000) Gene ontology: tool for the unification of biology. The Gene Ontology Consortium. Nat Genet 25(1):25–29. https://doi.org/10.1038/75556
Baker K, Dhillon T, Colas I, Cook N, Milne I, Milne L, Bayer M, Flavell AJ (2015) Chromatin state analysis of the barley epigenome reveals a higher-order structure defined by H3K27me1 and H3K27me3 abundance. Plant J Cell Mol Biol 84(1):111–124. https://doi.org/10.1111/tpj.12963
Blake VC, Birkett C, Matthews DE, Hane DL, Bradbury P, Jannink JL (2016) The triticeae toolbox: combining phenotype and genotype data to advance small-grains breeding. Plant Genome 9(2). https://doi.org/10.3835/plantgenome2014.12.0099
Bolser DM, Staines DM, Perry E, Kersey PJ (2017) Ensembl plants: integrating tools for visualizing, mining, and analyzing plant genomic data. Methods Mol Biol 1533:1–31. https://doi.org/10.1007/978-1-4939-6658-5_1
Carollo V, Matthews DE, Lazo GR, Blake TK, Hummel DD, Lui N, Hane DL, Anderson OD (2005) GrainGenes 2.0. An improved resource for the small-grains community. Plant Physiol 139(2):643–651. https://doi.org/10.1104/pp.105.064485
Colmsee C, Beier S, Himmelbach A, Schmutzer T, Stein N, Scholz U, Mascher M (2015) BARLEX—the barley draft genome explorer. Mol Plant 8(6):964–966. https://doi.org/10.1016/j.molp.2015.03.009
Comadran J, Kilian B, Russell J, Ramsay L, Stein N, Ganal M, Shaw P, Bayer M, Thomas W, Marshall D, Hedley P, Tondelli A, Pecchioni N, Francia E, Korzun V, Walther A, Waugh R (2012) Natural variation in a homolog of Antirrhinum CENTRORADIALIS contributed to spring growth habit and environmental adaptation in cultivated barley. Nat Genet 44(12):1388–1392. https://doi.org/10.1038/ng.2447
Deng W, Nickle DC, Learn GH, Maust B, Mullins JI (2007) ViroBLAST: a stand-alone BLAST web server for flexible queries of multiple databases and user’s datasets. Bioinformatics 23(17):2334–2336. https://doi.org/10.1093/bioinformatics/btm331
Dey S, Wenig M, Langen G, Sharma S, Kugler KG, Knappe C, Hause B, Bichlmeier M, Babaeizad V, Imani J (2014) Bacteria-triggered systemic immunity in barley is associated with WRKY and ETHYLENE RESPONSIVE FACTORs but not with salicylic acid. Plant Physiol 166(4):2133–2151
Finn RD, Attwood TK, Babbitt PC, Bateman A, Bork P, Bridge AJ, Chang HY, Dosztanyi Z, El-Gebali S, Fraser M, Gough J, Haft D, Holliday GL, Huang H, Huang X, Letunic I, Lopez R, Lu S, Marchler-Bauer A, Mi H, Mistry J, Natale DA, Necci M, Nuka G, Orengo CA, Park Y, Pesseat S, Piovesan D, Potter SC, Rawlings ND, Redaschi N, Richardson L, Rivoire C, Sangrador-Vegas A, Sigrist C, Sillitoe I, Smithers B, Squizzato S, Sutton G, Thanki N, Thomas PD, Tosatto SC, Wu CH, Xenarios I, Yeh LS, Young SY, Mitchell AL (2017) InterPro in 2017-beyond protein family and domain annotations. Nucleic Acids Res 45(D1):D190–D199. https://doi.org/10.1093/nar/gkw1107
Finn RD, Clements J, Arndt W, Miller BL, Wheeler TJ, Schreiber F, Bateman A, Eddy SR (2015) HMMER web server: 2015 update. Nucleic Acids Res 43(W1):W30–38. https://doi.org/10.1093/nar/gkv397
Finn RD, Coggill P, Eberhardt RY, Eddy SR, Mistry J, Mitchell AL, Potter SC, Punta M, Qureshi M, Sangrador-Vegas A, Salazar GA, Tate J, Bateman A (2016) The Pfam protein families database: towards a more sustainable future. Nucleic Acids Res 44(D1):D279–285. https://doi.org/10.1093/nar/gkv1344
Gene Ontology Consortium (2015) Gene ontology consortium: going forward. Nucleic Acids Res 43(D1):D1049–D1056
International Barley Genome Sequencing Consortium, Mayer KF, Waugh R, Brown JW, Schulman A, Langridge P, Platzer M, Fincher GB, Muehlbauer GJ, Sato K, Close TJ, Wise RP, Stein N (2012) A physical, genetic and functional sequence assembly of the barley genome. Nature 491(7426):711–716. https://doi.org/10.1038/nature11543
International Wheat Genome Sequencing Consortium (2014) A chromosome-based draft sequence of the hexaploid bread wheat (Triticum aestivum) genome. Science 345(6194):1251788. https://doi.org/10.1126/science.1251788
Kersey PJ, Allen JE, Armean I, Boddu S, Bolt BJ, Carvalho-Silva D, Christensen M, Davis P, Falin LJ, Grabmueller C, Humphrey J, Kerhornou A, Khobova J, Aranganathan NK, Langridge N, Lowy E, McDowall MD, Maheswari U, Nuhn M, Ong CK, Overduin B, Paulini M, Pedro H, Perry E, Spudich G, Tapanari E, Walts B, Williams G, Tello-Ruiz M, Stein J, Wei S, Ware D, Bolser DM, Howe KL, Kulesha E, Lawson D, Maslen G, Staines DM (2016) Ensembl Genomes 2016: more genomes, more complexity. Nucleic Acids Res 44(D1):D574–580. https://doi.org/10.1093/nar/gkv1209
Kurtz S (2003) The Vmatch large scale sequence analysis software. Ref Type: Computer Program:4–12
Lamesch P, Berardini TZ, Li D, Swarbreck D, Wilks C, Sasidharan R, Muller R, Dreher K, Alexander DL, Garcia-Hernandez M, Karthikeyan AS, Lee CH, Nelson WD, Ploetz L, Singh S, Wensel A, Huala E (2012) The Arabidopsis Information Resource (TAIR): improved gene annotation and new tools. Nucleic Acids Res 40 (Database issue):D1202–1210. https://doi.org/10.1093/nar/gkr1090
Lange M, Spies K, Colmsee C, Flemming S, Klapperstück M, Scholz U (2009) The LAILAPS search engine: a feature model for relevance ranking in life science databases. J Integr Bioinform 7(3):183–200
Lopes CT, Franz M, Kazi F, Donaldson SL, Morris Q, Bader GD (2010) Cytoscape Web: an interactive web-based network browser. Bioinformatics 26(18):2347–2348. https://doi.org/10.1093/bioinformatics/btq430
Martis MM, Zhou R, Haseneyer G, Schmutzer T, Vrana J, Kubalakova M, Konig S, Kugler KG, Scholz U, Hackauf B, Korzun V, Schon CC, Dolezel J, Bauer E, Mayer KF, Stein N (2013) Reticulate evolution of the rye genome. Plant Cell 25(10):3685–3698. https://doi.org/10.1105/tpc.113.114553
Mascher M, Gundlach H, Himmelbach A, Beier S, Twardziok SO, Wicker T, Radchuk V, Dockter C, Hedley P, Russel J, Bayer M, Ramsay L, Liu H, Haberer G, Zhang X-Q, Zhang Q, Barrero RA, Li L, Taudien S, Groth M, Felder M, Hastie AR, Simkova H, Stankova H, Vrana J, Chan S, Munoz-Amatriain M, Ounit R, Wanamaker S, Bolser DM, Colmsee C, Schmutzer T, Aliyeva-Schnorr L, Grasso S, Tanskanen J, Chailyan A, Sampath D, Heavens D, Clissold L, Cao S, Chapman B, Dai F, Han Y, Li H, Li X, Lin C, McCooke JK, Tan C, Wang P, Wang S, Yin S, Zhou G, Poland JA, Bellgard MI, Borisjuk L, Houben A, Dolezel J, Ayling S, Lonardi S, Kersey PJ, Langridge P, Muehlbauer G, Clark MD, Caccamo M, Schulman AH, Mayer KFX, Platzer M, Close TJ, Scholz U, Hansson M, Zhang G, Braumann I, Spannagl M, Li C, Waugh R, Stein N (2017) A chromosome conformation capture ordered sequence of the barley genome. Nature 544(7651):427
Mascher M, Muehlbauer GJ, Rokhsar DS, Chapman J, Schmutz J, Barry K, Munoz-Amatriain M, Close TJ, Wise RP, Schulman AH, Himmelbach A, Mayer KF, Scholz U, Poland JA, Stein N, Waugh R (2013a) Anchoring and ordering NGS contig assemblies by population sequencing (POPSEQ). Plant J Cell Mole Biol 76(4):718–727. https://doi.org/10.1111/tpj.12319
Mascher M, Richmond TA, Gerhardt DJ, Himmelbach A, Clissold L, Sampath D, Ayling S, Steuernagel B, Pfeifer M, D’Ascenzo M, Akhunov ED, Hedley PE, Gonzales AM, Morrell PL, Kilian B, Blattner FR, Scholz U, Mayer KF, Flavell AJ, Muehlbauer GJ, Waugh R, Jeddeloh JA, Stein N (2013b) Barley whole exome capture: a tool for genomic research in the genus Hordeum and beyond. Plant J Cell Mole Biol 76(3):494–505. https://doi.org/10.1111/tpj.12294
Mayer KF, Martis M, Hedley PE, Simkova H, Liu H, Morris JA, Steuernagel B, Taudien S, Roessner S, Gundlach H, Kubalakova M, Suchankova P, Murat F, Felder M, Nussbaumer T, Graner A, Salse J, Endo T, Sakai H, Tanaka T, Itoh T, Sato K, Platzer M, Matsumoto T, Scholz U, Dolezel J, Waugh R, Stein N (2011) Unlocking the barley genome by chromosomal and comparative genomics. Plant Cell 23(4):1249–1263. https://doi.org/10.1105/tpc.110.082537
Middleton CP, Senerchia N, Stein N, Akhunov ED, Keller B, Wicker T, Kilian B (2014) Sequencing of chloroplast genomes from wheat, barley, rye and their relatives provides a detailed insight into the evolution of the triticeae tribe. PLoS ONE 9(3):e85761. https://doi.org/10.1371/journal.pone.0085761
Moore G, Devos KM, Wang Z, Gale MD (1995) Cereal genome evolution. Grasses, line up and form a circle. Curr Biol CB 5(7):737–739
Munoz-Amatriain M, Lonardi S, Luo M, Madishetty K, Svensson JT, Moscou MJ, Wanamaker S, Jiang T, Kleinhofs A, Muehlbauer GJ, Wise RP, Stein N, Ma Y, Rodriguez E, Kudrna D, Bhat PR, Chao S, Condamine P, Heinen S, Resnik J, Wing R, Witt HN, Alpert M, Beccuti M, Bozdag S, Cordero F, Mirebrahim H, Ounit R, Wu Y, You F, Zheng J, Simkova H, Dolezel J, Grimwood J, Schmutz J, Duma D, Altschmied L, Blake T, Bregitzer P, Cooper L, Dilbirligi M, Falk A, Feiz L, Graner A, Gustafson P, Hayes PM, Lemaux P, Mammadov J, Close TJ (2015) Sequencing of 15 622 gene-bearing BACs clarifies the gene-dense regions of the barley genome. Plant J Cell Mole Biol 84(1):216–227. https://doi.org/10.1111/tpj.12959
Needleman SB, Wunsch CD (1970) A general method applicable to the search for similarities in the amino acid sequence of two proteins. J Mol Biol 48(3):443–453
Nussbaumer T, Kugler KG, Bader KC, Sharma S, Seidel M, Mayer KFX (2014) RNASeqExpressionBrowser-a web interface to browse and visualize high-throughput expression data. Bioinformatics 30(17):2519–2520. https://doi.org/10.1093/bioinformatics/btu334
Schmutzer T, Ma L, Pousarebani N, Bull F, Stein N, Houben A, Scholz U (2014) Kmasker–a tool for in silico prediction of single-copy FISH probes for the large-genome species Hordeum vulgare. Cytogenet Genome Res 142(1):66–78. https://doi.org/10.1159/000356460
Schulte D, Close TJ, Graner A, Langridge P, Matsumoto T, Muehlbauer G, Sato K, Schulman AH, Waugh R, Wise RP, Stein N (2009) The international barley sequencing consortium–at the threshold of efficient access to the barley genome. Plant Physiol 149(1):142–147. https://doi.org/10.1104/pp.108.128967
Smith TF, Waterman MS (1981) Identification of common molecular subsequences. J Mol Biol 147(1):195–197
Soderlund C, Longden I, Mott R (1997) FPC: a system for building contigs from restriction fingerprinted clones. Comput Appl Biosci CABIOS 13(5):523–535
Spannagl M, Nussbaumer T, Bader KC, Martis MM, Seidel M, Kugler KG, Gundlach H, Mayer KF (2016) PGSB PlantsDB: updates to the database framework for comparative plant genome research. Nucleic Acids Res 44(D1):D1141–1147. https://doi.org/10.1093/nar/gkv1130
Tello-Ruiz MK, Stein J, Wei S, Youens-Clark K, Jaiswal P, Ware D (2016) Gramene: a resource for comparative analysis of plants genomes and pathways. Methods Mol Biol 1374:141–163. https://doi.org/10.1007/978-1-4939-3167-5_7
Tomato Genome Consortium (2012) The tomato genome sequence provides insights into fleshy fruit evolution. Nature 485(7400):635–641
Vilella AJ, Severin J, Ureta-Vidal A, Heng L, Durbin R, Birney E (2009) EnsemblCompara GeneTrees: complete, duplication-aware phylogenetic trees in vertebrates. Genome Res 19(2):327–335. https://doi.org/10.1101/gr.073585.107
Yang P, Lupken T, Habekuss A, Hensel G, Steuernagel B, Kilian B, Ariyadasa R, Himmelbach A, Kumlehn J, Scholz U, Ordon F, Stein N (2014) Protein Disulfide Isomerase Like 5-1 is a susceptibility factor to plant viruses. Proc Natl Acad Sci USA 111(6):2104–2109. https://doi.org/10.1073/pnas.1320362111
Zhang Z, Schwartz S, Wagner L, Miller W (2000) A greedy algorithm for aligning DNA sequences. J Comput Biol 7(1–2):203–214. https://doi.org/10.1089/10665270050081478
Author information
Authors and Affiliations
Corresponding author
Editor information
Editors and Affiliations
Rights and permissions
Copyright information
© 2018 Springer International Publishing AG, part of Springer Nature
About this chapter

Cite this chapter
Beier, S., Bolser, D.M., Scholz, U., Spannagl, M., Kersey, P.J. (2018). Databases and Tools for the Analysis of the Barley Genome. In: Stein, N., Muehlbauer, G. (eds) The Barley Genome. Compendium of Plant Genomes. Springer, Cham. https://doi.org/10.1007/978-3-319-92528-8_21
Download citation
DOI: https://doi.org/10.1007/978-3-319-92528-8_21
Published:
Publisher Name: Springer, Cham
Print ISBN: 978-3-319-92527-1
Online ISBN: 978-3-319-92528-8
eBook Packages: Biomedical and Life SciencesBiomedical and Life Sciences (R0)