
Abstract
The electrocardiogram (ECG) is a graphical representation of the electrical activity of the heart. It is an important tool in the care of many patients with potential cardiovascular disease. Learning ECG interpretation logically starts with knowing the normal ECG and its normal variants. The cardiovascular system changes, like most biological systems do as the child grows towards adulthood. This chapter reviews the normal behavior of electrical changes throughout the cardiac cycle and the expected normal ECG findings of various ages as well as the variants of normal ECG.
Access provided by Autonomous University of Puebla. Download chapter PDF
Keywords
- Ventricular Repolarization
- Wave Axis
- Ventricular Depolarization
- Atrial Depolarization
- Left Ventricular Hypertrophy Criterion
These keywords were added by machine and not by the authors. This process is experimental and the keywords may be updated as the learning algorithm improves.
Developing a Systematic Approach
The electrocardiogram (ECG) is a graphical representation of the electrical activity of the heart. It is an important tool in the care of many patients with potential cardiovascular disease. Therefore, when approaching an ECG, it is essential to interpret each one in the same, systematic way in order to avoid missing important findings.
A typical approach to follow would include these steps:
-
1.
Assess patient demographics (age, gender, and sex)
-
2.
Standardization
-
3.
Rate
-
4.
Axis
-
(a)
P axis
-
(b)
QRS axis
-
(c)
T axis
-
(a)
-
5.
Rhythm
-
6.
AV conduction
-
(a)
P wave
-
(b)
PR interval
-
(a)
-
7.
Ventricular conduction
-
(a)
QRS complex
-
(b)
QRS duration
-
(c)
ST segment and T wave
-
(d)
QT interval
-
(e)
JT Interval
-
(f)
U waves
-
(a)
-
8.
Evaluation for chamber enlargement or hypertrophy
Patient Demographics and Impact on Interpretation
Patient demographics are important to consider when interpreting ECGs, particularly in the pediatric population. Age, sex, race, and even body habitus can all have an effect on a patient’s ECG.
Age
One must consider the patient’s age during ECG interpretation as the normal values for the heart rate, measured intervals, axis, and voltage criteria are adjusted with age [see]. Heart rate is fastest at birth and then progressively decreases until the teenage years when patients reach their adult resting heart rate.
Davignon et al. published a study of 2,141 white Canadian children ages 0–16 years. The authors divided the patient population into 12 age groups to establish standard values for ECGs in normal children [1]. Similar trends have been noted in other recent studies [2–4]. The following observations were noted:
-
1.
Heart rate – The mean heart rate increased from day one of life to the first month of age and then showed a slow decrease from 3 months of age on. The highest heart rate was recorded between 1 and 3 months of age with an average heart rate of 150 beats per minute.
-
2.
QRS axis – QRS axis has been shown to vary with age as well, with the QRS axis for the first week of life on average being 135° and decreasing to 60° by 3–6 months of age.
-
3.
P wave amplitude – The P wave amplitude in lead V2 shows a gradual decrease with age.
-
4.
PR interval – The PR interval remains stable until approximately 3 months of age and then it gradually increases. The PR interval also increases as the heart rate decreases.
-
5.
R and S wave amplitudes – R wave amplitude decreases with age in leads V3R and V1 and increases in lead V7, while the S wave shows an inverse trend. This leads to an overall steady decrease in the R/S ratio in leads V3R and V1 and increased R/S ratio in leads V6 and V7 with increased age.
-
6.
QRS duration – The QRS duration increases with age and varies with heart rate.
-
7.
Q wave amplitude – Maximum Q wave amplitudes are seen until age 1–3 years and then gradually decrease.
-
8.
T wave changes – The T wave in leads VI and V3R is upright at birth. Between 3 and 7 days of life, the T wave becomes negative. The T wave will remain negative until 3–8 years of age when it becomes positive.
-
9.
QTc interval – There is a small increase with age.
Body Habitus
Body habitus can have a major effect on QRS voltages. The adipose tissue can act as a form of insulation between the heart’s electrical conduction and the ECG electrodes. With an increased distance from the heart to the ECG electrode, an ECG may appear to have lower overall voltage [5]. Studies performed in the adult population have shown that patients with hypertension and obesity could potentially not meet criteria for left ventricular hypertrophy (LVH) depending on the LVH criteria used for ECG interpretation [6, 7]. In 2012, Nasir et al. reported on 55,218 adult patients age 18–35 years and found that in patients with a BMI ≥18.5 kg/m2, there was a decrease in R wave voltage as BMI increased and there was an increased R wave voltage with decreased BMI in patients with BMI <18.5 kg/m2 [8].
Gender
Davignon et al. reported differences in ECG parameters found between males and females. A significant difference was noted in R wave amplitude between the sexes and suggested this value be stratified not only by age but also by sex [1]. Rijnbeek also documented a difference in Q, R, and S wave amplitudes showing that they were all significantly larger in males compared to females. It was also noted that the QRS duration is longer in males. On the other hand, the QTc (corrected QT interval) remained relatively stable across the age spectrum, but at approximately 15 years of age, normal females have a slightly longer QTc when compared to males [4].
Race
Normal values of QRS voltage can differ by race. In 1985, a study of 15–19-year-old children revealed that African American male patients have been shown to have a higher upper limit of normal QRS voltage compared to European-descended Americans [9]. In a separate study of North American white, black, and Hispanic patients, there was also a higher limit of normal QRS voltage for African American patients compared to white patients. This was seen in both men and women, but in women, it was only evident in women >34 years of age. In comparison to white patients, Hispanic men and women were noted to have a lower limit of normal for QRS voltage [10].
Standardization
The ECG signal is standardized so that 1 mV deflection is equal to 10 mm in height (full standardization). The standardization is marked at the beginning of the ECG with a calibration signal that produces a rectangle that is two big boxes tall (10 mm) and five small boxes wide (25 mm).
Occasionally when the voltages are high, the gain can be adjusted to “half standardization.” In this setting, 1 mV = 1 big box (5 mm); therefore, the voltage complex has to be multiplied by two for calculations. On the other hand, “double standardization” can be set in cases where the voltages are too small, in this setting 1 mV = 4 big boxes (20 mm). In this case, the voltage complex has to be divided by two for calculations (Fig. 1.1).

Examples of common standardization. (a) Full standardization. (b) Examples of double standardization and half standardization
Other modes of standardization are less frequently used (Fig. 1.2). In each case of standardization, calculation must take in consideration the type of standardization and the leads it affects. The examples shown in Fig. 1.2 suggest that not all leads are standardized equally and as such calculation of actual heights and depths of ECG waves must be corrected accordingly.

Examples of less common standardization: (a) Limb leads normal standardization and precordial leads half standardization. (b) Precordial leads normal standardization and limb leads half standardization. (c) Limb leads normal standardization and precordial leads double standardization. (d) Precordial leads normal standardization and limb leads double standardization
Rate and Rhythm
Rate
Each ECG is printed on gridded paper, which has a speed of 25 mm per second. Each small box is 1 mm and represents 0.04 s. Thus, each large box is 5 mm and 0.2 s (Fig. 1.3).

Each large box (5 mm) on ECG grid paper is equivalent to 0.2 s
Rate is calculated by measuring either the P-P or R-R interval. The interval should be measured from the beginning of either the P wave or the QRS wave to the beginning of the next corresponding wave. Measuring from the peak of either wave can be inaccurate in patients with abnormal conduction (Fig. 1.4).

Example ECG. The distance between the two large arrows is 11 small boxes or 0.44 s. To calculate beats per minute: 60/0.44 = 136 beats per minute
Lead II is typically used to calculate the rate. This lead is usually one of the leads used to record the rhythm strip located at the bottom of the ECG. A different lead can be considered if the tracing has fewer artifacts than lead II.
In order to estimate the heart rate quickly, several different techniques can be used:
-
1.
For slower rates, the number of large boxes is divided by 300 (Fig. 1.5).
Fig. 1.5 
Five large boxes between QRS’s: 300/5 = 60. Estimated rate is 60 bpm
-
2.
For faster heart rates, the number of QRS complexes is counted within six large boxes (1.2 ms) and multiplied by 50 (Fig. 1.6).
Fig. 1.6 
Three QRS complexes within 6 large boxes: 50 × 3 = 150. Estimated rate 150 bpm
-
3.
For rapid calculation, the number of large boxes between two consecutive R-R intervals is measured (Fig. 1.7):
Fig. 1.7 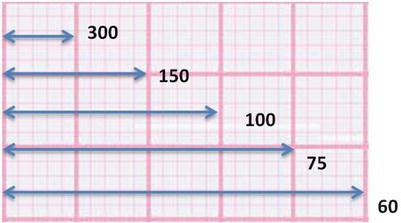
Heart rate calculation can be quickly estimated by counting the number of large boxes between two consecutive R-R intervals. Heart rate is listed in beats per minute
-
1.
Box = 0.2 s 60/0.2 = 300 bpm
-
2.
Boxes = 0.4 s 60/0.4 = 150 bpm
-
3.
Boxes = 0.6 s 60/0.6 = 100 bpm
-
4.
Boxes = 0.8 s 60/0.8 = 75 bpm
-
5.
Boxes = 1 s 60/1 = 60 bpm
-
1.


The heart rate is variable in the normal heart. It is regulated by both the parasympathetic and sympathetic nervous systems. Parasympathetic activity (vagal nerve stimulation) will lead to decreased heart rate, and sympathetic activity leads to an increased heart rate. At rest, parasympathetic input is higher and the heart rate will be lower. With activity, the sympathetic tone is higher and the heart rate will be increased [11].
The heart rate in the pediatric population varies with age (Appendix 1). In adults, tachycardia is defined as a heart rate greater than 100 bpm and bradycardia as less than 60 bpm. For children, this must be defined by a heart rate greater than the upper limit of normal (tachycardia) or less than the lower limit of normal (bradycardia).
Rhythm
The normal rhythm of the heart is called a sinus rhythm, in which, cardiac impulses originate from the sinoatrial (SA) node.
Criteria for sinus rhythm:
-
1.
Normal P wave axis and morphology
-
2.
A single P wave before every QRS
-
3.
A single QRS following each P wave
Axis: P Wave, QRS, and T Wave
This section is further detailed in Chap. 3. ECG recordings can provide information about the direction and magnitude of various complexes. The electric axis (direction of the net electric force in the heart) can change in different cardiac conditions such as mechanical shifts, chamber enlargement or hypertrophy, or conduction disturbances.
In order to assess the axis on an ECG, knowledge of the normal vectoral forces of each lead is essential (Fig. 1.8).

Normal vectoral forces for each limb lead
P Wave Axis
The P axis is the mean vector of atrial depolarization. A normal P wave axis is one criterion for a sinus rhythm. A sinus P wave is an atrial depolarization originating from the sinoatrial node. The electrical activity generated is moving from the high right atrium to low septal right atrium and in general is moving from the right side of the heart to a leftward direction. Based on this information, a sinus P wave will appear as a positive P wave in leads I, II, and aVF and negative in lead aVR. This generates an axis of 0 to +90° (Fig. 1.9).

(a) ECG tracings for leads I, aVF, and II. Upright P wave in leads I, II and aVF suggest a normal axis of about 60°. (b) Vectoral estimate
QRS Axis
The QRS axis is the mean vector of ventricular depolarization. The dominating ventricular depolarization forces in the newborn are right-sided forces, and thus, the axis will be rightward in the normal newborn ECG. Over time, the forces of the heart become predominantly left sided and the axis will shift left compared to the newborn [1] (Appendix, Table 1). To determine QRS axis, leads I, II, and aVF are usually examined (Figs. 1.10 and 1.11).

(a) Leads I, II, and aVF from a 1-day-old patient. The net deflection in lead I is negative. The net deflection in lead II is negative. The net deflection in lead aVF is positive. (b) The overall vector is directed to a QRS axis of approximately 120° (+90° – +180°)

(a) Leads I, II, and aVF from a 16-year-old patient. The net deflection in lead I is positive. The net deflection in lead II is positive. The net deflection in lead aVF is positive. (b) The overall vector is directed to a QRS axis of approximately 600 (00 - +900)
T Wave Axis
The T wave axis is the mean vector of ventricular repolarization. The T wave axis is −40° to +100° between 0 and 7 days of life. By approximately 1 month of age, patients will reach the adult T wave axis of 0° to +90°. The QRS-T angle is the angle formed between the QRS axis and T wave axis. Abnormal QRS-T angle may occur in ventricular hypertrophy with strain or ventricular conduction abnormalities.
Abnormal T wave axis may be associated with:
-
1.
Ventricular hypertrophy with strain
-
2.
Myocarditis
-
3.
Pericarditis
-
4.
Myocardial ischemia
-
5.
Bundle branch block
Atrioventricular (AV) Conduction
P Wave
The P wave represents atrial depolarization. It can take on different morphologies, but the typical P wave is characterized by a symmetric mound-shaped wave. Biphasic and notched P waves can also be seen in children. The duration of the P wave should be no longer than 0.08 s in children less than 12 months of age or 0.1 s in older children [12] (Fig. 1.12).

Lead I of an ECG tracing demonstrating normal P waves
PR Interval
The conduction from the atria to ventricle is represented by the PR interval. As previously noted, the PR interval does change with age and heart rate (refer to PR intervals by age and heart rate in Appendix, Tables 1, 2). It is best assessed in lead II. The PR interval is calculated by measuring from the beginning of the P wave to the first deflection of the QRS (negative deflection if a Q wave or positive if an R wave) (Fig. 1.13).

ECG from a 16-year-old with a PR interval of 160 ms
Interventricular Conduction
The QRS Complex
The QRS complex represents ventricular depolarization (Fig. 1.14).

ECG tracing of the QRS complex
-
The Q wave is characterized by the first downward/negative deflection from the baseline.
-
The R wave is an upward/positive infliction from the baseline.
-
The S wave is a downward/negative deflection from the baseline that occurs after the R wave.
If there is an upward/positive deflection that occurs after the S wave, this is referred to as an R’. An R’ can be found in approximately 5 % of the healthy population (Fig. 1.15).

ECG tracing demonstrating an RSr’ pattern
Capitalized letters indicate a major deflection from the baseline, and lowercase letters indicate a minor deflection from the baseline. A deflection is considered minor if it is less than one-half the amplitude of a major deflection.
Q Waves
The Q wave represents the left to right depolarization of the ventricular septum. Although Q waves are considered an abnormal finding in the adult population, they can be a benign finding in the pediatric population. It is commonly seen in the inferior leads (II, III, aVF) and the lateral leads (I, V5, V6). To distinguish normal from abnormal Q waves, assess the amplitude and duration.
Normal Q waves are small and narrow. It is usually less than one small box (1 mm) wide and no more than two small boxes (2 mm) deep, although leads III and aVR may have deeper Q waves that are still normal.
An important example to note of abnormal Q waves is the EKG finding of patients with anomalous left coronary artery from the pulmonary artery (ALCAPA). These patients will have deep, abnormal Q waves in leads I and aVL. This is an indication of left ventricular ischemia [13].
QRS Duration
The QRS duration is the time required for ventricular depolarization. It is measured from the beginning of the Q wave to the end of the S wave (Fig. 1.16). As previously noted, the QRS duration increases with age (due to the increase the ventricular muscle mass) and decreased heart rate. The QRS duration is best assessed in lead V5 (Appendix, Table 1).

Normal QRS duration of 66 ms in a 4-year-old child
R and S Wave Amplitude
R and S wave amplitude should be examined in each patient in order to determine if there is potential ventricular hypertrophy (Appendix 1).
ST Segment and T Waves
The ST segment represents the time between the S wave (end of ventricular depolarization) and T wave (ventricular repolarization). The ST segment is usually at the same level as the baseline (determined by the PR segment). It can be considered normal to have an upward slanting of the ST segment. This is commonly referred to as early repolarization (Fig. 1.17).

ECG from a 17-year-old with early repolarization. Note the ST segment maintains an upward angle
The T wave represents ventricular repolarization. It is usually asymmetric and has low amplitude. The T wave is best assessed in the lateral precordial leads (V4–V6). The amplitude does vary by age. The T wave in lead V1 will have a positive deflection in the newborn and become negative during the first week of life. It will remain negative until early adolescence where it may become positive again [1, 15].
A T wave is generally considered low voltage when it is less than 2 mm and high voltage if it is greater than 7 mm in a limb lead or 10 mm in a precordial lead [12] (Fig. 1.18).

Tall peaked T waves seen in the mid-precordial leads of a patient with diabetic ketoacidosis
QT Interval
The QT Interval represents the time of ventricular depolarization and repolarization. Abnormal QT interval has been associated with serious ventricular arrhythmias. It is measured as the distance from the onset of the QRS complex to the end of the T wave. The QT interval is most accurately measured from leads II and V5. The QT interval varies with heart rate. This variation can be corrected by using the Bazett’s formula [14].

The QTc is considered normal if it is <450 ms. In adolescent females, QTc is normal if it is <460 ms. There is currently no universally accepted lower limit for QTc. While there is a disease known as short QT syndrome, it is extremely rare and much less common than long QT syndrome. QTc measurements <330 for a male or <340 for a female would be concerning.
JT Interval
In patients with ventricular conduction defects, the QT interval may be prolonged due to the long QRS duration (Fig. 1.19). Therefore, JT interval has been proposed as a more appropriate measure of ventricular repolarization than the QT. The JT interval represents the true ventricular repolarization. It is measured from the J point to the end of the T wave [16, 17].

ECG tracing demonstrating the location of the J point and JT interval
Like the QT interval, the JT interval can also be corrected for rate using Bazett’s formula. This will calculate a JTc.

U Waves
U waves are positive deflections found after the T wave and before the next atrial depolarization (P wave). The origin of this wave remains controversial. Normal U waves are less than one-half the amplitude of the T wave. They are more appreciated in the mid-precordial leads and in patients with slower heart rates. The ascent of the U wave is typically shorter than the descent [18, 19]. Normal U waves should not be included in the measurement of the QT interval (Fig. 1.20).

ECG from a 16-year-old with no heart disease
References
Davignon A, Rautaharju P, Boisselle E, et al. Normal ECG standards for infants and children. Pediatric Cardiol. (1979–1980);131:123–31.
Semizel E, Oztürk B, Bostan OM, et al. The effect of age and gender on the electrocardiogram in children. Cardiol Young. 2008;18(1):26–40.
Macfarlane PW, McLaughlin SC, Devine B, et al. Effects of age, sex, and race on ECG interval measurements. J Electrocardiol. 1994;27(Suppl):14–9.
Rijnbeek PR, Witsenburg M, Schrama E, et al. New normal limits for the paediatric electrocardiogram. Eur Heart J. 2001;22:702–11.
Hancock EW, Deal BJ, Mirvis DM, et al. AHA/ACCF/HRS recommendations for the standardization and interpretation of the electrocardiogram: part V: electrocardiogram changes associated with cardiac chamber hypertrophy: a scientific statement from the American Heart Association Electrocardiography and Arrhythmias Committee, Council on Clinical Cardiology; the American College of Cardiology Foundation; and the Heart Rhythm Society: endorsed by the International Society for Comperturized Electrocardiography. Circulation. 2009;119:e251–61.
Okin PM, Jern S, Devereux RB, et al. Effect of obesity on electrocardiographic left ventricular hypertrophy in hypertensive patients: the Losartan Intervention For Endpoint (LIFE) Reduction in Hypertension Study. Hypertension. 2000;35(1):13–8.
Abergel E, Tase M, Menard J, et al. Influence of obesity on the diagnostic value of electrocardiographic criteria for detecting left ventricular hypertrophy. Am J Cardiol. 1996;77(9):739–44.
Nasir JM, Rubal BJ, Jones SO, et al. The effects of body mass index on surface electrocardiograms in young adults. J Electrocardiol. 2012;45(6):646–51.
Rao PS. Racial differences in electrocardiograms and vectorcardiograms between black and white adolescents. J Electrocardiol. 1985;18(4):309–13.
Rautaharju PM, Zhou SH, Calhoun HP. Ethnic differences in ECG amplitudes in north american white, black, and Hispanic men and women. Effect of Obesity and Age. J Electrocardiol. 1994;27:20–31.
Shaffer F, McCraty R, Zerr CL. A healthy heart is not a metronome: an integrative review of the heart’ s anatomy and heart rate variability. Front Psychol. 2014;5:1–19.
Garson A. The electrocardiogram in infants and children: a systematic approach. Philadelphia: Pennsylvania; 1983.
Shapiro J, Boxer R, Krongrad E. Echocardiography in infants with anomalous origin of the left coronary ARtery. Pediatr Cardiol. 1979;28:23–8.
Rautaharju PM, Surawicz B, Gettes LS. AHA/ACCF/HRS recommendations for the standardization and interpretation of the electrocardiogram: part IV: the ST segment, T and U waves, and the QT interval: a scientific statement from the American Heart Association Electrocardiography and Arrhythmias Committee, Council on Clinical Cardiology; the American College of Cardiology Foundatiion; and the Heart Rhythm Society: endorsed by the International Society for Comperturized Electrocardiography. Circulation. 2009;119:e241–50.
Dickinson DF. The normal ECG in childhood and adolescence. Heart. 2005;91(12):1626–30.
Rautaharju PM, Zhang ZM, Prineas R, et al. Assessment of prolonged QT and JT intervals in ventricular conduction defects. Am J Cardiol. 2004;93(3):1017–21.
Chiladakis J, Kalogeropoulos A, Koutsogiannis N, et al. Optimal QT/JT interval assessment in patients with complete bundle branch block. Ann Noninvasive Electrocardiol. 2012;17:268–76.
Surawicz B. U wave: facts, hypotheses, misconceptions, and misnomers. J Cardiovasc Electrophysiol. 1998;9:1117–28.
Eyer K. Support for a mechanico-electrical source of the “U” wave. J Electrocardiol. 2015;48(1):31–2.
Author information
Authors and Affiliations
Corresponding author
Editor information
Editors and Affiliations
Rights and permissions
Copyright information
© 2016 Springer International Publishing Switzerland
About this chapter
Cite this chapter
Wilhelm, C.M., Khalid, O. (2016). The Normal Electrocardiogram. In: Abdulla, Ri., Bonney, W., Khalid, O., Awad, S. (eds) Pediatric Electrocardiography. Springer, Cham. https://doi.org/10.1007/978-3-319-26258-1_1
Download citation
DOI: https://doi.org/10.1007/978-3-319-26258-1_1
Published:
Publisher Name: Springer, Cham
Print ISBN: 978-3-319-26256-7
Online ISBN: 978-3-319-26258-1
eBook Packages: MedicineMedicine (R0)