
Abstract
Biologic recognition is critical for cell growth, its differentiation and a number of other physiological processes. Lectin carbohydrate interactions mediate and regulate these cellular processes. Hence they have attracted a lot of attention recently. Amongst lectins, those from legumes are the most widely studied. Herein, we report our findings based on the influence of amino acid constitution in maintaining the structural integrity and sugar binding specificity of these lectins. We have implemented a pattern recognition system represented by heatmaps and clustergrams. Percentage identity and amino acid composition of 46 legume lectins were computed to distinguish between different sugar specific lectins and derive a consensus amongst them. A clear distinction was apparent between different monosaccharide binding groups based on their composition, sequence identities and the specific amino residues in their combining sites.
Access provided by Autonomous University of Puebla. Download conference paper PDF
Introduction
Lectins are proteins of non immunologic origin that bind to carbohydrates with high fidelity. Lectins form a large class of multivalent recognition molecules that specifically interact with their cognate sugar moieties for decoding the information underlying the structural heterogeneity (Sharon and Lis 2004). Although, their occurrence in nature was known only during the early nineteenth century, by 1960s, tremendous research in this field was carried out to explore their functional importance in a range of biologic processes, both across plant and animal kingdom. However, the plant lectins were the most extensively studied (da Silva and Correia 2014), among which those from legume in particular were foremost to be investigated and were found to be a rich source of lectins and are most widely studied.
Legume lectins have been pivotal to the study of the molecular basis of protein carbohydrate interactions (Sharon and Lis 1995). They are a large family of homologues proteins possessing great overall similarities in terms of their physical, chemical and biological properties, despite their origin from different taxonomically distant species. They display remarkable divergence in their carbohydrate specificities ranging from monosaccharides to oligosaccharides. Some legume lectins are synthesized as prolectins in the endoplasmic reticulum and undergo post translational modifications in the Golgi apparatus to function as secretory proteins (Moreira et al. 2013).
Since the advent of recombinant techniques in 1970s, intensified studies were performed for determining the physico-chemical and physiological properties of lectins, amino acid sequences and elucidating their 3D structures. The 3D structure of concanavalin A amongst legume lectins was the first lectin for which a high resolution X-ray crystallographic structure became available (Edelman et al. 1972). Soon thereafter 3D structures for a diverse group of lectins were elucidated.
The basic architecture of the protomer is the “lectin fold”, which is related to the “jelly-roll fold” comprising three anti-parallel sandwiched β sheets which are connected by α turns, β turns and bends along with short loops. The three anti-parallel β sheets constitute a flat six stranded “back” sheet, a concave seven stranded “front” sheet and a short “top” sheet which holds the two sheets together (Fig. 13.1). They are usually devoid of α helices with the exception of occasional 310 helices. Each protomer is dome shaped with dimensions of 42 × 40 × 39 Å and molecular weight of 25–30 kDa. The carbohydrate recognition domain (CRD) is a shallow depression on the surface located at the apex of the dome like structure, accessible to both monosaccharides and oligosaccharides for binding (Sharon and Lis 2002). The basic architecture of CRD in legume lectins constitute four binding site loops A, B, C, D, which are adjacent to each other in the pocket in the 3D structure but are not close together in the sequence. The residues in the binding pocket are known to show the greatest variability and are inferred to be involved in specificity determination (Young and Oomen 1992; Benevides et al. 2012). The floor of the binding site consists of few conserved key amino acids residues in the loops including Asp in Loop A, Gly or Arg (in Concanavalia and Dioclea lectins) in Loop B, Asn and an aromatic residue in Loop C, which contribute to hydrogen bonds and vander Waals interactions with the sugar. The variation in loop C and D is possibly a primary determinant of the monosaccharide specificity (Sharma and Surolia 1997; Rao et al. 1998). The CRD in these lectins lies in close proximity with the metal binding sites and require Ca2+ and transition metal ion Mn2+ for their binding activity (Etzler et al. 2009).


(a) Structure of Canavalia A as a model for legume lectin fold represented as cartoon. (b) Binding site loops A, B, C and D of Canavalia with mannose in its carbohydrate recognition domain
Despite emulating a common β-sandwich fold, variability among the legume lectins occurs both at the level of the quaternary fold, with a variety of dimeric and tetrameric arrangement (Srinivas et al. 2001; Manoj and Suguna 2001) and at the level of the binding site. Other modes of interaction that contribute to the variability in specificity are interaction with water, post translational modification, carbohydrate-aromatic interactions, etc. Thus, classification of lectins into distinct groups based on their monosaccharide specificity that is the best hapten inhibitor of the lectin and its extrapolation it to amino acid sequence variations will shed light on the features of the design of their combining sites.
So far, the relationship between the variation of the amino acid composition of legume lectins in the context of their diverse specificities has been examined only to a limited extent in the past (Swamy et al. 1985). In this piece of work, we identify broad features that allow generation of a spectrum of specificities in them without a fundamental alteration of their 3D structural fold. For this, we employ a new approach to simultaneously visualize and analyse the amino acid variations in 46 legume lectins categorized under five different sugar specific groups through pattern recognition method using heatmaps.
Methodology
-
1.
Generation of dataset of 3D structures
Nearly 1,094 plant lectins belonging to leguminosae family were deposited (with 159 unique source entries) in the comprehensive database of UNIPROT (http://www.uniprot.org/) with amino acid sequence and functional information. Of which, 235 PDB structures have been deposited in the Protein Data Bank (http://www.rcsb.org/pdb/home/home.do), where each lectin has been complexed with one or more ligands (Berman et al. 2000). For this study, a set of 46 legume lectins were short-listed from the large dataset based on “unique source” as the criteria and whose 3D structures were elucidated.
These legume lectins were categorize into five groups according to their monosaccharide specificity, i.e. (1) Mannose/Glucose (MG), (2) Galactose (GA), (3) N-acetyl-Glucosamine (GLN), (4) N-Acetyl-Galactosamine (GAN) and (5) Fucose (FU), based on the literature. Table 13.1 provides the complete details of 46 lectins along with their source and monosaccharide specificity and PDB IDs. The final dataset constitutes 24 MG, 1 GLN, 8 GA, 10 GAN and 3 FU lectins.
Table 13.1 Dataset of 46 legume lectins considered in this study -
2.
Obtaining amino acid sequences
Complete canonical sequences were only selected for these entries and retrieved in “FASTA format” from RCSB-PDB. Chain A was only chosen to maintain consistency in the data, except for the lectins with PDB IDs: 1LEN, 1LOB, 2B7Y and 2LTN, we have considered both chains A and B as they were fragments of the same protomer which had been truncated. As the lectins belonging to the genus Canavalia, Dioclea, Cratylia and Cymbosema of MG group exhibit circular homology, their sequences were manually re-transposed to align them with other sequences of legume lectins.
-
3.
Protein secondary structure prediction using PSSPRED
For the secondary structure prediction, PSSPRED (Protein Secondary Structure PREDiction server), a webserver (http://zhanglab.ccmb.med.umich.edu/PSSpred/) was employed based on the Rumelhart error back-propagation method (Xu and Zhang 2013) using amino acid sequence. This tool uses a simple neural network training algorithm for accurate prediction (Zhang 2012). Based on these calculations, the amino acid sequence of the four binding site loops were determined for the lectin dataset.
-
4.
Multiple sequence alignment and analysis
Multiple sequence alignment was performed using ClustalW2 (http://www.ebi.ac.uk/Tools/msa/clustalw2/) (Larkin et al. 2007), using all default parameters. BLOSUM protein weight matrix was employed along with penalties for GAP opening as 10, GAP extension as 0.20 and a GAP distance penalty as 5.
-
5.
Phylogenetic analysis of legume lectins
Phylogenetic analysis was based on amino acid sequence alignment. Multiple sequence alignments were performed for the entire set of 46 lectins considering the complete sequences as well as only the amino acid sequences of binding site loops using ClustalW2. For this, alignment was generated using PAM matrix with all other default settings. For phylogenetic analysis based on sequence alignment, a software tool MEGA6 (Molecular Evolutionary Genetics Analysis) (Tamura et al. 2013) was used, in which the output sequence alignment file was provided as input for inferring phylogenetic trees.
-
6.
Calculation of percentage identity matrix
Pairwise percentage identity scores for all the 46 lectins and their respective binding sites were computed based on the sequence alignment in ClustalW2. The alignment scores were rearranged as a matrix to indicate the pairwise identity scores calculated between every pair of sequences among the legume lectin dataset. These indicate the number of identities between the two sequences, divided by the length of the alignment, and represented as a percentage.
-
7.
Computation of amino acid composition
Amino acid composition of the complete protein and only the binding site loops were computed separately. ProtParam, a webserver (http://web.expasy.org/protparam/) was employed to obtain the percentage compostion of each amino acid in a given protein sequence (Gasteiger et al. 2005). Similarly, this procedure was repeated for the four binding site loops. The values were tabulated into a 20 × 46 matrix to generate a clustergram for the same.
-
8.
Pattern recognition and clustering
In order to demonstrate characteristic features among sugar specific lectin groups, we computed heatmaps to display specific patterns in the entire lectin structure and particularly binding site, based on two aspects: (1) Percentage identities to demonstrate (dis)similarities and (2) Percentage amino acid compositions to study the significance of amino acid variation. Heatmaps were generated using MATLAB v7.5 (MathWorks 2007) (Distance measure: Euclidean). Clustergrams based on amino acids were also generated by employing Kmeans clustering algorithm (MacQueen 1967; Weisstein 1995) using a function module CVAP 3.7 (Cluster Validity Analysis Platform) in MATLAB v7.5.
Results and Discussion
In the present study, we have employed pattern recognition for demonstrating the influence of amino acid variability on legume lectin specificity. Pattern recognition allows making inferences from observations using a statistical approach. Pattern recognition enables discrimination between seemingly similar entities based on their quantitative features (Duin and Pekalska 2007). Accordingly, we have used heatmaps and clustergrams to highlight the characteristic features of each of the five lectin groups classified based on their monosaccharide binding abilities.
(Dis)similarites in Legume Lectins Based on Percentage Identities
Figure 13.2 shows the percentage identity matrix as a heatmap, the top diagonal half computed based on binding site loops and the lower second half represents the full lectin sequences. From the heatmap, it is evident that there is a clear demarcation between the five groups of legume lectins, which were differentiated based on their pair wise comparisons. We observed that the overall percentage identity for the entire protein across 46 lectins was in the range of 28.24–100 %, while it was only 14.29–100 % for the binding site loops. This clearly represents the variability in the carbohydrate binding site residues relative to the whole protein sequence, with the highest identities shared among the same species in the same sugar specific group. The intra-group percentage identities for the MG specific proteins was found to be between 35.68 and 100 %; 33.78 and 96.65 % for GA, 37.78 and 61.61 % for GAN and 35.71 and 36.89 % for FU lectins. Similarly, the identities between the amino acids of binding site loops fall in the range of 21.05–100 % for MG; 17.07–98.04 % for GA; 20.83–56.6 % for GAN and 14.49–34 % for FU binding legume proteins. Table 13.2 illustrates the inter-group percentage identities across the five different groups of legume lectins.


Heatmap generated for 46 legume lectins using percentage identity matrix. The upper diagonal half represents the identities computed for the four binding site loops and the lower diagonal half is based on the full protein sequence
-
1.
MG lectin group: This set includes lectins from Canavalia sp., Dioclea sp., Cratylia sp., Cymbosema sp., Camptosema sp., Bowringia, Platypodium, Pterocarpus, Lens culinaris, Pisum sativum, Vicia faba and Lathyrus ochrus I. There are seven Canavalia sp. in the dataset, which shared more than 97 % intra-species identity and in particular, three lectins (PDB ID: 1I3H, 3QLQ and 2A7A) possessed 100 % identity for the full protein sequence while, the binding site loops of the six Canavalia lectins, except 2OVU, exhibited 100 % identity in their carbohydrate binding residues indicating high conservation in the binding site architecture. Phylogenetic trees based on the sequences of entire protein and its binding site shows that all the lectins of Canavalia sp. are closely clustered (Figs. 13.3 and 13.4). Similarly, there are six lectins in Dioclea sp. with a percent identity greater than 95 %. However, we have noticed that the three proteins 2JEC, 2GDF, 3SH3 showed 100 % sequence identity in their binding site loops, which also corroborated with the formation of a single clade in the cladogram obtained based on the binding site. We have also noted that Cymbosema lectin (3A0K) also shared an high identity (>93 %) with the Dioclea lectins and hence was grouped together (Loris et al. 1998). The two Cratylia (2D3P and 1MVQ) proteins along with Camptosema (3U4X) formed a third clade closer to the origin of Canavalia sp. in both the cladograms. It was interesting to note that all these lectins of above mentioned species are known to have an unusual type of homology called the circular homology. Initially, these are synthesized as glycosylated precursors having nearly 290 amino acids and are known to undergo transposition by domain swapping followed by transpeptidation (Sharon and Lis 1990). On the other hand, Platypodium (3ZYR) and Pterocarpus (1UKG) proteins of this MG group are found to cluster together, while lectin from Bowringia (2FMD) stands as an individual clade. The four lectins—Lens culinaris (1LEN), Pisum sativum (2LTN), Vicia faba (2B7Y) and Lathyrus ochrus I (1LOB) shared high percentage identity (>80 %) and were grouped together in the heatmaps as well as the cladograms as these four lectins have identical B-chain (Kolberg et al. 1980; Debraya and Rougé 1984).
Fig. 13.3 
Cladogram for the 46 lectins obtained from full protein sequences
Fig. 13.4 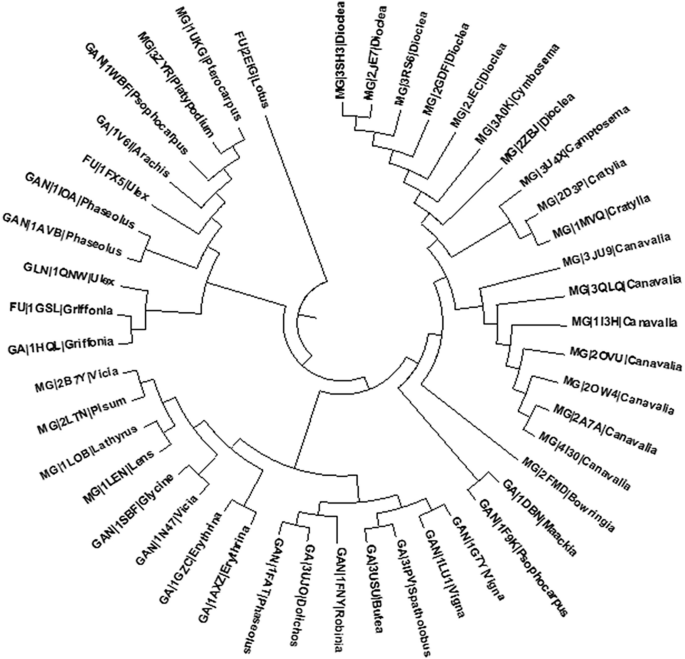
Cladogram showing the relationship between 46 legume lectins based on the four loops of their binding site
-
2.
GLN lectin group: Among the 46 lectin dataset, only single legume lectin belonging to Ulex europaeus II (1QNW) was found to be GLN specific. The whole lectin differed with MG, GA, GAN, FU by a range of 40–89.7 %, 38.01–62.29 %, 35.45–56.52 % and 36.73–52.97 %, respectively. Similarly, the binding site differed with the above sugar specific groups by 21.57–46.67 %, 26–49.09 %, 17.39–32.08 % and 23.08–35.19 %, respectively.
-
3.
GA and GAN lectin group: Until recently, the GA and GAN specific lectins were grouped together (early 1990s), but due to their amino acid variability in the binding regions attributing differences to their biologic recognition process, they were considered as separate entities (Sharma et al. 1998). The findings of our present study reinforces these observations as the heatmap computed based on the percentage identities showed higher identities among these two groups while considering entire lectin (28.24–86.96 %) whereas the same was not observed for the binding site residues (19.15–71.7 %). This demonstrates the difference in specificity between the two sets of lectins. The intra-group identity of GA was 33.78–96.65 % and 37.78–61.61 % for GAN binding proteins for the full sequence, while for the binding site loops, 17.07–98.04 % and 20.83–60.96 % identities were observed for GA and GAN proteins, respectively. Analysis of the cladogram demonstrated a similar trend, wherein the lectins of GA and GAN were distributed in common clades, which in turn supported the fact that the structural characteristics of GA and GAN lectins are dependent on their phylogeny rather than their differences in sugar specificity (Liener et al 1986).
-
4.
FU lectin group: This set included three proteins—Griffonia simplicifolia IV (1GSL), Lotus tetragonolobus (2EIG) and Ulex europaeus I (1FX5). These lectins had an intra-group identity range of 35.7–36.89 % and 14.49–34 % for the full protein sequence and binding site loops, respectively. Despite their specificities, these FU specific lectins are clustered with their respective genus clades in both the cladograms (Thomas and Surolia 2000).


Amino Acid Variability in Legume Lectins Based on Percentage Composition
The basic differences in the binding site architecture of legume lectins can be attributed to their amino acid variability and thereby their biologic function. The amino acids in the clustergrams were grouped based on their abundance (Figs. 13.5 and 13.6). Table 13.3 details the relative abundance of 20 amino acids in all 46 lectins classified as high, moderate and low.


Heatmaps with the dendrogram constructed using percentage composition of amino acids for the 46 lectins on full protein sequences


Heatmaps with the dendrogram constructed using percentage composition of amino acids in the binding site loops for the 46 lectins
In the clustergram of full protein, it was evident that Ser and Thr were highly present across the 46 lectins and Ser was prevalent in MG, GLN and GA binding proteins with 12.39 %, 12.10 % and 11.7 %, respectively. Unlike other MG lectins, Thr was found in relatively high percentage in Lens culinaris (1LEN), Pisum sativum (2LTN) and Vicia faba (2B7Y). MG proteins had a high percentage of acidic amino acids in comparison with the others. Residues Val and Thr were present in moderate percentages in the full protein but their presence was found to be low at the binding site indicating their importance for the protein structure stability than binding site specificity.
Binding site loop composition clearly differentiates the high presence of Gly over other residues with the maximum in MG constituting 12.37 and 11.39 % in GA binding proteins. GA, GAN and FU are found to be Pro rich at the carbohydrate binding site. The other major residue Ser has a high percentage in MG, GLN and GA specific lectins. Tyr in particular has a moderate percentage of 6.47 and is reported to be involved in CH-pi interaction in MG binding proteins. GAN and FU binding lectins have basic residues Lys and Arg in considerably higher percentage in the loops.
The residues Asp, Asn and Ala have an intermediate percentage in the binding site loops in comparison to the full protein, which is in accordance to their role in non-covalent interactions with the monosaccharide. Similarly Phe, His, Tyr and Trp found in low percentages have been reported to be necessary for stacking interactions with the sugar unit.
Cys and Met were either found in very low percentages or absent and thus were grouped together in the dendrogram.
Conclusion
Pattern recognition through heatmaps assists in reducing data complexity and enhances data interpretation by visualisation. Hence, we have exploited it in this study to analyse the data generated from amino acid variability in a set of 46 legume lectins. Our findings on sequence based variability and phylogenetic analysis are complementary to the previous studies, revealing that legume lectins arose from divergent evolution while retaining a common beta sandwich fold. There is a clear distinction in the sequence identity among these proteins specific to a particular monosaccharide. The results from percentage composition justify the plausible role of certain amino acid residues in the carbohydrate binding site for non-covalent interactions with the sugar.
References
Audette GF, Vandonselaar M, Delbaere LT (2000) The 2.2 Å resolution structure of the O(H) blood-group-specific lectin I from Ulex europaeus. J Mol Biol 304(3):423–433
Babino A, Tello D, Rojas A, Bay S, Osinaga E, Alzari PM (2003) The crystal structure of a plant lectin in complex with the Tn antigen. FEBS Lett 536(1–3):106–110
Benevides RG, Ganne G, Simoes Rda C, Schubert V, Niemietz M, Unverzagt C, Chazalet V, Breton C, Varrot A, Cavada BS, Imberty A (2012) A lectin from Platypodium elegans with unusual specificity and affinity for asymmeteric complex N glycans. J Biol Chem 287(31):26352–26364
Berman HM, Westbrook J, Feng Z, Gilliland G, Bhat TN, Weissig H, Shindyalov IN, Bourne PE (2000) The Protein Data Bank. Nucleic Acids Res 28:235–242
Bezerra EH, Rocha BA, Nagano CS, Bezerra Gde A, Moura TR, Bezerra MJ, Benevides RG, Sampaio AH, Assreuy AM, Delatorre P, Cavada BS (2011) Structural analysis of ConBr reveals molecular correlation between the carbohydrate recognition domain and endothelial NO synthase activation. Biochem Biophys Res Commun 408(4):566–570
Bourne Y, Roussel A, Frey M, Rougé P, Fontecilla-Camps JC, Cambillau C (1990) Three-dimensional structures of complexes of Lathyrus ochrus isolectin I with glucose and mannose: fine specificity of the monosaccharide-binding site. Proteins 8(4):365–376
Buts L, Dao-Thi MH, Loris R, Wyns L, Etzler M, Hamelryck T (2001) Weak protein-protein interactions in lectins: the crystal structure of a vegetative lectin from the legume Dolichos biflorus. J Mol Biol 309(1):193–201
Buts L, Garcia-Pino A, Wyns L, Loris R (2006) Structural basis of carbohydrate recognition by a Man(alpha1-2)Man-specific lectin from Bowringia milbraedii. Glycobiology 16(7):635–640
da Silva LC, Correia MT (2014) Plant lectins and Toll-like receptors: implications for therapy of microbial infections. Front Microbiol 5:20
de Oliveira TM, Delatorre P, da Rocha BA, de Souza EP, Nascimento KS, Bezerra GA, Moura TR, Benevides RG, Bezerra EH, Moreno FB, Freire VN, de Azevedo WF Jr, Cavada BS (2008) Crystal structure of Dioclea rostrata lectin: insights into understanding the pH-dependent dimer-tetramer equilibrium and the structural basis for carbohydrate recognition in Diocleinae lectins. J Struct Biol 164(2):177–182
de Souza GA, Oliveira PS, Trapani S, Santos AC, Rosa JC, Laure HJ, Faça VM, Correia MT, Tavares GA, Oliva G, Coelho LC, Greene LJ (2003) Amino acid sequence and tertiary structure of Cratylia mollis seed lectin. Glycobiology 13(12):961–972
Debraya H, Rougé P (1984) The fine sugar specificity of the Lathyrus ochrus seed lectin and isolectins. FEBS Lett 176(1):120–124
Del Sol FG, Cavada BS, Calvete JJ (2007) Crystal structures of Cratylia floribunda seed lectin at acidic and basic pHs. Insights into the structural basis of the pH-dependent dimer-tetramer transition. J Struct Biol 158(1):1–9
Delbaere LT, Vandonselaar M, Prasad L, Quail JW, Wilson KS, Dauter Z (1993) Structures of the lectin IV of Griffonia simplicifolia and its complex with the Lewis b human blood group determinant at 2.0 Å resolution. J Mol Biol 230(3):950–965
Duin RPW, Pekalska E (2007) The science of pattern recognition; achievements and perspectives. In: Duch W, Mandziuk J (eds) Challenges for computational intelligence, studies in computational intelligence, vol 63. Springer, Heidelberg, pp 221–259
Edelman GM, Cunningham BA, Reeke GN Jr, Becker JW, Waxdal MJ, Wang JL (1972) The covalent and three dimensional structure of concanavalin A. Proc Natl Acad Sci 69:2580–2584
Etzler ME, Surolia A, Cummings RD (2009) L-type lectins (Chap. 29). In: Varki A, Cummings RD, Esko JD et al (eds) Essentials of glycobiology, 2nd edn. Cold Spring Harbor Laboratory Press, Cold Spring Harbor
Gasteiger E, Hoogland C, Gattiker A, Duvaud S, Wilkins MR, Appel RD, Bairoch A (2005) Protein identification and analysis tools on the ExPASy server. In: Walker JM (ed) The proteomics protocols handbook. Humana, Totowa, pp 571–607
Geethanandan K, Abhilash J, Bharath SR, Sadasivan C, Haridas M (2011) X-ray structure of a galactose-specific lectin from Spatholobous parviflorous. Int J Biol Macromol 49(5): 992–998
Hamelryck TW, Dao-Thi MH, Poortmans F, Chrispeels MJ, Wyns L, Loris R (1996a) The crystallographic structure of phytohemagglutinin-L. J Biol Chem 271(34):20479–20485
Hamelryck TW, Poortmans F, Goossens A, Angenon G, Van Montagu M, Wyns L, Loris R (1996b) Crystal structure of arcelin-5, a lectin-like defense protein from Phaseolus vulgaris. J Biol Chem 271(51):32796–32802
Hamelryck TW, Loris R, Bouckaert J, Dao-Thi MH, Strecker G, Imberty A, Fernandez E, Wyns L, Etzler ME (1999) Carbohydrate binding, quaternary structure and a novel hydrophobic binding site in two legume lectin oligomers from Dolichos biflorus. J Mol Biol 286(4):1161–1177
Imberty A, Gautier C, Lescar J, Pérez S, Wyns L, Loris R (2000) An unusual carbohydrate binding site revealed by the structures of two Maackia amurensis lectins complexed with sialic acid-containing oligosaccharides. J Biol Chem 275(23):17541–17548
Kolberg J, Michaelsen TE, Sletten K (1980) Subunit structure and N terminal sequences of the Lathyrus odoratus lectin. FEBS Lett 117:281–283
Kundhavai Natchiar S, Arockia Jeyaprakash A, Ramya TN, Thomas CJ, Suguna K, Surolia A, Vijayan M (2004) Structural plasticity of peanut lectin: an X-ray analysis involving variation in pH, ligand binding and crystal structure. Acta Crystallogr D Biol Crystallogr 60(2):211–219
Larkin MA, Blackshields G, Brown NP, Chenna R, McGettigan PA, McWilliam H, Valentin F, Wallace IM, Wilm A, Lopez R, Thompson JD, Gibson TJ, Higgins DG (2007) ClustalW and ClustalX version 2. Bioinformatics 23(21):2947–2948
Liener IE, Sharon N, Goldstein IJ (1986) The lectins: properties, functions, and applications in biology and medicine. Academic Press, Orlando
Loris R, Van Overberge D, Dao-Thi MH, Poortmans F, Maene N, Wyns L (1994) Structural analysis of two crystal forms of lentil lectin at 1.8 Å resolution. Proteins 20(4):330–346
Loris R, Hamelryck T, Bouckaert J, Wyns L (1998) Legume lectin structure. Biochim Biophys Acta 1383:9–36
Loris R, De Greve H, Dao-Thi MH, Messens J, Imberty A, Wyns L (2000) Structural basis of carbohydrate recognition by lectin II from Ulex europaeus, a protein with a promiscuous carbohydrate-binding site. J Mol Biol 301(4):987–1002
Loris R, Van Walle I, De Greve H, Beeckmans S, Deboeck F, Wyns L, Bouckaert J (2004) Structural basis of oligomannose recognition by the Pterocarpus angolensis seed lectin. J Mol Biol 335(5):1227–1240
MacQueen JB (1967) Some methods for classification and analysis of multivariate observations. In: Proceedings of 5th Berkeley symposium on mathematical statistics and probability, vol 1, University of California Press, Berkeley, pp 281–297
Manoj N, Suguna K (2001) Signature of quaternary structure in the sequences of legume lectins. Protein Eng 14(10):735–745
Manoj N, Srinivas VR, Suguna K (1999) Structure of basic winged-bean lectin and a comparison with its saccharide-bound form. Acta Crystallogr D Biol Crystallogr 55(4):794–800
Manoj N, Srinivas VR, Surolia A, Vijayan M, Suguna K (2000) Carbohydrate specificity and salt-bridge mediated conformational change in acidic winged bean agglutinin. J Mol Biol 302(5):1129–1137
MATLAB v7.5, MathWorks (2007) Bioinformatics toolbox: user’s guide (R2007b)
Moreira GM, Conceição FR, McBride AJ, Pinto Lda S (2013) Structure predictions of two Bauhinia variegata lectins reveal patterns of C-terminal properties in single chain legume lectins. PLoS One 8(11)
Moreno FB, Bezerra GA, Oliveira TM, de Souza EP, da Rocha BA, Benevides RG, Delatorre P, de Azevedo WF, Jr CBS (2007) Structural analysis of Canavalia maritima and Canavalia gladiata lectins complexed with different dimannosides: new insights into the understanding of the structure-biological activity relationship in legume lectins. J Struct Biol 160(2):168–176
Moreno FB, de Oliveira TM, Martil DE, Viçoti MM, Bezerra GA, Abrego JR, Cavada BS, Filgueira de Azevedo W Jr (2008) Identification of a new quaternary association for legume lectins. J Struct Biol 161(2):133–143
Mourey L, Pédelacq JD, Birck C, Fabre C, Rougé P, Samama JP (1998) Crystal structure of the arcelin-1 dimer from Phaseolus vulgaris at 1.9 Å resolution. J Biol Chem 273(21):12914–12922
Mueller-Dieckmann C, Panjikar S, Tucker PA, Weiss MS (2005) On the routine use of soft X-rays in macromolecular crystallography. Part III The optimal data-collection wavelength. Acta Crystallogr D Biol Crystallogr 61(9):1263–1272
Nagano CS, Calvete JJ, Barettino D, Pérez A, Cavada BS, Sanz L (2008) Insights into the structural basis of the pH-dependent dimer-tetramer equilibrium through crystallographic analysis of recombinant Diocleinae lectins. Biochem J 409(2):417–428
Nóbrega RB, Rocha BA, Gadelha CA, Santi-Gadelha T, Pires AF, Assreuy AM, Nascimento KS, Nagano CS, Sampaio AH, Cavada BS, Delatorre P (2012) Structure of Dioclea virgata lectin: Relations between carbohydrate binding site and nitric oxide production. Biochimie 94(3):900–906
Olsen LR, Dessen A, Gupta D, Sabesan S, Sacchettini JC, Brewer CF (1997) X-ray crystallographic studies of unique cross-linked lattices between four isomeric biantennary oligosaccharides and soybean agglutinin. Biochemistry 36(49):15073–15080
Rabijns A, Verboven C, Rougé P, Barre A, Van Damme EJ, Peumans WJ, De Ranter CJ (2001) Structure of a legume lectin from the bark of Robinia pseudoacacia and its complex with N-acetylgalactosamine. Proteins 44(4):470–478
Rangel TB, Rocha BA, Bezerra GA, Assreuy AM, Pires Ade F, do Nascimento AS, Bezerra MJ, do Nascimento KS, Nagano CS, Sampaio AH, Gruber K, Delatorre P, Fernandes PM, Cavada BS (2012) Crystal structure of a pro-inflammatory lectin from the seeds of Dioclea wilsonii Standl. Biochimie 94(2):525–532
Rao VSR, Lam K, Qasba PK (1998) Architecture of the sugar binding sites in carbohydrate binding proteins—a computer modeling study. Int J Biol Macromol 23(4):295–307
Reeke GN Jr, Becker JW (1986) Three-dimensional structure of favin: saccharide binding-cyclic permutation in leguminous lectins. Science 234(4780):1108–1111
Rocha BA, Delatorre P, Oliveira TM, Benevides RG, Pires AF, Sousa AA, Souza LA, Assreuy AM, Debray H, de Azevedo WF, Jr SAH, Cavada BS (2011) Structural basis for both pro- and anti-inflammatory response induced by mannose-specific legume lectin from Cymbosema roseum. Biochimie 93(5):806–816
Rocha BA, Souza Teixeira C, da Silva HC, de Moura TR, Pereira-Júnior FN, do Nascimento KS, Nagano CS, Sampaio AH, Delatorre P, Cavada BS (2012) Crystal structure of the lectin of Camptosema pedicellatum: implications of a conservative substitution at the hydrophobic subsite. J Biochem 152(1):87–98
Sanders DA, Moothoo DN, Raftery J, Howard AJ, Helliwell JR, Naismith JH (2001) The 1.2 Å resolution structure of the Con A-dimannose complex. J Mol Biol 310(4):875–884
Shaanan B, Elgavish S (1998) Structures of the Erythrina corallodendron lectin and of its complexes with mono- and disaccharides. J Mol Biol 277(4):917–932
Sharma V, Surolia A (1997) Analyses of carbohydrate recognition by legume lectins: size of the combining site loops and their primary specificity. J Mol Biol 267:433–445
Sharma V, Srinivas VR, Adhikari P, Vijayan M, Surolia A (1998) Molecular basis of recognition by Gal/GalNAc specific legume lectins: influence of Glu 129 on the specificity of peanut agglutinin (PNA) towards C2-substituents of galactose. Glycobiology 8(10):1007–1012
Sharon N, Lis H (1990) Legume lectins: a large family of homologous proteins. FASEB J 4:3198–3208
Sharon N, Lis H (1995) Lectins-proteins with a sweet tooth: functions in cell recognition. Essays Biochem 30:59–75
Sharon N, Lis H (2002) How proteins bind carbohydrates: lessons from legume lectins. J Agric Food Chem 50:6586–6591
Sharon N, Lis H (2004) History of lectins: from hemagglutinins to biological recognition molecules. Glycobiology 14(11):53–62
Shetty KN, Latha VL, Rao RN, Nadimpalli SK, Suguna K (2013) Affinity of a galactose-specific legume lectin from Dolichos lablab to adenine revealed by X-ray crystallography. IUBMB Life 65(7):633–644
Srinivas VR, Reddy GB, Ahmad N, Swaminathan CP, Mitra N, Surolia A (2001) Legume lectin family, the ‘natural mutants of the quaternary state’, provide insights into the relationship between protein stability and oligomerization. Biochim Biophys Acta 1527:102–111
Suddath FL, Prasthofer T, Phillips SR, Engler JA (1989) Design, expression, and crystallization of recombinant lectin from the garden pea (Pisum sativum). J Biol Chem 264(12):6793–6796
Sundberg EJ, Trastoy B, Bonsor DA, Perez-Ojeda ME, Jimeno ML, Garcia-Fernandez JM, Chiara JL (2012) Synthesis and biophysical study of disassembling nano hybrid bioconjugates with a cubic octasilsesquioxane core. Adv Funct Mater 22:3191–3201
Svensson C, Teneberg S, Nilsson CL, Kjellberg A, Schwarz FP, Sharon N, Krengel U (2002) High-resolution crystal structures of Erythrina cristagalli lectin in complex with lactose and 2′-alpha-L-fucosyllactose and correlation with thermodynamic binding data. J Mol Biol 321(1):69–83
Swamy MJ, Sastry MVK, Surolia A (1985) Prediction and comparison of the secondary structure of legume lectins. J Biosci 9(3–4):203–212
Tamura K, Stecher G, Peterson D, Filipski A, Kumar S (2013) MEGA6: molecular evolutionary genetics analysis version 6.0. Mol Biol Evol 30:2725–2729
Tempel W, Tschampel S, Woods RJ (2002) The xenograft antigen bound to Griffonia simplicifolia lectin 1-B(4). X-ray crystal structure of the complex and molecular dynamics characterization of the binding site. J Biol Chem 277(8):6615–6621
Thomas CJ, Surolia A (2000) Mode of molecular recognition of l-fucose by fucose-binding legume lectins. Biochem Biophys Res Commun 268:262–267
Weisstein E (1995) K-Means clustering algorithm. From MathWorld—A Wolfram Web Resource. http://mathworld.wolfram.com/K-MeansClusteringAlgorithm.html
Xu D, Zhang Y (2013) Toward optimal fragment generations for ab initio protein structure assembly. Proteins 81(2):229–239
Young NM, Oomen RP (1992) Analysis of sequence variation among legume lectins. J Mol Biol 228:924–934
Zhang Y (2012) http://zhanglab.ccmb.med.umich.edu/PSSpred
Acknowledgements
This work has been funded by Council of Scientific and Industrial Research (CSIR), India. A.S. is a Bhatnagar fellow, N.G.J. thanks Department of Science and Technology (DST), Govt of India for INSPIRE Fellowship. M.A.S. is a D.S. Kothari fellow supported by University Grants Commission (UGC), India.
Author information
Authors and Affiliations
Corresponding author
Editor information
Editors and Affiliations
Rights and permissions
Copyright information
© 2015 Springer International Publishing Switzerland
About this paper
Cite this paper
Grandhi, N.J., Mamidi, A.S., Surolia, A. (2015). Pattern Recognition in Legume Lectins to Extrapolate Amino Acid Variability to Sugar Specificity. In: Chakrabarti, A., Surolia, A. (eds) Biochemical Roles of Eukaryotic Cell Surface Macromolecules. Advances in Experimental Medicine and Biology, vol 842. Springer, Cham. https://doi.org/10.1007/978-3-319-11280-0_13
Download citation
DOI: https://doi.org/10.1007/978-3-319-11280-0_13
Published:
Publisher Name: Springer, Cham
Print ISBN: 978-3-319-11279-4
Online ISBN: 978-3-319-11280-0
eBook Packages: Biomedical and Life SciencesBiomedical and Life Sciences (R0)