
Abstract
The connection among various places in the world is thanks to transport, which generates advantages in areas like economic development, international support in the face of catastrophes, and cultural and knowledge exchange, to mention some. The need to move people and goods locally and internationally determines the control of transportation systems; however, there are uncontrollable external factors. Corona Virus Disease (COVID-19) is a disease that arose in China, and due to its characteristics and the lack of information about the virus, it was difficult to prevent its spread around the world, causing a global pandemic. A fundamental activity for controlling the spread of the virus and medical assistance is the adequate distribution of medicines and medical equipment to hospitals. Mechanisms are currently being sought in Mexico to efficiently carry out this public sector activity. Therefore, this work offers to the decision-makers in the health sector a proposal for the distribution of medicines and medical equipment to the different hospitals in Mexico. The proposal presented applies quantitative methods, specifically allocation methods and the Clarke and Wright heuristic, to support the results. The proposal offered a viable, effortless, and helpful alternative to personnel involved in distribution activities and recommendations to the practitioners in the health sector and logistic areas.
Access provided by Autonomous University of Puebla. Download chapter PDF
Keywords
- Allocation methods
- Clarke and wright heuristic algorithm
- Distribution goods
- Supply chain
- Vehicle routing problem
- Health sector
1 Introduction
The World Health Organization (WHO) reports that the Corona Virus Disease (COVID-19 or SARS-CoV2) outbreak emerged in Wuhan, China, on December 31, 2019. It was named by the International Committee on Taxonomy of Viruses (ICTV) severe acute respiratory syndrome coronavirus 2 (SARS-CoV-2) (World Health Organization, WHO 2020a), and it was declared a pandemic on March 11, 2020 (WHO 2020b).
SARS-CoV2 is a single-stranded RNA virus of the beta coronavirus genus, Coronaviridae family. Some biological characteristics are high transmission rate, prolonged incubation period, asymptomatic carriers or mild symptoms, progression to respiratory distress syndrome in patients, and death, viral shedding after relief of symptoms, environmental transmission, and fomites (Ponce de León et al. 2020).
Medical needs have increased due to the pandemic compared to the needs in normal conditions, so the resources requested by the medical units must be covered to treat the conditions presented by SARS-COV-2 and everyday needs, which are the resources they commonly request in their planning. The Spanish Society of Critical Intensive Medicine and Coronary Units (SEMICYUC) states that the emergence of the pandemic generates an imbalance between clinical needs and the availability of health resources and that the duty to plan, the principle of distributive justice, and the maximization of global benefits must prevail (Grupo de Trabajo de Bioética de la Sociedad Española de Medicina Intensiva, Crítica y Unidades Coronaria (SEMICYUC) 2020).
Medicines for Europe, which represents the generic, biosimilar, and value-added European pharmaceutical industries, consider it important to face the market problems that can be generated by COVID-19 (Medicines for Europe 2020). The problems Medicine for Europe focuses explicitly on are: manufacturers may have difficulties meeting delivery deadlines; distributors could accumulate supplies to fulfill public service obligations or due to different incentives in the market that lead to suboptimal distribution to patients; hospitals and pharmacists often carry out financial reimbursement agreements based on a reference price, however, if there are returns of supplies or greater demand for products ordered, the reference price is modified (Medicines for Europe 2020).
The United States Food and Drug Administration (FDA or USFDA) is a federal agency of the Department of Health and Human Services that proposes a continuous review of the supply chain so that drugs are delivered on time and avoid disruption, considering the likelihood of COVID-19 affecting the supply chain (Food and Drug Administration (FDA) 2020). The severe problems in the distribution of medical equipment during the coronavirus disease have led to the modeling of multi-depot vehicle routing under uncertainty during the COVID-19 pandemic (Nozari et al. 2022). Also, Sanz et al. (2020) give recommendations to working groups and practitioners who must work with critically ill patients; one of those recommendations is to develop a strategic plan for interhospital transport in critical situations establishing a central department to lead and control the critical care units and define an efficient plan for distributing resources (the medicines and medical equipment) in all care units according to their demand.
Also, during the influenza pandemic, Ekici et al. (2014) developed a model and heuristics which estimate the spread pattern of the disease geographically. The objective was to forecast in advance the spread of disease and determine an allocation of network resources for food distribution. Donghyun et al. (2016) address the issue of vaccine distribution by introducing graphical techniques and techniques based on maximum flow to solve the problem. Rastegar et al. (2021) built a mathematical model to equilibrate influenza vaccine distribution to critical healthcare providers and first responders in developing countries. Wu and Wang (2021) developed a virtual platform for emergency supplies distribution; the main idea is to balance the logistics information necessary for efficiently and accurately handling the emergency supplies during the distribution steps in the supply chain of the health sector.
All countries must acquire and distribute the necessary resources to attend to and reduce COVID-19 infections. The number of confirmed cases and daily deaths were a general concern to governments and citizens. In Mexico, the first confirmed case of COVID-19 was on February 28, 2020, initiating spread control and prevention activities in the country (Mexican Government 2020).
When an unforeseen event of great magnitude occurs, such as the COVID-19 pandemic, where there was a time gap for health organizations to establish protocols and action measures, part of the population could have interpreted that time as a lack of competence, decreasing trust in those responsible for health care (Coll et al. 2021). The Pan American Health Organization (PAHO) states that “the Ministry of Health must take the necessary precautions for emergencies, creating warehouses in geographical areas or strategically located places, with effective procedures for their dispatch to places in need” (Pan American Health Organization 2022). Some tangible resources, such as material, human or procedural resources, protect individuals and compensate for vulnerability; intangible resources enable people to overcome difficulties and achieve successful adaptation. For this, it is necessary to identify the population’s needs to grant resources when and how they need them (Uriarte 2010). Hirawan (2020) comments in his work that optimizing the distribution of social assistance to the community is critical, especially during the COVID-19 pandemic.
The shortage of resources to fulfill basic needs directly impacts the quality of human life, “the lack of minimal health care can imply, almost without exception, the destruction of the human being” (Zúñiga-Fajuri 2014). The institutions that provide health care services must have a resource supply system to promptly meet the population’s needs because the population’s economic, social, and political impact will depend on this (Ramírez 2006). The unavailability of access to medicines has a high rate of morbidity and mortality (Ramírez 2006), hence the relevance and importance of satisfying the demand through the acquisition and distribution of medicines. From another point of view and supporting the health sector, Kumar (2021) examines the viability of using blockchain technology in a public distribution system, which helps institutions in the supply chain's activities to overcome shrinkage issues, misplacement, and ghost demand.
The effects that natural events have on the health of human beings depend on the danger of these. Considering that the effects are of high risk, it is vital to plan, as a preventive measure, the distribution of the necessary equipment and medicines in high-risk areas to minimize human suffering and accelerate the resilience of the affected population Pan American Health Organization and World Health Organization (2020a).
The Pan American Health Organization (2001) mentions that the humanitarian logistics problem involves acquiring emergency goods and equipment and managing supplies. They consider that all activities related to providing material assistance to people affected by extreme situations of natural events (such as biological events) require a minimum organizational framework that allows efficient management and greater use of resources. However, the logistics for handling humanitarian supplies should not be improvised in the moment of the emergency; it must be incorporated as a preponderant activity in the planning and preparations for emergencies of organizations in this field.
Martínez (2020) in his work proposes a route for the distribution of food aid under extreme natural events to minimize the response in the delivery of kits to affected people this through a mathematical model that considers limitations of road accessibility with periods for the distribution of aid.
In response to urgency requirements from patients with or without SARS-CoV-2 in Mexico, in this paper, the public health sector in Mexico is considered a case study. According to the National Development Plan, the current administration restructured the consolidated purchases of medicines, centralizing this activity in the Ministry of Finance and Public Credit. They changed the supply chain process of the health sector and the distribution mechanisms of medicines throughout the country, and a detailed report of this restructuring process is described by Rodríguez (2020).
Subsequently, the National System for the Distribution of Medications was created, whose objective “is to supply all institutions in the health sector with medications and medical supplies”, which should be distributed in approximately 25,000 first-level medical units, 1,500s-level units and around 500 national institutes. However, due to the lack of planning and coordination of laboratories (suppliers) and distributors, there was a disruption in the supply chain of medical supplies in hospital care centers (Badillo 2021). Therefore, alternatives are sought to carry out this distribution activity in the public sector efficiently.
Then, this paper offers a proposal to this sector that allows them to distribute medicines and medical equipment through quantitative methods. For the case study, a central warehouse and six intermediate warehouses of supplies are considered, from where the vehicular units will depart to distribute medicines and medical equipment to 197 medical units of hospital care, all of them located in different states of the Mexican Republic. It seeks to determine the shortest routes for delivering supplies to hospital care centers, representing the case study as a Vehicle Routing Problem (VRP), using allocation methods and Clarke’s and Wright’s (CW) heuristic algorithm.
The work was developed in two phases. First phase: clusters were created to assign hospital care centers to the closest distribution depot minimizing the distance traveled by the available vehicles. Second phase: the CW method was applied with the information obtained from the first phase to generate the best routes with the least number of vehicles with fixed capacity under a deterministic demand.
The document includes four sections that show the content and development of the work. The first section presents the introduction to the problem being addressed and some background about the method applied; the second section shows the case study and its specific characteristics; the third section shows the results. Finally, the fourth section reports the conclusions of the work carried out, as well as some proposals to support the decision-makers and recommendations to the community of practitioners in this sector.
2 Methodology
This work is developed as follows:
-
1.
Literature review about quantitative models for freight transportation and distribution of goods, considering the restriction of the case study.
-
2.
Case study information: Compile the information that allows a detailed description of the case study, considering the necessary parameters for applying the quantitative method. Locate distribution centers and hospital care centers for the case study.
-
3.
Application of Clarke and Wright’s heuristic proposing solution scenarios, considering the available infrastructure that allows the best use of resources.
-
4.
Obtaining the results and comparison of scenarios to identify the best proposal for decision-makers.
2.1 Distribution of Goods
The VRP is used to find the optimal route that a fleet of vehicles will visit or cover a set of clients under a series of restrictions (Laporte 2009). Depending on the problem you want to address, the VRP will have modifications. The variants of the VRP depend on the characteristics of the vehicles, delivery points, vehicle capacity, demand for delivery points, and supply of warehouses, among others. The methodology consists of grouping the delivery points into clusters and then determining the routes for each, dividing the problem into two phases.
2.1.1 First Phase
One of the heuristics to define clusters of delivery points in the vehicle routing problem is the Fisher and Jaikumar algorithm, which is a two-phase process. In the first phase, m seeds are located, and a cluster is created for each of the seeds. The purpose is to minimize the distance between the seed and the client, satisfying the capacity restriction (Laporte 2009). Clusters are created by solving a generalized assignment problem, and the second phase consists of generating the vehicle route for each group (Cordeau et al. 2002).
For the allocation, a function is defined that consists of minimizing the total allocation cost where dik is found as follows:
Furthermore, it means that the cost of assigning client i to cluster k is equal to the cost of going from deposit to client i+ the cost of going from client i to seed client sk—the cost of going from deposit to seed client sk, that is when costs are symmetrical.
The sweep heuristic creates the clusters by rotating a ray from the warehouse, and the clients join until the capacity limit is reached. It is like a sweep similar to the hands of the clock, with an initial point around the warehouse to identify the delivery point that will determine a cluster based on the vehicle's capacity. When the vehicle's capacity is reached, it starts another new route. Then the clusters are routed, solving the problem of the traveling agent exactly or approximately. This algorithm can be applied in plane problems; each node corresponds to a point in the plane (Romanuel and Montero 2014; Olivera 2004).
Another method of clustering is the constructive heuristic; it selects the clients randomly and assigns them to the closest depot. The main restriction is the deposit capacity; the clients will be assigned until this capacity is reached, and the remaining clients will be assigned to the next closest deposit; all nodes must be covered (Toro-Ocampo et al. 2016).
2.1.2 Second Phase
Exact and heuristic methods can be applied to solve the VRP. Some of the exact methods are Branch and Bound (BB) algorithm provides solutions that are systematically listed, and the responses obtained from each level of the branches are evaluated concerning their contribution to the objective function. The search tree is comprehensive but has limited depth (Laporte 2009). Branch and Cut (BC) and Branch and Price (BP) are derived from BB. Gutiérrez-Jarpa et al. (2010) mention in their literature searches the application of the BC method to solve the Multiple Vehicle Routing Problem with Time Windows (VRPTW) as addressed in Bard et al. (2002), where it is required to find the minimum number of vehicles to satisfy to a group of clients who have the same needs and the vehicle units that will provide the service are the same.
The literature shows that VRPTW can also be solved with the BP method (Gutiérrez-Jarpa et al. 2010), depending on the determined objective. The routing problem considering multiple repositories can be solved with Iterated Local Search. In their algorithm, Ospina-Toro et al. (2018) propose to find the solution through the following steps: first, obtain an initial solution using different clustering techniques, then the intensification stage using the Variable Neighborhood Search (VNS) algorithm and applying random disturbance schemes. Following these steps, it allows us to find locations that can be optimal location. However, the process continues exploring the solution space until there is no better solution than the one found in previous iterations.
In the case of the Heuristics methods, the CW saving algorithm was initially developed for the VRP, and they can be applied for both directed and undirected problems (Blocho 2020). The CW savings method aims to minimize the total distance traveled by all vehicles and indirectly minimize the number of vehicles required (Ballou 2004). Calculate the savings by combining two clients on the same route to select the best route (Clarke and Wright 1964). The method starts with an unfeasible solution where the supply is sent individually to each customer (Fisher and Jaikumar 1981). A feasible solution consists of n roundtrip routes between the warehouse and a customer (Fisher and Jaikumar 1981).
Ospina-Toro et al. (2018) use this as a reference to describe how the heuristic works iteratively. Moreover, the process ends when combining the routes is no longer possible. Finally, the number of vehicles used to visit all the delivery points and the best routes are obtained (Laporte 2009). Clarke and Wright (1964) solve a problem with a central warehouse and several delivery points where the vehicles will have the capacity to satisfy the demand. Spekken and De Bruin (2013) implemented the CW for single-vehicle route optimization in agricultural field work. The Bramel and Simchi-Levi heuristic, as well as the Fisher and Jaikumar algorithm, consists of two phases. In the first one, the client clusters are created, and then the routes that the clients of each cluster will visit (Muriel and Simchi-Levi 2013); the difference consists in the determination of the clusters solving a problem of the location of concentrators with capacities (CCLP) (Bramel and Simchi-Levi 1995).
The advantage of applying these heuristics is their ease of use to obtain the solution. It does not require a high computational effort or specialized knowledge of the personnel to apply the heuristics and carry out the implementation, as well as the low software and hardware requirements for performing the calculations automatically.
3 Results
3.1 Case Study
Management of medicines and medical equipment in the health system is one of the essential elements for any country, especially in the situation that the world is currently experiencing. In Mexico, mechanisms are being sought to efficiently distribute medicines and medical equipment in the public sector because, according to the National Development Plan, the current administration carried out a restructuring of the consolidated purchases of medicines, centralizing this activity in the Ministry of Finance and Public Credit (Rodríguez 2020).
The restructuring determined that it was necessary to change the distribution mechanisms of medicines throughout the country. The National System for the Distribution of Medications must distribute in approximately 25,000 first-level medical units, 1,500s-level units, and around 500 national institutes. However, due to the lack of planning and coordination of laboratories (suppliers) and distributors, there was a disruption in the supply chain of medical supplies in hospital care centers (Badillo 2021). Therefore, alternatives are sought to carry out this distribution activity in the public sector efficiently.
This work proposes to health decision-makers a way to distribute these medical supplies efficiently to different hospital care centers, improving the use of available resources. The proposal applies quantitative methods, specifically assignment methods and the Clarke and Wright heuristic, to show viable alternatives.
The case study is based on 197 hospital care centers located in different states of the country, which are supplied by a central warehouse and six smaller warehouses, also located in the states of the country (location defined by the federal government). Both hospital care centers and warehouses belong to the public institutions of the National Defense Ministry (SEDENA), the Mexican Institute of Social Security (IMSS) and the Institute of Social Security and Services for State Workers (ISSSTE). Statistical information from the National Institute of Geography and Informatics (INEGI) reported that approximately 89 million medical consultations were made during 2019 to the population enrolled in the federal government’s medical service.
However, the medical resources that each health center service requires to satisfy the demand of the population are considered confidential information. So in this work, the demand was defined randomly with a uniform distribution between 500 kg and 3.5 tons of weight for hospital care centers. The aim is to show how the proposal works and get a solution to the problem, considering that information has to replace the real demand in each hospital and make the calculations again.
The number of vehicles used to transport supplies to the hospital care centers is assigned according to the available resources in the warehouse to satisfy the demand for each cluster obtained in the first phase. This lets the proposal say how many vehicles are needed to get supplies to the right places or how many trips the vehicles must make to meet the demand. Based on what the hospital staff knows, each vehicle can make as many trips as needed to meet the demand.
Also, the capacity of the vehicles used to transport supplies is defined by the guidelines established by the Ministry of Communications and Transport (SCT) in the Official Mexican Standard NOM-012-SCT-2-2014 as follows: “On the weight and maximum dimensions with which motor transport vehicles that travel on the general communication routes of Federal jurisdiction can circulate”. With this, Type C3 vehicles corresponding to trucks with three axles and 8–10 tires, were selected for the proposal as a transport standard with a gross vehicle weight of 16 tons for displacement on type D roads (two-lane highway, feeder network) and 17 tons for type C roads (two-lane highway, secondary network) (SCT 2014).
The SCT details these types of roads as (i) “Highway Type C Secondary network; These are highways that, according to their characteristics, provide service within the state scope with medium lengths, establishing connections with the primary network, and (ii) Type D Highway Feeder network, they are highways that, according to their geometric and structural characteristics, mainly provide service within the municipal scope with relatively short lengths, establishing connections with the secondary network” (SCT 2014).
In this work, the limited human resources in each distribution center are not considered because each hospital center has internal policies for managing its personnel; therefore, all hospitals are treated with the same priority in the proposal. Also, the central warehouse does not consider the windows time to deliver the resources, according to the information from the warehouse supervisor.
3.2 Scenarios
Based on the inputs described before, three scenarios were carried out to determine the routes of distribution as possible alternatives for the decision-makers with the available resources:
-
Scenario 1: Determination of routes from a central node to all hospital care centers. Figure 10.1 shows the distribution.
Fig. 10.1 
Distribution for scenario 1
-
Scenario 2: Determining routes from 7 warehouses to the hospital care centers, where one is the central warehouse and 6 are intermediate warehouses. Hospital care centers are attached to each warehouse through the minimum distance, where the six intermediate warehouses are supplied from the central node, and it also supplies hospital care centers. The intermediate warehouses are located according to the information obtained from the health department staff. Figure 10.2 shows the distribution.
Fig. 10.2 
Distribution for scenario 2
-
Scenario 3: Determination of routes from 6 intermediate warehouses to hospital care centers, where the hospital care centers were assigned in a previous phase to each intermediate warehouse, considering the shortest distance to each of them and the intermediate warehouses are supplied from the central node, in this scenario the central warehouse does not supply to the hospital care centers. Figure 10.3 shows the distribution.
Fig. 10.3 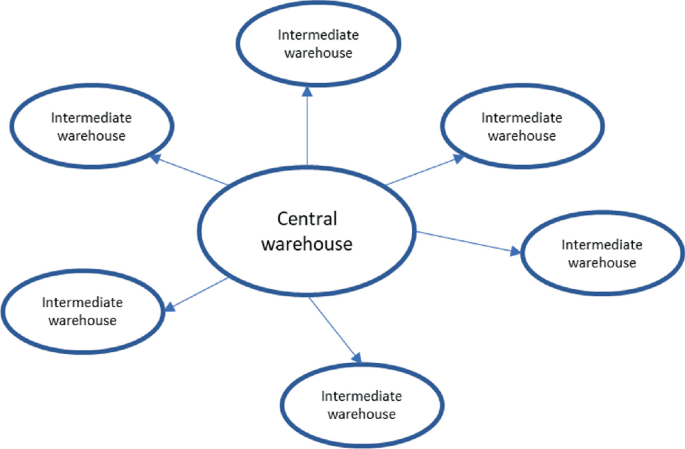
Distribution for scenario 3


The three scenarios are compared under the distance traveled, the number of vehicles used, and the number of nodes visited on each route.
3.3 Assignment of Hospital Service Centers to Intermediate Deposits or Central Warehouse
To carry out the assignment of hospital service centers to warehouses, the location of intermediate deposits and central warehouse was initially obtained through the coordinates (x, y) got by using the Google Earth application (Google Earth 2022), after that the distance matrix was calculated for each scenario according to the assignment obtained.
-
Scenario 1: Only the coordinates (x, y) of each service center and the central warehouse were considered. Subsequently, the distance matrix was calculated.
-
Scenario 2: The distance matrix was calculated from each hospital care center to each intermediate warehouse and the central warehouse, considering that the central warehouse also dispatches supplies to hospital care centers, as mentioned before. Once the distances had been calculated, for each service center, the closest warehouse to dispatch the supplies was identified; in other words, the minimum distance was selected, and from what warehouse belonged to the distance to assign the warehouse. In this way, the clusters with their corresponding hospital care centers were defined, where the number of hospitals care centers belonging to the intermediate warehouses is not the same because it is considered as a priory the minimum distances between them; therefore, if the number of hospital care centers had been considered equal for each cluster, it would generate trips with no minimum distances. Finally, the clusters were grouped, and Table 10.1 and Annex 10.6 show each cluster's hospital centers.
Table 10.1 Scenario 2. Assignment of hospital service centers to intermediate depot
In this scenario, the number of obtained clusters was 7. Table 10.1 shows how each cluster was grouped and its total demand, which must be satisfied from the central warehouse to the intermediate warehouses. In this scenario, it is important to mention that the demand must be calculated in advance in the intermediate warehouses and their capacity to satisfy the hospital care centers on time, which implies more changes in the internal organization and control of each intermediate care center in the intermediate warehouses. It concludes the first stage of the methodology.
Scenario 3: The distance matrix was calculated, where the central deposit does not deliver to hospital service centers, so the number of clusters is only 6 (Fig. 10.3). The central deposit corresponds to cluster number 6 of scenario 2, based on the information provided by the decision maker. The process is the same as scenario 2 without cluster number 6. Table 10.2 shows how each intermediate warehouse was grouped, considering the minimum distances as a priority. Annex 10.7 shows the relationship between cluster and hospital care centers.
The demand of each cluster is calculated by adding up the demand of the hospital service centers that belong to it (Tables 10.1 and 10.2). The total demand obtained is the demand the central warehouse must cover in this scenario, thus avoiding the lack of inputs in any destination and balancing the distribution network.
3.4 Application of the Clarke and Wright Heuristic
In phase I of the methodology, the allocation clusters were defined, which serve as input for applying the CW algorithm for each cluster in each scenario. The algorithm was implemented in the Matlab software, version 2018 (MatLab 2018) and executed for each cluster obtained in Annexes 10.6 and 10.7. Therefore, given that one of the constraints of the scenarios is the vehicle capacity (16 tons), when the demand from the intermediate warehouse or the hospital service center exceeds the vehicle capacity, fictitious destinations are generated with the maximum capacity of the vehicle with the same location, to obtain the distance traveled and covered the demand of the intermediate deposit through a certain number of trips. A vehicle from the central node can make as many trips as necessary to cover the destination demand. Considering that the central node supplies the intermediate deposits in each scenario, it is necessary to integrate the distance traveled to these deposits from the central node. For scenario 1, the algorithm was applied directly considering the demand of the hospital care center requires and the vehicle capacity needed to build the route. For the execution of the implemented algorithm, the locations of each destination are the coordinates (x, y) initially obtained and calculating the distances to define the routes of each cluster.
4 Analysis of Results
The number of hospital service centers served by each intermediate warehouse and the distance traveled on each route were obtained for all scenarios. Scenarios 2 and 3 include the distance traveled from the central warehouse to the intermediate warehouses, as it was explained previously, considering the demand that the clusters require for their hospital care centers; therefore, vehicles travel several times until the intermediate warehouse has the total demand for the hospital care centers assigned. Table 10.3 shows the distance to each intermediate deposit of scenarios 2 and 3.
The comparison of the number of vehicles to be used on the routes obtained, the total distance traveled, and the average number of hospital care centers visited for each of the scenarios developed is shown in Table 10.4.
Table 10.4 shows that the shortest distance traveled is obtained through scenario 1, where a central warehouse distributes to all hospital care centers. Also, the number of vehicles to be used for distribution is less than in any of the scenarios, where the vehicle capacity is maximized and helps to minimize the costs (oil, human resources, equipment, and vehicle maintenance). However, the number of destinations visited on each route is greater than in scenarios 2 and 3, which could cause delays in deliveries due to the number of hospitals to visit on a single route. In this case, the time spent for the delivery of medicines is not considered because the vehicles travel both in urban areas and on highways, which does not allow considering an average travel time of the vehicle as literature proposes for their delivery, nor the time spent in the loading and unloading of goods in the hospital care centers, which would be very good to integrate into other investigations. On the other hand, comparing the distance traveled and the vehicles and capacity used in them allows decision-makers to identify opportunities for improvement in managing and controlling health resources.
Therefore, it is important to mention that the assignment of clusters with intermediate warehouses does not show an advantage over the distance or the number of vehicles to be used for the delivery of medical supplies, also to have intermediate warehouses would increase the costs to the government because they need more people to hand medicines and medical resources (unload and load) as well as all the activities involved in the intermediate warehouse management such as cost for rent, human resources, security, inventory control, special equipment for handling medicine, etc. Then, scenario 1 is the best way to supply medical resources to the hospital care centers even though it is a central distribution policy, where it will be necessary to improve the management and control in all of the activities developed as well as the adequate infrastructure.
Table 10.5 shows the routes and the hospital care centers calculated by the CW algorithm and the vehicle's sequence.
Figure 10.4 is an example of the graphical representation of the routes obtained from the application of the CW algorithm through MatLab for scenario 1 (Annex 3 shows the routes), where a color represents the route got, and the small black points on the line are the hospital care center visited (the scale is determined according to the location by decimal coordinates).

Routes obtained for scenario 1. The coordinates (x, y) of the location of the hospital care centers were obtained with Google Earth
Routes:1 (green line at the top), 7 (blue line in the middle), 9 (naive blue line in the south), and 12 (yellow line west-south), obtained in scenario 1 by MatLab, are geolocated on the map where is easy to translate the results on the map and visualize the routes easily, also to show that decision-makers require very low effort to read them (Fig. 10.5).

Source Own elaboration supported by Google Earth software
Routes obtained for scenario 1 (routes 1,7, 9, and 12). The coordinates (x, y) of the location of hospital care centers were obtained with Google Earth.
Route 22 is in the country’s center, mostly Ciudad de Mexico and Estado de Mexico. Figure 10.6 shows their location, and the traveled distance is very short, according to Table 10.5, because all the hospital care centers are very close, and in Fig. 10.4 is challenging to see.

Source Own elaboration supported by Google Earth software
The location route 22. The coordinates (x, y) of the location were obtained with Google Earth.
The graphical location of the intermediate warehouses to group the clusters of scenarios 2 and 3 are shown in Fig. 10.7, where it reveals that the intermediate warehouses are in the center of the country as the central warehouse, which could be a disadvantage in the distribution problem because there is no big difference in the distances traveled between them and the central warehouses for the case study.

Source Own elaboration supported by Google Earth software
The location of intermediate warehouses for scenarios 2 and 3. The coordinates (x, y) of the location were obtained with Google Earth.
5 Conclusions and Recommendations
The application of quantitative methods to solve real problems facilitates the decision-making of the personnel involved in these activities since having information obtained from proven methods that solve certain problems gives support and security to select the best alternative.
Currently, due to the COVID-19 pandemic, there is an urgent need to optimally distribute medical supplies in any sector. Therefore, in this document, a Mexican case study for the public sector health system was analyzed by three scenarios with the resources available and the restrictions on them. The application of easy quantitative methods for the personnel in charge of the distribution of medicines and medical equipment was one of the objectives and gave them a viable alternative focused on minimizing the distance traveled by vehicles and the number of vehicles used to distribute the medicines. The applied methodology is developed in two stages: clustering the hospital care centers to one of the warehouses and applying the Clarke and Wright heuristic algorithm to find the routes to deliver the medical good. The results show that alternative or scenario 1, where a central warehouse is the only one considered to distribute the supplies directly to the hospital care centers, obtains a distance shorter, in which 22 routes are determined with the visit of approximately 8.9 service centers per route, assigning one vehicle per route. Therefore, it is concluded that the assignment of clusters with intermediate warehouses (scenarios 2 and 3) does not show an advantage over the distance or the number of vehicles to be used to deliver medical supplies.
This indicates that the use of intermediate distribution warehouses is not always the best alternative for distributing merchandise; for the case study analyzed, the location of the central warehouses does not help to improve distribution because they are in locations that are very close to each other. In this case, it is recommended to relocate the intermediate warehouses to speed up dispatch and improve the use of resources by applying simple methodologies for locating facilities that support the personnel in charge of this activity. Currently, the policy of the Mexican health system (centralization of resources) is supported by the results because the best alternative found is the one where from a central warehouse to hospital care centers are dispatched the health resources in this case. On the other hand, the results obtained by the quantitative methodologies potentially help the decision-makers because the routes obtained through the application of these methods indicate the distribution sequence (at the same time, supports the accommodation of medications in the vehicle to speed up unloading), maximizes the use of vehicle capacity because a route (assigned vehicles) contains a greater number of delivery points considering the available capacity of the vehicle when integrating a new center of hospital care, in addition to minimizing vehicle travel, which represents savings in fuel use, vehicle maintenance, personnel in charge of distribution, equipment for loading and unloading medications, minimizes the time spent making-decisions, to mention a few resources.
With this proposal, the decision maker has enough information to safely select the best-performing alternative with arguments based on the application of quantitative methods and create scenarios that show the feasibility of its results based on the resources available to the public health system in Mexico.
It is important to highlight and promote the application of simple methodologies that support the personnel in charge of these distribution activities since many of them do not have experience in the application of complex quantitative methodologies or in the use of information technologies, which makes more complicated the implementation; however, the ones used in this case study can be easily implemented in a commercial spreadsheet.
The advantages of using these methodologies for the decision maker are that they allow the integration of real demand in a simple way and allow the alternatives to be easily strengthened, integrating more information on restrictions and constants to the case study. Unfortunately, in developing countries, the lack of statistical information is a critical problem, but this kind of work shows how important is to have data. Also, this work contributes as an incentive for the people working in distribution activities to collect data to use them to improve their activities.
For this reason, some extensions to the proposal are the determination of the demand for hospital care centers, limited supply in intermediate warehouses and the restriction on the number of vehicles to use, opening the application of other methodologies with other potentialities. Also, determine priorities for the hospital care centers according to the size of the hospitals, people’s demand, requirements of medicines, and kind of hospitals based on the specialty assigned.
References
Badillo D (2021) Drug distribution, a dislocated system [Distribución de medicamentos, un sistema dislocado]. El Economista. https://www.eleconomista.com.mx/politica/La-atrofia-del-abastecimiento-de-medicinas-en-Mexico-20200921-0067.html. Accessed 1 Sep 2022
Ballou RH (2004) Programación y diseño de rutas de los vehículos, Logistica y Administracion de la Cadena de Suministro, 5 edn. Pearson Educación, México, pp 243–247
Bard JF, Kontoravdis G, Yu G (2002) A branch and cut procedure for the vehicle routing problem with time windows. Transp Sci 36(2):250–269
Blocho M (2020) Heuristics, metaheuristics, and hyperheuristics for rich vehicle routing problems. Comput Sci Bus (In press). https://doi.org/10.1016/b978-0-12-815715-2.00009-9
Bramel J, Simchi-Levi D (1995) A location based heuristic for general routing problems. Oper Res 43(4):649–660
Clarke G, Wright JW (1964) Scheduling of vehicles from a central depot to a number of delivery points. Oper Res 12(4):568–581
Coll BT, Palacio LJ, Añel RR, Gens BM, Jurado BJJ, Perelló BA (2021) Organización de la Atención Primaria en tiempos de pandemia. Atención Primaria 53:102209
Cordeau JF, Gendreau M, Laporte G, Potvin JY, Semet F (2002) A guide to vehicle routing heuristics. J Oper Res Soc 53(5):512–522
Donghyun K, Guo H, Wang W, Joong-Lyul L, Sung-Sik KA (2016) On efficient vaccine distribution strategy to suppress pandemic using social relation. Discret Math Algorithms Appl 8(1):1–13 (World Scientific Publishing Company). https://doi.org/10.1142/S1793830916500105
Ekici A, Keskinocak P, Swann JL (2014) Modeling influenza pandemic and planning food distribution. Manuf Serv Oper Manag 16(1):11–27. https://doi.org/10.1287/msom.2013.0460
Fisher ML, Jaikumar R (1981) A generalized assignment heuristic for vehicle routing. Networks 11(2):109–124
Food and Drug Administration (FDA) (2020) Actualización sobre el coronavirus (COVID-19) y la cadena de suministro. https://www.fda.gov/news-events/press-announcements/actualizacion-sobre-el-coronavirus-covid-19-y-la-cadena-de-suministro
Google Earth (2022) Google erth pro ink. https://www.google.com/intl/es-419/earth/
Grupo de Trabajo de Bioética de la Sociedad Española de Medicina Intensiva, Crítica y Unidades Coronaria (SEMICYUC) (2020) Recomendaciones éticas para la toma de decisiones en la situación excepcional de crisis por pandemia COVID-19 en las Unidades de Cuidados Intensivos (SEMICYUC). www.semicyuc.org. https://semicyuc.org/wp-content/uploads/2020/03/%C3%89tica_SEMICYUC-COVID-19.pdf
Gutiérrez-Jarpa G, Desaulniers G, Laporte G, Marianov V (2010) A branch and price algorithm for the vehicle routing problem with deliveries, selective pickups and time windows. Euro J Oper Res 206(2):341–349
Hirawan FB (2020) Optimizing the distribution of the social assistance program during the COVID-19 pandemic. CSIS Commentaries DMRU-081-EN/ECON-003-EN
Kumar A (2021) Improvement of public distribution system efficiency applying blockchain technology during pandemic outbreak (COVID-19). J Humanit Logist Supply Chain Manag 11(1):1–28, 2042–6747. https://doi.org/10.1108/JHLSCM-06-2020-0050
Laporte G (2009) Fifty years of vehicle routing. Transp Sci 43(4):408–416
Martínez LVM (2020) Propuesta de distribución de ayuda humanitaria considerando restricciones viales en desastres naturales súbitos. Caso de estudio: Roldanillo-Valle Del Cauca, Programa De Ingeniería Industrial, Facultad De Ingeniería, Universidad Del Valle Zarzal, Colombia
MathWorks Inc, MatLab (2018) Versión R2018a. The MathWorks Inc., Natick
Medicines for Europe (2020) Impact of COVID-19 on active ingredient and medicines manufacturing and supplies in Europe, European Medicines Agency, Brussels, Belgic
Mexican Government [Gobierno de México] (2020) COVID-19 México-Mapa Municipal. https://coronavirus.gob.mx/fHDMap/mun.php
Muriel A, Simchi-Levi D (2013) Supply chain design and planning—Applications of optimization techniques for strategic and tactical models. Supply Chain Des 11:17–92
Nozari H, Tavakkoli-Moghaddam R, Gharemani-Nahr J (2022) A neutrosophic fuzzy programming method to solve a multi-depot vehicle routing model under uncertainty during the COVID-19 pandemic. Int J Eng 35(2):360–371. https://doi.org/10.5829/ije.2022.35.02b.12
Olivera A (2004). Heurísticas para problemas de ruteo de vehículos. Reportes Técnicos 04–08. UR. FI-INCO
Ospina-Toro D, Toro-Ocampo EM, Gallego-Rendón RA (2018) Solución del MDVRP usando el algoritmo de búsqueda local iterada. Rev Colomb Tecnol Av 1(31)
Pan American Health Organization (2022) Equipment and supplies. http://www.saludydesastres.info/index.php?option=com_content&view=article&id=79&Itemid=473&lang=es
Pan American Health Organization and World Health Organization (2001) Logística y gestión de suministros humanitarios en el sector salud. Organización Panamericana de la Salud, Washington, p 10
Ponce de León JDL, Marín PAC, González GCG, Escandón ÁH (2020) Coronavirus COVID 19: más allá de la enfermedad pulmonar, qué es y qué sabemos del vínculo con el sistema cardiovascular. Revista Colombiana de Cardiología 27(3):142–152. ISSN:0120-5633. https://doi.org/10.1016/j.rccar.2020.04.006
Ramírez MO (2006) La Prescripción de medicamentos y su repercusión social. Revista Cuba Salud Pública 32:1561–3127
Rastegar M, Tavana M, Meraj A, Mina H (2021) An inventory-location optimization model for equitable influenza vaccine distribution in developing countries during the COVID-19 pandemic. Vaccine 39:495–504
Rodríguez ED (2020) The atrophy of the medicine supply in Mexico [La atrofia del abastecimiento de medicinas en México]. El Economista. https://www.eleconomista.com.mx/politica/Distribucion-de-medicamentos-un-sistema-dislocado-20210718-0002.html. Accessed 1 Sep 2022
Romanuel RA, Montero LH (2014) Propuesta de paradigma para análisis geométricos en SIG independiente del sistema de referencia. Revista Geográfica Venezuela 55(1):11–26
Sanz BMÁ et al (2020) Recommendations of the Working Groups from the Spanish society of intensive and critical care medicine and coronary units (SEMICYUC) for the management of adult critically ill patients in the coronavirus disease (COVID-19). Med Intensiva 54. https://doi.org/10.1016/j.medin.2020.04.001
Secretaría de Comunicaciones y Transportes (SCT) (2014) Norma Oficial Mexicana NOM-012-SCT-2-2014, Sobre el peso y dimensiones máximas con los que pueden circular los vehículos de autotransporte que transitan en las vías generales de comunicación de jurisdicción federal, Diario Oficial de la Federación, pp 19–45
Spekken M, De Bruin S (2013) Optimized routing on agricultural fields by minimizing maneuvering and servicing time. Precision Agric 14(2):224–244
Toro-Ocampo EM, Domínguez-Castaño AH, Escobar- AH (2016) Desempeño de las técnicas de agrupamiento para resolver el problema de ruteo con múltiples depósitos. TecnoLógicas 19(36):49
Uriarte AJD (2010) Psicología positiva y sus dificultades o la resiliencia comunitaria en situaciones catastróficas y de emergencia. Int J Dev Educ Psychol 1:687–693
World Health Organization [Organización Mundial de la Salud] (WHO) (2020a) Brote de enfermedad por coronavirus (COVID-19). https://www.who.int/es/emergencies/diseases/novel-coronavirus-2019
World Health Organization [Organización Mundial de la Salud] (WHO) (2020b) Alocución de apertura del Director General de la OMS en la rueda de prensa sobre la COVID-19. https://www.who.int/es/dg/speeches/detail/who-director-general-sopening-remarks-at-the-media-briefing-on-covid-19---11-march-2020b
Wu J, Wang Y (2021) distribution of the emergency supplies in the COVID-19 pandemic: a cloud computing based approach. Math Probl Eng 1–18. Article ID 5972747. https://doi.org/10.1155/2021/5972747
Zúñiga-Fajuri A (2014) La distribución de recursos escasos en la atención de salud con base en la Teoría de las necesidades, ¿una idea añeja? Convergencia 21(64):169–187
Author information
Authors and Affiliations
Corresponding author
Editor information
Editors and Affiliations
Rights and permissions
Copyright information
© 2023 The Author(s), under exclusive license to Springer Nature Switzerland AG
About this chapter

Cite this chapter
Hernández, L.L., Sánchez, M.V. (2023). A Proposal for the Distribution of Medicines and Medical Equipment in Mexico. In: García Alcaraz, J.L., Manotas Duque, D.F., González-Ramírez, R.G., Chong Chong, M.G., de Brito Junior, I. (eds) Supply Chain Management Strategies and Methodologies. Lecture Notes in Logistics. Springer, Cham. https://doi.org/10.1007/978-3-031-32032-3_10
Download citation
DOI: https://doi.org/10.1007/978-3-031-32032-3_10
Published:
Publisher Name: Springer, Cham
Print ISBN: 978-3-031-32031-6
Online ISBN: 978-3-031-32032-3
eBook Packages: Business and ManagementBusiness and Management (R0)