
Abstract
This chapter introduces the different European electricity markets and explains the basic principles of these markets and how they are interlinked with each other. Since liberalisation, rules of the markets have been adjusted repeatedly to adapt to new fundamental situations. For example, intraday markets have become relevant with higher shares of renewable energies and the need to balance their uncertain day-ahead forecast in a market close to delivery. The chapter starts with an overview of spot markets, including day-ahead and intraday markets and cross-border trading. Spot markets generally act as a reference for the other markets. But other markets are also crucial for a proper operation of the electricity system. The role of the different markets and mechanisms (derivative markets, control reserve markets, provision of system services, capacity mechanism and congestion management) are discussed in the adjoining subchapters. Furthermore, retail markets and their functioning are described. Besides sections on retail contract types, competition in retail markets and energy poverty, key ratios such as self-supply and autonomy are introduced for the characterisation of decentralised energy sources. As competitive electricity markets in Europe substantially differ from those in North America, this chapter ends with a comparison of the design of European and North American markets.
Access provided by Autonomous University of Puebla. Download chapter PDF
After the theoretical explanation of markets and their functioning in the preceding chapters, this chapter introduces the different European electricity markets and explains the basic principles of these markets and how they are interlinked with each other. Since liberalisation, rules of the markets have been adjusted several times and adapted to new fundamental situations. A good example is the introduction of intraday markets, which got relevant with higher shares of renewable energies and the need to balance their uncertain day-ahead forecast in a further market before real-time balancing.
This chapter starts with an overview of spot markets, including day-ahead and intraday markets and cross-border trading. Spot markets generally act as a reference for the other markets. But other markets are also crucial for a proper operation of the electricity system. The role of the different markets and mechanisms – derivative markets, control reserve markets, provision of system services, capacity mechanism and congestion management – are explained in the adjoining subchapters. Furthermore, retail markets and their functioning are described. Besides sections on retail contract types, competition in retail markets and energy poverty, key ratios (self-supply, autonomy) for the characterisation of decentralised energy sources are also introduced. As electricity markets in Europe are differently designed than in North America, this chapter ends with a comparison of the design of European and North American markets.
After having gone through this chapter, you will be able to
-
Describe the basic principles of European electricity markets and how they are interlinked with each other.
-
Describe the difference between continuous and spot market trading making use of the example of intraday and day-ahead markets.
-
Understand how cross-border trading is organised in Europe.
-
Explain what power reserves are distinguished and how these are organised.
-
Describe how congestion management is organised and which methods are used for capacity allocation and alleviation.
-
Explain the basic functioning of retail markets and corresponding contract types.
-
Understand competition on retail markets and how retail prices are formed.
-
Explain the indicators self-supply, grid parity and level of autonomy.
-
Explain the difference between European and US power markets.
10.1 Spot Markets
When electricity markets in Europe were deregulated, spot market trading usually occurred the day before delivery. Correspondingly, the term spot market is frequently used synonymously to day-ahead markets (cf. Sect. 10.1.1). But more recently, intraday trading has become increasingly important (Sect. 10.1.2) and also cross-border trade has been developed much further (Sect. 10.1.3).
10.1.1 Day-Ahead Markets
The market price in the day-ahead market is determined by matching offers from the supply and demand side. Supply is primarily provided by generators and demand is stemming mainly from energy utilities and large retailers who serve end consumers (see, e.g., in Sect. 7.1.4). In an auction-based market (see Sect. 8.3), a supply and demand equilibrium and the corresponding market clearing price is determined, usually on an hourly – partly also on a quarter-hourly – time interval for the 24 h of the following day. As prices are calculated for every single hour of a day, in general, 24 prices for electricity on the next day are determined.
Trade on the day-ahead market is generally organised with a fixed closing time, e.g. 12 o’clock on EPEX SPOT, where all collected bids are matched and a unique market price for every hour of the following day and physical delivery at a given location is derived. It is thereby not only possible to trade single hours of the following day but also to submit so-called block bids.Footnote 1 Multiple hours of a day can be combined to block bids and various standardised products combining several hours (e.g. base- or peak-load) are already defined on the energy exchanges. These combined orders refer to different hour contracts for the same day and delivery location and have to be either buy or ask bids. All orders of block bids are either executed entirely or not executed at all (so-called Fill-or-Kill criterion). This type of bidding is especially relevant for less flexible technologies and smaller portfolios, where the operator has to decide to turn on a unit for several consecutive hours to fulfil minimum operation hour requirements (see Sect. 4.4.1.3). Even if the market price for a single hour is below the accepted price of a block bid, this single hour may be accepted as part of a block bid. However, this will only happen if the average price over the combined hours is higher than the bid for the hour block. Else the bid will not be executed at all. This allows, for example, to commit the whole capacity of a plant for eight consecutive hours instead of risking a shut-down of the plant in hours with low electricity prices (in the case of bidding every single hour separately). This is an advantage for the market participants yet comes at the expense of higher computational complexity for the energy exchange. Notably, handling such bids requires the introduction of binary variables, leading to a mixed-integer model for the market clearing (see also Sect. 4.4.1.3).Footnote 2
Several day-ahead markets for electricity exist in Europe: electricity, e.g., from Austria, France and Germany is traded on the EPEX SPOT in Paris, electricity from Scandinavian countries on the Nord Pool. Further energy exchanges are Omie for the Iberian Peninsula, PolPX for Poland, PXE for Czech Republic, Hungary, Romania and Slovakia. Also, Great Britain and Ireland initially traded their electricity purely nationally.
Over the years, electricity markets have undergone several significant developments. Besides changes in the underlying generation mix (such as the increased penetration of renewables and the nuclear phase-out in countries like Germany), significant changes have been made in regulation and market design. The introduction of the European emission trading system in 2005 (see Sect. 6.2.4.1) has created additional interdependencies and affected the pricing in electricity markets. Also, the introduction of negative prices and the establishment of competitive procurement procedures for reserves (see Sect. 10.3) have affected price formation and market outcomes. Furthermore, provisions have been made for the rare cases when the day-ahead auction leads to tight market conditions (very low or very high prices). Then a second auction is held, which allows participants to adjust their bids to facilitate market clearing. However, the most significant changes over the last two decades have been the introduction of intraday markets and an increasingly international market coupling, as discussed in the following sections.
10.1.2 Intraday Markets
Day-ahead markets can be considered the reference markets in most power systems and result in an allocation close to that at delivery or real time. However, after closing the auction, new information can emerge within the time frame between the closure of the day-ahead market and physical delivery. Forecast updates for weather-dependent renewables like wind and solar are one source of new information. With higher penetration of these renewables, significant deviations may arise between the forecasted and the final feed-in. Yet, power plant outages or unexpected changes in demand also induce information updates, which cannot be handled in day-ahead markets. So-called intraday markets therefore provide the possibility to react to changes in forecasts over time by allowing market participants to trade electricity close to physical delivery.
Whereas in the Scandinavian countries, some intraday trade has been practised for more than twenty years in the ELBAS market and on the regulatory power market platform run by the Scandinavian TSOs, mediated trading in continental Europe only started around 2010. It has been expanding considerably, at least in Central West Europe (Germany, Benelux and France). Contrarily to the day-ahead market, it is organised as continuous trading, which enables an immediate reaction to updated information, be it a power plant outage or an updated wind forecast.
Nowadays, intraday trading is possible in many European countries until 60 min or even less before delivery. Day-ahead and intraday markets for electricity are organised as double-sided markets, allowing buyers and sellers to submit offers. In the day-ahead market for electricity, buyers and sellers submit their offers to a power exchange, which determines the price periodically, in general once per day for the 24 h of the following day. The power exchange uses the submitted sell orders to construct a supply function and the submitted buy orders to find a demand function for electricity. The intercept of both functions results in the price. In contrast to that, continuous trading delegates the clearing process to the market participants. The power exchange only provides a platform that gives information to the participants and enables them to conclude transactions with each other. This platform is usually the “open order book” with limit orders for purchases and sales (see Sect. 8.3). Through market orders, i.e. orders with unlimited prices, traders may then directly and on a continuous time scale execute trades – or alternatively include their own limit orders to increase the available volume in the order book. In general, European intraday markets are organised as continuous trading, sometimes there is also an opening auction, e.g. in Germany.
10.1.3 Cross-Border Trading
As with other goods, trade in electricity between two or more countries will increase the welfare of all participating countries as market participants have access to a larger market for sales or purchases (cf. also Sect. 7.2).Footnote 3 As electricity trade is only possible via cross-border power lines, two questions are crucial when organising electricity trade between two countries: How should the trade be organised? And how much transport capacity between countries can be considered for trading?
Allocation methods like first-come-first-served and/or pro-rata, which were applied before deregulation and in the early years thereafter fail the criteria of being non-discriminatory and market-based. Today, the applied methods may be distinguished by several aspects (see also Sect. 10.6). Two main mechanisms to allocate capacity between two neighbouring markets can be distinguished: explicit versus implicit auctions. While some years ago, explicit allocation schemes were state-of-the-art in Europe, nowadays implicit auctions are dominating. Explicit auctioning means that the right to cause a power flow over interconnections between countries is auctioned to the market separately and independently from the marketplaces for electricity trading. Hence, traders have to buy a transmission right to implement a trade between two countries and they have to enter two separate trades on the markets of the two countries. The transmission operators generally care about the contracts and allows for exchange as long as physical interconnection capacities are not exceeded. Capacity may be auctioned at different time scales, e.g. in annual, monthly and daily auctions. Such trading requires a low degree of integration and coordination between the involved grid and market operators. Furthermore, there is no necessity for a common trading platform nor simultaneous clearing of day-ahead markets between countries under such a market mechanism. However, as prices for both markets and the price for the transmission right are not known ex-ante, this mechanism may lead to an inefficient result. Frequently, interconnector capacity is not fully used and cross-border traders have failed to correctly anticipate the price spread between countries, sometimes resulting in acquiring the transmission capacity in the “wrong” direction. Despite this being recognised for day-ahead markets, long-term trading of cross-border capacities is still based on explicit auctioning in Europe. Also here, a coordinated capacity calculation was introduced in Europe. The Network Code on Forward Capacity Allocation establishes rules for long-term cross-border capacity assignments. These are intended to enable market participants to secure capacity on cross-border lines up to several years in advance. These capacities often correspond to physical transmission rights, as opposed to financial transmission rights used in nodal markets (see Sect. 10.6.1). By allowing such deals a long time in advance hedging against congestions is enabled. A so-called joint allocation office (JAO) has been established, which provides a single auction platform and point of contact to facilitate the purchasing and selling of transmission capacity.
In contrast to these explicit auctions, implicit auctioning means that cross-border capacities are included in a centralised clearing of local power exchanges. Market clearing for transmission rights and electricity occurs simultaneously and the resulting prices per area reflect both the cost of energy and congestion. If no congestion occurs, prices in the two countries are equal (cf. Sect. 7.2). In consequence, market participants only submit bids to the marketplaces in their respective country. As part of the auction process, cross-border bids and, as a result, deliveries are automatically generated by the system, which aligns the resulting prices of the two countries as far as available capacities allow. If, for example, separate auctions in Germany and France have as a result that the daily price in Germany is lower than in France, the affected power exchanges automatically generate a delivery from Germany to France which either completely aligns the price or, if this is not possible, at least utilises all short-term cross-border capacities from Germany to France. In consequence, the best possible alignment of short-term prices is achieved (see Sect. 7.2). Further aspects of organising trade between countries, such as market coupling versus market splitting, volume coupling versus price coupling, available transfer capacity versus flow-based methodologies and zonal versus nodal prices are discussed in the section on congestion management in electricity markets (see Sect. 10.6).
10.2 Derivative Markets
Besides trading on the spot markets, the European markets also offer numerous possibilities to trade derivatives. Table 10.1 provides an overview of the exchanges offering derivative trading for electricity market products in European countries and the corresponding trading volumes.
Several points are worth noting:
-
Derivative trading is possible in most countries. The only exceptions are Malta and Cyprus and the South-East European countries Bulgaria, Croatia and Slovenia. Derivative trading is usually organised as continuous trading with opening and closing auctions, as is typical for financial markets.
-
In some countries, multiple exchanges propose trades in power derivatives, even if there is only one spot market operator. There has been substantial consolidation across Europe and beyond in the active exchanges. Besides the Germany-based European Energy Exchange (EEX), the US-based Intercontinental Exchange (ICE) and NASDAQ are the most important players. NASDAQ notably has overtaken the power derivative trading in the Nordic and Baltic markets.
-
The trading volume on OTC markets exceeds in many countries the volume traded on power exchanges. The opposite is yet true in the Nordic and Baltic markets.
-
Options are much less traded than forwards and futures – in some countries, even no option products are offered. And when they are offered, trading is lower by a factor of 20 or so than the trades in forwards and futures. Nevertheless, the concept of options and the techniques for their valuation are useful for dealing with flexibilities (cf. Chaps. 8 and 11).
-
The churn rate is a useful measure to compare trading volumes among countries of different sizes. It corresponds to the quotient of the trading volume and the annual consumption. These churn rates strongly vary among countries. In general, trading volumes and churn rates are the highest for large countries. But derivative trading is also vital in the Nord Pool market (Nordic and Baltic countries).
-
A churn rate of 1000% is sometimes postulated as a minimum requirement for liquid trading – which makes it attractive for pure financial players. No European power derivative market reaches this churn rate and according to the numbers provided, even a churn rate of 500% is only reached in the (then existing) common market area Germany–Austria–Luxemburg and in Estonia. In recent years, power derivative trading has even seen further slight decreases. This is partly attributable to additional regulatory requirements related to European directives put into place in the aftermath of the global financial crisis of 2008.Footnote 4 Here the balance between the necessary preservation of financial stability and overregulation of relatively small players (in the context of financial organisations) has to be found.
10.3 Management of Reserves
As discussed in Sect. 5.1.4.2, various so-called ancillary services or system services are required to operate the electricity network. Among those, reserves used for frequency control become more and more procured on a market basis. In recent years, the European regulation has not only issued harmonised definitions of different reserve power categories, but also the European Network CodesFootnote 5 streamline the corresponding operational procedures in view of cross-border competitive procurement. These define three processes along with the corresponding types of reserves:
FCP: Frequency Containment Process. As indicated by its name, this process aims at maintaining the grid frequency within an acceptable range around its setpoint of 50 Hz. This is done by automatically activating the so-called FCR: Frequency Containment reserves.Footnote 6
FRP: Frequency Restoration Process. Whereas the FCP aims at limiting frequency deviations, the FRP has the objective to re-establish the frequency at 50 Hz while at the same time also restoring the inter-area power flows to their scheduled values. Thereby two types of reserves are used:
-
aFRR: Frequency Restoration Reserves with automatic activation
-
mFRR: Frequency Restoration Reserves with manual activation.
RRP: Reserve Replacement Process. As the third step in reserve management, the RRP may re-establish the previously activated reserves. This is done using so-called RR: Replacement Reserves.
Note that the RRP, in contrast to the first two processes, is not mandatory across the EU. For example, since the deregulation of the electricity market in late 1990, Germany has not had a process for reserve restoration. Furthermore, these processes are supplemented in the European Network Codes by processes for exchanging reserves between TSO areas. The TSOs handle these processes, yet the assets used to provide the reserves are due to unbundling requirements (see Sect. 6.1) usually not under the direct control of the TSOs. Hence, the question arises of how these resources may be procured. Over the years, more and more market-based procurement mechanisms have been established and they have increasingly become international, too.
For these markets, the following three general challenges arise:
-
the close coordination needed between short-term grid operation and generation (or more generally flexibility) operation
-
the technical restrictions relating to the provision of reserves and the energy provision in (conventional and other) power plants
-
the avoidance of excessive market entry barriers and the related danger of abuse of market power.
At the same time, several important design choices for reserve markets have to be made:
-
1.
Product design
-
2.
Procurement periods
-
3.
Prequalification requirements
-
4.
Auction design
-
5.
Bid remuneration approach
-
6.
Auction timing.
1. Product design: Since imbalances between feed-in and off-take from the grid may occur in both directions, one has to decide whether there should be one symmetric product including both reserves for upward and downward regulations, or instead separate products for upward regulation (positive reserve) and downward regulation (negative reserve). In continental Europe, FCR is procured as a single symmetric product since rapid activation in both directions is required. By contrast, all other reserves are procured using separate products to enable bids from different types of flexibilities, both from the demand and supply sides. So this contributes to lowering the market entry barriers.
2. Procurement periods: From a TSO perspective, a long procurement period is advantageous since reserve capacities are secured long in advance. However, in terms of the economic efficiency of the reserve markets, short procurement periods with as short as possible lead-times are advantageous. With short lead-times, suppliers better know both their units’ availability and the opportunity costs associated with reserve provision. Similarly, short procurement periods also enable more targeted bids and will lead to a higher efficiency of the reserve markets (cf. Just 2011). Over time, we have seen a gradual reduction of the procurement periods – for aFRR in Germany from half-yearly bids down to four-hour block bids. This has fostered market entry and increased competition.
3. Prequalification requirements: Participation in the reserve markets usually necessitates the corresponding units undergo a prior prequalification. Thereby the TSOs notably check that the technical equipment of the units enables them to follow the activation signals received from the TSO. Very restrictive prequalification rules may contribute to a higher technical reliability of the power system. Yet, they also form barriers to market entry, especially for smaller and unconventional reserve providers such as storages and demand response. Therefore, tight prequalification requirements may contribute to a higher reliability but may reinforce the position of the incumbents and may enable them to exercise market power.
4. Auction design: The reserve markets operate as single-sided multi-unit auctions, i.e. with multiple sellers and the TSO(s) as a single buyer. This is different from the day-ahead electricity market with its double-sided auction (cf. Sect. 10.1). The central question is whether the providers should be paid for the capacity, energy or both. A capacity payment is analogous to an option premium, paid on financial markets, as it is received independently of the actual use of the reserve. The energy payment then corresponds to the strike price that is received when the flexibility is used.
Empirical evidence on the paid compensation is mixed. In Germany, FCR is only remunerated on a capacity basis, whereas aFRR and mFRR are paid both for the capacity and the energy they provide. In the Nordic countries, where predominantly mFRR was used in the past, it has been procured on the so-called regulating power market and remunerated purely on an energy basis.
These at first sight inconsistent findings may be explained by the differences in (opportunity) costs faced by the relevant providers. In the case of FCR, the symmetric product design and the over time rather balanced activation of positive and negative reserves imply that there are little energy costs. Capacity costs arise since the capacity may not be marketed on the power market. Since FCR has to be provided from spinning units, capacity costs may also arise because the units have to be kept in operation during periods with prices lower than variable costs – these are the opportunity costs associated with the must-run condition. Those also may arise when thermal power plants provide positive FRR. At the same time, the split products imply that positive energy costs will arise when positive reserves are activated. Conversely, the activation of negative reserves implies savings in fuel consumption for conventional power plants (since they are producing less) or additional electricity offered for consumption in case of demand response. Hence, a negative energy price for these reserves should be expected, i.e. paid by the reserve provider to the TSO. The Nordic system is hydro-dominated, and reserves are also mainly provided by hydropower plants (see also Sect. 8.5.5). At the same time, generation capacity is not scarce in these systems, rather the energy stored in the reservoirs. Therefore, it seems natural that capacity is not priced there but energy.
5. Bid remuneration approach: An aspect related to auction design is the payment principle. In multi-unit auctions, either each unit may receive the same (marginal) price – as in the day-ahead electricity market. Or each unit is paid its own bidding price – this is then called “pay-as-bid” instead of “pay-as-cleared”. In the past, reserve procurement auctions have been frequently held using the pay-as-bid approach. The current European regulation advocates pay-as-cleared. At first sight, this may be considered inefficient since some providers are paid more than they are asking for. The advantage of pay-as-cleared is that suppliers have fewer incentives to submit non-cost-based bids. In fact, in a pay-as-bid market, suppliers base their prices on their best estimate of the marginal bid, so these markets may be named “guess the clearing price” (cf. Cramton and Stoft 2006; Swider and Weber 2007). This will foster collusion, i.e. anti-competitive behaviour, and raise entry barriers for newcomers and small firms in general since those have typically fewer competencies in forecasting the price.
6. Auction timing: Another key aspect for efficient market operation is the timing of reserve auctions relative to the day-ahead electricity market. A co-optimisation of energy and reserve provision will lead to the best results from an overall system perspective. And this is the approach implemented in competitive US markets (cf. also Sect. 10.8). In Europe, the markets are cleared separately, not least since the power exchanges and OTC trading platforms are institutionally separated from the grid operators. In contrast, the American Independent System Operators (ISOs) have joint responsibility for market and system operation. In continental Europe, the procurement auctions for reserves have traditionally been held before the day-ahead power market. This ensures sufficient liquidity on the reserve power marketsFootnote 7 since unit commitment decisions have not yet been taken and units selected on the reserve power markets may sell their resulting must-run generation on the day-ahead market. At the same time, the unit commitments obtained as an outcome of the reserve market may be inefficient given the results of the day-ahead market. If rescheduling is not possible through portfolio-internal swaps or a secondary market, this will result in inefficiencies. Therefore, a later selection of power plants for reserve provision is, in principle, advantageous. It is typically implemented in markets where unit commitment decisions are less constraining and also further limitations to reserve provision like ramping constraints do not play an as important role – i.e. the Nordic countries. In other countries, there is increasingly the possibility for units not retained in the procurement auction for reserve capacities to submit a so-called free energy bid, i.e. to propose un-scheduled capacities after the day-ahead electricity market for activation as reserves.
10.4 Provision of Other System Services
Besides load–frequency control, grid operators must perform other regular system operation tasks and be prepared to cope with fault and emergency situations. The most important tasks in normal operation are (see also Sect. 5.1.4):
-
voltage control and
-
congestion management.
In fault and emergency states, the following tasks have to be performed:
-
short-circuit management and
-
restoration of supply.
In future power systems with high shares of power electronics-based generation technologies such as solar and wind power, also the following tasks are expected to gain importance:
-
very short-term frequency stabilisation and
-
grid (or frequency) forming.
To perform these tasks, grid operators make use of the ancillary services discussed in Sect. 5.1.4.2. Subsequently, the possibilities for market-based procurement of these services are discussed.
Voltage control ensures that voltage at all grid nodes remains within predefined bounds. Voltage control is mainly performed by adjusting the reactive power infeed locally. Like congestion management, it is hence a task to be performed locally in the grid. Thus, the use of standard short-term markets without local discrimination is not adequate. At the same time, conventional generation units can provide reactive power within a broad range at relatively low costs. Therefore, the provision of reactive power is either mandatory for large-scale power generation units in European electricity systems or its provision and remuneration is dealt with through bilateral contracts. In addition, devices installed and operated directly by grid operators may be used for voltage control, e.g. tap-changing transformers or FACTS, cf. Sect. 5.1.4.2. In this case, market-based solutions to voltage control become even more questionable.Footnote 8
Congestion management is dealt with in more detail in Sect. 10.6 and therefore not considered further here.
Short circuit management, as described above, relies on the overcurrent induced by faults and provided by the conventional large-scale generators. This mechanism is more or less a by-product of the technical characteristics of conventional generators and their operation mode. Correspondingly, no market mechanism is currently in place to handle this ancillary service, instead it is specified in the grid connection codes.
Restoration of supply capabilities are required to cope with the (hopefully unlikely) event of large-scale disruption in electricity supply. In such a case, units are needed that are able to black start. Grid operators (usually TSOs) have to ensure the availability of sufficient generation capacities with black start capabilities in their control area, and they will make emergency plans on how to rebuild an operating grid after such a large-scale failure gradually. As this ancillary service is rarely needed and requires appropriate location of resources and close coordination with the TSO, it hardly may be procured through short-term markets. It is rather more appropriately handled through negotiated bilateral contracts where competitive bids from distributed generation may play an increasing role in the future.
As discussed above, conventional generation units currently provide vital services to cope with the tasks mentioned earlier. With the transformation of the electricity system towards a system based predominantly on renewable energies, new concepts and solutions have to be developed to secure the stable operation of the grid (cf. Sect. 12.3). Moreover, some additional issues arise where separate ancillary services have not been defined so far.
Very short-term frequency stabilisation is currently provided by the instantaneous reserve that results from the inertia in the system (cf. Sect. 5.1.4.2). In conventional systems, the rotating masses of generators and turbines in large-scale units provide sufficient inertia to dampen frequency drops in the very short run and achieve an instantaneous reaction to imbalances. However, as wind turbines, solar panels and batteries are based on electronic DC-AC converters, they do not provide such inertia to the system. Consequently, it may be required to treat instantaneous reserve as an additional reserve category with a corresponding procurement market. This reserve could then, e.g., be procured from very short-term storage – yet the actual delivery of this service also requires methods of measurement that detect very rapidly upcoming imbalances (cf. e.g. MIGRATE 2018).
Grid (or frequency) forming is an additional requirement that synchronous generators currently deal with in large-scale conventional power plants. By rotating at the pre-specified synchronous frequency (50 Hz in Europe), the synchronous generators provide a sinusoidal voltage signal of precisely this frequency. The converters in power electronics-based systems are also capable of following an externally defined regular frequency signal. Without additional control concepts, they will not be able to generate or stabilise such a frequency signal. Hence, forming the grid frequency is an additional task to be performed by some grid elements in future grids. However, the regulatory and market framework for the provision of these ancillary services still has to be investigated.
10.5 Capacity Mechanisms
There are serious concerns about whether an energy-only market (EOM), where only the produced electricity is remunerated (€/MWh), can provide sufficient investment incentives to ensure (long-term) supply adequacy. Supply adequacy is thereby understood as the ability of the system to meet the energy requirements of all consumers, so-called long-term supply security. In contrast, supply security is the ability of the system to withstand disturbances, so-called short-term supply security (cf. e.g. Oren 2003).
In contrast to regulated electricity markets, no specific player is responsible for the provision of an adequate level of supply adequacyFootnote 9 in a liberalised energy-only market. This responsibility is handed over to market signals. A company will invest as soon as the expected rate of return due to market prices satisfies the individual investment profitability requirements.
In an EOM, times of scarcity are compulsory. In such scarcity hours, market prices are higher than the short-run marginal costs of the price-setting power plant. In reality, the market prices will be rather a function of the level of scarcity: the scarcer the market is, the higher the prices are. In real scarcity, the equilibrium price will be set by the demand side (see Fig. 7.1, outmost right demand curve). In such a situation, the market price will correspond to the willingness-to-pay (WTP) of the last served customer. This allows owners of power plants to recover their fixed operational and capital costs (see Sect. 7.4). However, due to imperfections of electricity markets, especially the lack of demand elasticity and the limited possibilities to control the real-time electricity flows (cf. e.g. Stoft 2002, pp. 14–16 and Joskow and Tirole 2007), the functioning of energy-only markets in reality is often seriously questioned. Furthermore, scarcity prices might be rather seldom. For example, they might only appear during a few hours of a freezing winter due to a significantly increased heat demand. Therefore, the corresponding revenue streams are highly uncertain. This holds especially true for electricity markets characterised by overcapacities during most hours of the year, e.g. due to an increasing share of fluctuating renewable electricity production, which is incentivised by additional support schemes (see Sect. 6.2.4.2), and market coupling activities. Therefore, an investment in new generation units will result in a high risk for the investor, and such volatile revenues may discourage investments.Footnote 10 Furthermore, very high price spikes – even if they only arise for a few hours of the year – are sometimes seen to be politically unacceptable, resulting in governmental intervention by introducing price caps (upper limits) for electricity prices, which might lead to the so-called missing-money problem and according to a discouragement of potential investors (see, e.g., Cramton and Ockenfels 2012; Hogan 2005 and Sect. 7.4.1).
In general, a possibility to manage the volatility of wholesale electricity prices and the corresponding risks would be an increased forward contracting between generators and retail companies or load-serving entities (LSE), which would buy these contracts for their customers (see de Vries and Hakvoort 2004, pp. 7–9). With the help of such long-term contracts, electricity customers could be protected against very high and power generators against very low electricity prices. Yet such contracts might increase the costs and therewith also the prices for electricity sold by companies participating in these long-term markets. This might reduce their sales volumes as long as customers are free to choose their retailer. Furthermore, as power flows to specific customers can currently hardly be limited (without limiting all power flows in the corresponding district), even customers bound by contract to another retailer (and not having bought these long-term contracts) would possibly be supplied in the case of scarcity.
One possibility to avoid the flaw caused by the limited possibility to control power flows is to allow competition only on the generation and not on the retail side (see Newbery 2002, pp. 30–32). Then the obligation to order an adequate level of supply adequacy would be given to load-serving entities. These entities would have to be the supplier for all customers in a specific region and would purchase supply adequacy for them. The obvious disadvantage of such a solution is that customers may not freely choose their suppliers.
Another solution could be to let customers become an active part of the system, which has only partly been realised in electricity markets. This could be achieved with the help of so-called capacity subscriptions (see, e.g., Grande et al. 2001), which would allow customers to choose the desired level of reliability. Again the lack of real-time control of power flows has so far hindered the use of such contracts, with the help of which consumers could choose their reliability level according to their needs. In the future, installing smart meters with load-limiting devices could remedy this flaw, transforming the good reliability into a private good (see Table 6.4). On the other hand, such a solution means that customers would have to estimate their capacity demand, which would require that consumers have to look into the details of their power consumption in a much more intensive way (which is not very likely for most (small) customers).
Another opportunity to provide less risky revenue streams for power plant operators is to establish remuneration mechanisms to influence the installation of electricity generating capacity (Joskow 2008), so-called capacity mechanisms. By establishing an additional revenue stream (€/kW) for power plant operators, the need for high wholesale electricity prices to provide sufficient investment incentives will be reduced or even totally eliminated. These remuneration mechanisms can be differentiated according to various aspects; most important seem to be at least the following two:
-
targeted versus market-wide remuneration mechanisms; whereas only selected technologies would be addressed with a targeted mechanism, all units (e.g. generation, storage, demand side) could participate in a market-wide mechanism.
-
volume-based versus price-based mechanisms; in a volume-based mechanism, the regulator sets the required capacity and the price is fixed through the market. Conversely, the remuneration price is exogenously set in a price-based mechanism.Footnote 11
Figure 10.1 shows the classification of capacity mechanisms used by the European Commission (cf. EC 2016, p. 50). An overview of capacity remuneration mechanisms in place in Europe and the USA is given in Bublitz et al. (2019).

Source Own illustration based on EC (2016, p. 50)
Different forms of capacity mechanisms.
A straightforward and easy way to establish a new revenue stream for the provision of electricity generating capacity is that an authority pays a fixed price per megawatt of installed (or available) capacity (see price-based mechanisms 1 and 4 in Fig. 10.1). The challenging questions here are which units are eligible for this payment (all or only those fulfilling specific criteria) and how the price per megawatt is determined.
Within the category of volume-based mechanisms, many different concepts exist (for more information see, e.g., ACER 2013; Bublitz et al. 2016; Höschle 2018; de Vries 2004):
-
Tender for new capacity (2 in Fig. 10.1): by establishing a tender, the construction of new units, e.g. new power plants, is supported in order to establish the additionally needed capacity. Once the installations have been connected to the grid, they can either be integrated into the energy markets or be further supported through a power purchase agreement.
-
Reserve (3 in Fig. 10.1): in a so-called strategic reserve, the required capacity is contracted by the (transmission) system operator, e.g. using a competitive tendering process. The strategic reserve is held back from spot and control reserve markets and is only used in emergency cases. This means the reserve will be activated through instructions of the system operator when there is a shortage of generation capacity in the market or when a given threshold concerning wholesale electricity prices is exceeded. Typically, this will result in rather old power plants to be transferred into a strategic reserve. This capacity mechanism can lead to the problem that more and more capacities are needed in the strategic reserve, once power plants leave the regular markets to become part of this reserve (a so-called slippery slope). Another kind of capacity reserve is the so-called operating reserve. Here the system operator contracts the required capacity by using frequent, e.g. daily, auctions.
-
Central buyer (5 in Fig. 10.1): in such a centralised capacity market, a central buyer is responsible for calculating and procuring the required capacity. The dispatch of the corresponding units is not within his field of responsibility. To open the concept for new units, the bidding process for the capacities should be realised a considerable time before the delivery period. In so-called forward capacity markets, the capacity required is tendered some years in advance, giving multi-year contracts to new units and yearly contracts to existing units (see, e.g., Cramton and Stoft 2006; Bhagwat et al. 2017). In general, the challenge of the central buyer concept is to calculate the capacity demand, which should be sufficient to secure supply adequacy. To realise this, the central buyer might develop a so-called downward sloping capacity demand curve, which starts with a price cap that is often derived from the costs for new peak power plants (Cost of New Entry, CONE) and ends with a price of zero for the maximal demand level (see Fig. 10.2 and, e.g., Höschle 2018, pp. 46–48). The intersection of this demand curve and the supply curve, determined, e.g., with the help of a (Dutch) auction, leads to the capacity market clearing price and the contracted capacity.
Fig. 10.2 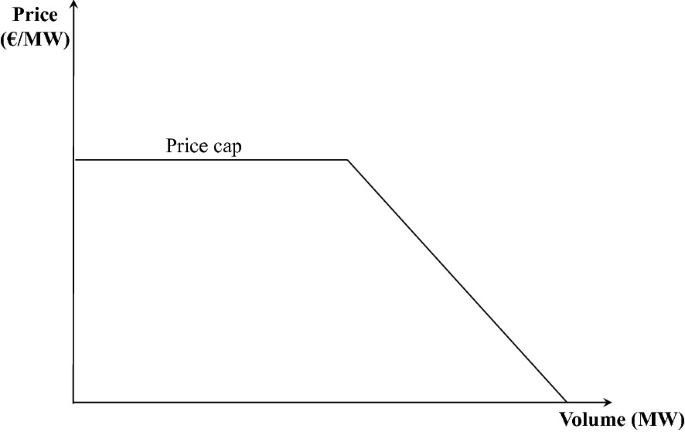
Source Own illustration based on Bhagwat et al. (2017)
Simplified typical capacity demand curve.
If generators have sold their capacity but are not producing during scarcity situations, they have to pay a penalty. Sometimes this incentive to produce during scarcity situations is seen to be insufficient, which has led to an important refinement of centralised capacity markets: the so-called reliability options (see, e.g., Pérez-Arriaga 1999). Under such a concept, the capacity owners sell call options to the central buyer, giving him the right to be compensated by the difference between the electricity wholesale price and the option’s strike price. Therefore, the central buyer has not only to determine the demand of capacity needed, but also the strike price, which should be higher than the highest marginal cost of the capacity units available. Reliability options lead to an incentive to make capacities, whose electricity production has been sold via a call option, available during scarcity situations.
-
Decentral obligation (6 in Fig. 10.1): an obligation is placed on all load-serving entities to secure the total capacity they need to meet their consumers’ demand. In contrast to the central buyer model, a central planning authority is not required, and a central bidding process is not needed. Instead, individual contracts between load-serving entities and capacity providers might be negotiated.

The fact that the costs of excess capacity are typically much lower than the costs of undersupply supports the introduction of a capacity mechanism, yet the problems of designing these mechanisms are manifold. Obviously, there is a risk of regulatory failure. The ongoing redesign of capacity mechanisms worldwide illustrates the challenge to define adequate levels for the different parameters (e.g. the price in price-based and the demand in volume-based instruments). Furthermore, the cross-border effects of capacity mechanisms, e.g. due to lower wholesale prices in countries with capacity mechanisms, have to be considered.
10.6 Congestion Management in Electricity Markets
Congestion in the electricity system means that the existing power lines cannot realise all electricity flows requested by market participants. Accommodating these flows could violate existing physical (thermal) limits of the lines and transformers of TSOs or DSOs. But even if a congestion is identified, this will not necessarily mean that thermal limits are violated because the system operators detect a congestion with the help of load flow calculations considering the N-1 criterionFootnote 12 (so-called contingency analysis; see Sect. 5.1.4). There are manifold possibilities to classify mechanisms for congestion management, e.g. one might differentiate:
-
according to the technical reason responsible for the bottleneck into active power induced and reactive power induced congestion management,
-
according to the location of the congestion into inter-zonal and intra-zonal congestion management,
-
according to the voltage level, in which the congestion happened, into DSO or TSO congestion management,
-
according to the consideration of physical electricity flows into flow-based and not flow-based congestion management, or
-
according to the “lead time” into capacity allocation and congestion alleviation methods (cf. Androcec and Wangensteen 2006).
Subsequently, we structure the discussion along the distinction between capacity allocation and congestion alleviation methods.
10.6.1 Capacity Allocation Methods
Capacity allocation methods (also called long-termFootnote 13 or ex-anteFootnote 14 congestion management methods) aim at allocating the existing transmission (or distribution) capacity in an optimal way a certain period before the capacity is physically used. To allocate existing capacities, first, the maximum available capacity needs to be estimated. Therefore, limits for physical electricity transfer have to be calculated. Depending on the level of incorporation of physical power flows, the calculation procedure might be very demanding. Rather simplified calculations consider only characteristic load flow situations at typical days between two regions, assuming a direct pathway. Here the cross-border exchange is gradually augmented until the given restrictions are reached. To avoid overestimating the existing capacities while using such simplified methods, a reliability margin is subtracted from the calculated total transfer capacity (TTC), leading to the so-called net transfer capacities (NTC).
Flow-based methods try to consider the existing physical restrictions of the grid in a more elaborated way. An AC load flow or a linearised DC load flow model can be used to calculate the input data for flow-based market mechanisms. With the help of such a model, nodal Power Transfer Distribution Factors (PTDFs) are estimated (see Sects. 5.1.2.3 and 7.3). Nodal PTDFs show the influence of a change of the power infeed at a specific node on the power flows at critical branches in the grid. Depending on the power flow model used, AC PTDFs or DC PTDFs are computed (see Sect. 5.1.2.3). Furthermore, so-called Generation Shift Keys (GSKs) are estimated, which are used to predict how the production of a generation unit is affected by changes in the balance of the zone in which this unit is located. These GSKs are then used to transform the nodal PTDFs into zonal PTDFs. In addition to zonal PTDFs, an estimation of the still available transmission capacity for each critical branch – the so-called Remaining Available Margin (RAM) – is needed. For calculating these parameters, information about the power grid is again necessary, underlining the need to involve the TSOs (and possibly also DSOs) into the process. The use of PTDFs makes it possible to represent power flow restrictions in a more realistic way than by using NTC values. Nevertheless PTDFs are still an approximation and only valid under certain assumptions, e.g. static framework conditions (e.g. no topology changes (Duthaler et al. 2008)).
In general, the available transmission capacity can then be allocated via non-market-based mechanisms (e.g. priority rules like “first-come, first-serve(d)”) or market-based ones (e.g. auctioning of transmission capacities). In an explicit auctioning mechanism, separate markets for electricity and transmission capacity are put into place (cf. Sect. 10.1.3). This means that market participants have to submit bids for electricity and for physical transmission rights (PTR). As there are two separate auctions, bidders will lack information about the other commodity prices, which may lead to inefficient utilisation of transmission capacities. In particular, it can happen that market players do not use the PTR they purchased by an auction; e.g. they only purchased a PTR to prevent the use of it by their competitors, so that netting of opposite electricity flowsFootnote 15 cannot be realised. This can be avoided by introducing compensation payments if the rights are not used or the obligation to return the PTR in the case of not using it (“use it or lose it”). The auction process will lead to revenues obtained by the TSO that have to be taken for building new capacities or reducing use-of-system charges.
So-called implicit auctions might be used to avoid the information problem of explicit auctions. Under such a scheme, electricity and transmission capacities are traded together. Market participants in different regions do not have to trade transmission capacity but just make bids for buying or selling electricity at their exchange. The different markets are coupled (so-called market coupling), so that the orders from different markets can be exchanged. If sufficient transmission capacity is available, the wholesale electricity price will be the same in the different markets.Footnote 16 Otherwise, the electricity price difference shows the cost of congestion (cf. Sect. 7.2). To realise this, the exchange operators in the different regions must have information about the restrictions of the grid to consider the available transmission capacity in the market clearing process.
Market coupling leads to the same results as a market splitting mechanism, another form of implicit auctioning. The difference to market coupling is that there is only one exchange operator responsible for the different markets under a market splitting regime. As soon as congestions appear, the system splits into different markets. These concepts are also called zonal pricing, where different prices arise between zones (as soon as transmission capacities are scarce), but a uniform electricity price is maintained within the zone. Zonal borders should correspond to the bottlenecks of the specific transmission situations, meaning that zonal cuts depend on the transmission situation and should therefore be set dynamically. The current zonal pricing approach in Europe does not consider these dynamics but consists of (static) zones normally corresponding to national borders.
Considering all existing congestions – not only those between different zones as in zonal pricing – leads to the concept of nodal pricing (also called locational marginal pricing (LMP)). The principle of nodal electricity pricing may notably be traced back to Schweppe et al. (1988). These prices not only include generation costs but also the costs of transmission losses and congestions. A node in this context might be every location where electricity is fed into or withdrawn from the grid. Nodal prices represent the locational value of electricity (cf. Sect. 7.3), setting, on the one hand, the right incentives for investment decisions and guarantying, on the other hand, the optimal dispatch. As there is a need for a central system operator in charge of clearing the market considering network constraints, this kind of market design requires a central dispatch market (cf. Sect. 10.8). An obstacle for implementing nodal prices might be the corresponding distributional effects related to the fact that the prices might differ substantially at two different nodes (potentially even located next to each other).Footnote 17 So-called Financial Transmission Rights (FTRs) can be introduced to hedge against such price differences. FTRs are typically allocated with the help of auctionsFootnote 18 and give their owners the right to receive payments according to the congestion rent, if a congestion and for this reason different electricity prices occur (see, e.g., Kunz et al. 2016).
10.6.2 Congestion Alleviation and Redispatch
Congestion alleviation methods (which might also be called short-term or ex-postFootnote 19 congestion management methods) aim to manage expected congestions on a shorter time frame (see, e.g., Kunz 2013), typically after the clearing of the day-ahead market. On a short-term basis, e.g. based on results of their grid operation planning, system operators can partly alleviate congestions by grid-specific measures, like topology changes (switching operations), to directly influence the load flow. By switching transmission lines on and off or by using, e.g., flexible AC transmission systems (FACTS; see Sect. 5.1.3.2), the power flow can be actively channelled through the existing network. In addition to these rather technical, non-costly measures, market-related measures like redispatch and countertrading can be used.
In the case of redispatch, the system operator relieves transmission system overloads by giving instructions to installations located in front of and behind the congestion to adjust their production or demand; e.g. generators located in front of the congestion (in the so-called surplus region) have to reduce their output (negative redispatch), generators behind the congestion (in the so-called deficit region) have to increase their output (positive redispatch). It should be mentioned that by redispatching generation units, the (transmission) system operator directly intervenes in power plant decision-making, which seems to be more or less the opposite of what unbundling aims at (see Sect. 6.1). To illustrate the related costs of such a redispatch, a market comprising the region A and the region B is assumed in the following (cf. Nüßler 2012, pp. 12–18). In a one-price market, the grid is seen as a copper-plate (in other words, congestions are not considered when clearing the market), and therefore, market prices always have to be the same in both regions. Due to generation units with lower marginal costs, electricity will be exported from region A to region B (see diagram on the left in Fig. 10.3). If the resulting load flow exceeds the existing transmission capacity, the transmission system operator must adjust electricity generation in both regions (see diagram on the right in Fig. 10.3). Compared to the situation without congestion, generators located in region A (in the surplus region) have to decrease their output, generators in region B (in the deficit region) have to increase their production (in Fig. 10.3 by an amount equal to the distance between E and F). Savings partly compensate costs for increasing the output in the deficit region due to the reduction of production in the surplus region. Yet, the overall result is additional costs compared to a situation without congestions (see “Additional costs” in Fig. 10.3).

Source Own illustration based on Nüßler (2012, p. 15)
Market prices without (left) and with congestions (right).
Whereas in this form of redispatch (based on costs) only the directly connected costs would be reimbursed, a so-called market-based redispatch would compensate the redispatch by prices determined on a competitive basis. But, as the contribution of a unit to relieve a congestion strongly depends on the location of this unit, such a market has to take place on a local level, opening up possibilities to act strategically (cf. Hirth et al. 2019). Nevertheless, a market-based redispatch may provide some incentives to build power plants at locations where they are needed from a grid perspective. However, these incentives are neither as strong nor as consistent as under a nodal market design. To have sufficient installations that can be used for redispatch in the deficit region, the system operator has to have enough capacity for upward regulation. This could lead to the introduction of an additional “redispatch reserve” (see, e.g., the so-called Grid Reserve in Germany), which could even been seen as a kind of a capacity mechanism (see Sect. 10.5).
Another possibility to relieve the congestion is countertrading, where the (transmission) system operator counter-trades against the direction of the congested flow (e.g. between two bidding zones) to reduce the flow over the line.
If the described grid-specific and market-related measures are not sufficient to guarantee the stability of the grid, the (transmission) system operator can adjust the feed-in and outtake as a final measure. Within this feed-in management scheme, the reduction of renewable generation is called “curtailment”. Since installations based on renewable energy are mostly connected to the distribution grid, distribution grid operators (DSO) are affected mainly by renewable curtailment. As in many electricity systems, renewable energies enjoy priority access (see Sect. 6.2.4.2) to the grid, curtailment of renewables is seen as a last resort to relieve congestions. As electricity from renewable energies hardly causes any emissions and variable costs, the regulation often demands that system operators (using curtailment to relieve congestion) minimise the amount of curtailed renewable energy (cf. e.g. Schermeyer et al. 2018). However, it has to be emphasised here that curtailment may still be the least-cost option compared to alternatives such as grid expansion. Many studies seem to agree that some level of curtailment is economically advantageous (cf. e.g. Moser 2015; Schreiber et al. 2021, pp. 191–193), and at least in Germany, this is also foreseen according to the current regulation (cf. Bundestag 2022, §11).
Most Western European countries are still one-price zone, and price differences between zones (countries) reflect cross-border congestion. As congestions within countries (internal congestion) have increased during the last years, e.g. due to more electricity transport, (transmission) system operators had to intensify the practice of congestion management, mainly using redispatch and feed-in management to relieve the congestion. Using flexibilities provided, e.g. by demand-side applications (see Sect. 3.1.5), like cooling installations and cross-sector applications, like power-to-heat units, might help enhance congestion management in the future (cf. Chap. 12).
10.7 Retail Markets
The sales of electricity from electricity retailers to final customers are organised in retail markets. The range of end-use consumers and their electricity consumption is very heterogeneous, starting from small households via small businesses up to energy intensive industries, so a unique market with one price for all customers does not exist. In contrast to most spot markets, retail markets are based on bilateral contracts between electricity retailers and end-use consumers. The typical elements of retail contracts are discussed in Sect. 10.7.1. Section 10.7.2 is devoted to competition and prices in the retail market. The following two sections touch upon two topics that are attracting increasing attention in the context of the transition towards sustainable electricity systems: Sect. 10.7.3 addresses the issue of energy poverty, whereas Sect. 10.7.4 focuses on self-supply of customers based on rooftop PV or other distributed technologies.
10.7.1 Retail Contract Types
In general, retail contracts may be negotiated bilaterally (for large customers) or may be based on standardised offers by the suppliers (in the case of smaller clients). Yet even if negotiated bilaterally, contracts are primarily based on three kinds of price components as discussed earlier in the context of electricity tariffs (cf. Sect. 3.1.6):
-
Prices for the connection per month or year, this is often called the service price or the base price for retail customers,
-
Prices for the power or capacity measured in kilowatts (kW) or megawatts (MW),
-
Prices for the electric work or electrical energy measured in kilowatt-hours (kWh) or megawatt-hours (MWh).
In most European countries, retail markets for households, small commercial customers as well as larger industries can be distinguished reflecting their different needs for power and energy:
-
Larger and especially energy-intensive industries partly purchase their electricity directly on spot markets, ergo not on specific retail markets. However, this necessitates an exact forecast of hourly day-ahead electricity demand profiles. As a consequence, the hourly power demand of the following day has to be estimated by the customer (cf. Sect. 3.1.5) and deviations of this forecast are billed with the (possibly high) costs of balancing energy (see Sects. 8.2 and 8.4). An energy management system is necessary to handle this process and can only be operated economically if large amounts of (electrical) energy are purchased.
-
In contrast to large energy consumers, households may consume electricity in relation to their needs without being priced for the capacity used. Of course, the power off-take is limited by the technical limits of the building connection, yet there is no direct tariffing of power for households. However, the service fee (or base fee of the contract) can be seen as a power price for being connected to the given maximum power of the technical system.Footnote 20 In general, household consumers are charged for consumed electrical energy (in kWh) during a year (or a month) and the already mentioned additional monthly service fee (or base fee). Since European energy markets have been liberalised, household customers can select their energy contract from several energy retail companies. In general, web-based market platforms give an overview about available tariffs for different consumption levels (comparable to the communication market) and household customers select their energy retail companies according to various criteria (e.g. price per kWh, service charge, origin of power (e.g. green electricity), etc.).
-
Contracts for larger commercial customers, including shops, services, etc., comprise prices for power and energy. These contract types are usually applicable above a certain consumption threshold, e.g. more than 100,000 kWh in Germany. Hence, companies have an incentive to reduce their peak power to avoid paying huge sums on the capacity price, and they also have an incentive to reduce energy consumption. Prices for capacity and energy depend for commercial customers on the utilisation rate of the power connection. Among two companies with the same yearly amount of consumed electricity, the company with higher power peaks (and thus higher capacity charges) and correspondingly a lower utilisation rate will generally be charged with higher costs. This kind of pricing is plausible from a technical and economic point of view: the higher peak power may necessitate a higher technical power input resulting in higher costs, which the customer must cover. From an economic point of view, the higher peak power offers more flexibility to the customer, which also justifies these higher prices.Footnote 21 Due to the various components of electricity prices, tariffs for larger customers may also depend on the grid level they are connected to (see Sect. 6.1.4 for principles of network pricing).
10.7.2 Competition on Retail Markets and Retail Prices
Competition in retails market is different from the wholesale competition as the primary action variable for retailers are the sales prices (cf. also Sect. 9.4). Retailers usually set their various above-mentioned price components, notably their base or service price and energy price (kWh) (and the capacity price for larger customers). Additionally, they may offer premiums for switching and provide specific products like green or local electricity. Thus, it is not a homogenous market with a single price as on wholesale markets. Another difference between retail and wholesale markets is the time granularity. Typical retail contracts are set up for a delivery period of at least one year. In view of spot market procurement, the annual quantities have to be transformed into hourly quantities using load profiles. For pricing purposes, these load profiles are then combined with expected hourly price profiles, called hourly price forward curves (short: HPFC). These are discussed in detail in Sect. 11.2. Several authors have shown that the competitiveness of retail markets strongly depends on the switching rate of customers. This is also discussed along with further aspects of competition in retail markets in Sect. 9.4.
Exemplary per-unit costs of electricity are depicted in Fig. 10.4 for different types of customers in Germany. These significantly vary due to unequal price components. Large energy consumers are generally connected at high-voltage levels resulting in lower grid fees (as they only have to bear costs of the extra-high-voltage and high-voltage grid). For example in Germany, they are also often exempted from surcharges financing renewable energies (EEG-levy). In contrast, household customers are connected to low-voltage levels and thus have to carry the costs of all grid levelsFootnote 22 and the full levy for renewable support. As depicted in Fig. 10.4, household prices are in the order of 30 €ct/kWh, while prices for energy-intensive industry (with privileged treatmentFootnote 23) are – with less than 6 €ct/kWh – by five times lower in Germany.

Source Own illustration based on data from Bundesnetzagentur (2015)
Average composition of retail prices for electricity in Germany in 2015.
Comparing electricity prices in Europe, huge differences can be observed, with the highest household prices in Denmark and Germany reaching 30 €ct/kWh and the lowest in Lithuania and Bulgaria attaining approximately 12 and 10 €ct/kWh, respectively (cf. Fig. 10.4). The share of taxes and levies in household prices also varies enormously between the different European countries, being highest in Denmark with approximately 67% and lowest in Malta with only 5%. The differences in taxes and levies result from different value-added taxes, electricity taxes and levies for renewable energies. Besides absolute electricity prices, the relative share of electricity costs compared to the average (net) income is an indicator of how much of the income has to be spent on electricity. This share varies from 0.7% in Luxemburg and 1% in the Netherlands up to 2.5% in Latvia and 3% in Bulgaria. Prices for industrial customers are in all countries (except Malta) lower than household prices and range in a magnitude between highest 14 €ct/kWh in Malta and lowest 5.9 €ct/kWh in Finland for medium-sized customers with a consumption between 500 and 2,000 MWh.
10.7.3 Energy Poverty
An issue related to retail markets and retail electricity prices is energy poverty which describes the lack of access to modern energy services. In a global perspective, energy poverty raises serious and growing public health concerns related to indoor air pollution due to the use of polluting and less energy-dense fuels. Also, physical injury during fuelwood collection, and lack of refrigeration and medical care in areas that lack electricity are major issues (cf. Sovacool 2012). Energy poverty is primarily a severe problem in developing countries.
However, energy poverty can also be defined more broadly than the lack of access to modern energy: Bozarovski and Petrova (2015) formulate the following condition for energy poverty: “the inability to attain a socially and materially necessitated level of domestic energy services”. With it, energy poverty not only refers to the situation of large numbers of people in developing countries but is also a major concern across the EU, where about 50 million or approximately 10% of the population say they are struggling to pay their energy bills.Footnote 24 High electricity or energy prices in relation to net income of households may result in energy poverty. In the last years, awareness of energy poverty has been rising in Europe and several EU institutions have identified it as a policy priority. For example, one third of the Bulgarian population is in arrears with their utility bills, according to the EU Energy Poverty Observatory, launched at the beginning of the year 2018. Energy poverty is considered an increasing social problem in the European Union, especially since the economic crisis in 2009 tended to worsen energy poverty in Europe (cf. Oliveras et al. 2021), continued by the corona crisis and the rise in energy prices in the wake of the Russia-Ukraine war.
In countries like Germany and France, the public debate touches related issues often under the somewhat broader term of “affordability” of energy and energy services. In the context of the transformation towards a sustainable energy system, this implies that both cost efficiency and distributional aspects of decarbonisation policies have to be taken into account (cf. Sect. 6.2.3).
10.7.4 Self-supply, Grid Parity and Level of Autonomy
With increasing household electricity prices and decreasing prices for PV systems, distributed electricity production from photovoltaics is cheaper than procuring electricity from the grid. Self-supply by small electricity generators at customers’ locations (e.g. photovoltaics) substitutes electricity purchase in small and decentralised systems. In this context, the term grid parity describes the fact that an alternative energy source (e.g. photovoltaics) can generate power at levelised cost (LCOE) of electricity lower than the price of electricity purchased from a (grid-based) supplier. In this case, the LCOE is compared to the retail price of grid-delivered power, which includes not only generation costs but also further upstream cost components like grid fees, renewable levies, taxes, etc. (see Sect. 10.7.2). Retail prices are (much) higher than wholesale electricity prices and it is unclear which price shall be used as a benchmark for grid parity. As a consequence, different kinds of grid parity can be distinguished, depending on what is taken as a benchmark for retail prices:
-
A first phase of grid parity is achieved when an alternative energy source can generate power at lower LCOE than the price of purchasing power, including taxes and levies on electricity prices. This grid parity was reached for utility-scale solar in 2011 and in 2012 for rooftop solar PV in Germany. In 2014, grid parity for solar PV systems was already reached in most European countries due to further decreasing LCOE of PV.
-
A second phase of grid parity is attained when an alternative energy source can compete with the purchase price for electricity without taxes and levies. Hence, the costs of small and decentralised electricity production from an alternative source have to be lower than costs for production, transmission and distribution. Alternatively, some definitions of this second phase of grid parity take prices of industrial or commercial sectors as a benchmark. As shown in Fig. 10.5, electricity prices for medium-sized industries are roughly in the same order of magnitude as prices for households without taxes and levies in many countries. Due to rapid price decreases for PV modules, solar power generation has already reached this second phase of grid parity in a wide variety of locations or will reach it in the next few years.
Fig. 10.5 
Source Own illustration based on data from Eurostat
Electricity prices in EU28 in 2017 for medium-sized households (left bars) and medium-sized industry (right bars) (Households with annual consumption between 2500 and 5000 kWh and industry with annual consumption between 500 and 2000 MWh).
-
For the third phase of grid parity, different definitions exist. Japan’s New Energy and Industrial Technology Development Organization (NEDO) defines the third phase of grid parity when an alternative energy source can compete with the cost of conventional power generation. This allows competition between conventional and also large-scale alternative resources based on LCOE, but then the availability of the plants and the weather-dependability of the alternative resource is not considered. An alternative definition of this third phase of grid parity reflects more literally the term “grid parity”: this definition refers to a competition between the purchase of electricity from the grid and a demand-driven, self-sufficient provision of electricity from the decentralised alternative system. In the above definitions of (first and second phases of) grid parity, it is always neglected that the generation from the alternative source depends on an external and not influenceable factor, the availability of the renewable source, which is in general dependent on the weather (e.g. solar radiation). A backup system is necessary to obtain electricity from an alternative source that matches the demand, which could be a battery system. Hence, the third phase of grid parity is sometimes also defined so that the decentralised alternative source, including the balancing system (e.g. PV, including sufficient battery capacity), competes with the purchase of electricity from the grid (without taxes and levies). According to this definition, the third phase of grid parity has not yet been reached. Competitiveness of decentralised systems strongly depends on the development of storage cost and future CO2 prices.

The three phases of grid parity serve more as a rough guide when, at what level, and in which country alternative sources for electricity are becoming competitive. As the first phase of grid parity is reached in most (or even all) countries, the share of self-produced electricity is getting more and more a variable being optimised by the customers. This can be achieved by optimising the size of the PV field and the storage capacity at the point of consumption (with regard to the consumption level).
To characterise this kind of decentralised electricity production, there are several indicators: The level of power autonomy describes how much of the electricity consumed locally is taken directly or physically from the installed photovoltaic system. This indicator is sometimes also referred to as the rate of self-sufficiency(cf. e.g. Dietrich and Weber 2018). The level of power autonomy considers the coincidence of production and demand and describes the share of PV electricity that is directly or indirectly consumed within the household: a PV electricity production \({y}_{{\text{PV}},t}\) may be used directly in the household \({y}_{\text{PV},t}^{\rm{dir}\ \rm{use}}\) up to the current household load \({D}_{t}\).Footnote 25 The surplus is yet fed into the grid \({P}_{t}^{\text{grid-in}}\) or used to charge a battery storage \({y}_{\text{ST},t}^{{{\text{ch}}}}\), if available (see also Fig. 10.6):

Schematic illustration of PV electricity production and its usage in a household
Conversely, the instantaneous household demand \({D}_{t}\) may be met by the directly consumed PV production \({y}_{{\text{PV}},t}^{\rm{dir \, use}}\), the discharging of stored electricity \({y}_{{\text{ST}},t}\) and the outtake from the grid \({P}_{t}^{\text{grid-out}}\):
Accordingly, the level of power autonomy \(LPA\) is calculated by:
A 25% level of power autonomy means that one-fourth of the electricity consumed comes from the photovoltaic system. Sometimes, the level of energy autonomy LEA is used as a further, more virtual indicator describing how much electricity consumed is on average provided by the photovoltaic system on a yearly basis. This indicator is based on annual values and neglects that power from the PV system may be available when there is no demand and that the PV surplus is fed into the power grid. The level of energy autonomy is per definition higher than the level of power autonomy and is calculated by:
According to the schematic illustration in Fig. 10.6 and as described in Eq. (10.1), the total PV production \({y}_{{\text{PV}},t}\) used to calculate energy autonomy neglects battery losses and considers the surplus feed into the grid within the balance.
In contrast to the levels of power and energy autonomy, the rate of self-consumption RSC describes the share of self-consumed solar electricity in the total solar electricity produced. Thereby also the curtailed production \({q}_{{\text{PV}},t}^{{{\text{curt}}}}\) is considered in the denominator. The rate of self-consumption is calculated by:
A self-consumption rate of 50% means that half of the self-produced solar electricity is consumed directly on site.
Other things being equal, an increased size of the PV panel decreases the rate of self-consumption, as there are limits to the direct use of the produced electricity (see Eq. 10.2). The level of power autonomy yet increases for larger PV installations, given that the denominator in Eq. (10.3) remains constant. Through intelligent planning concerning the demand profile, the size and orientation of the PV field, and the size of the battery system, the self-consumption rate of and consequently the profitability of a photovoltaic system can be optimised.
A 100% self-consumption rate is technically achievable through sufficient storage capacity as long as the solar production remains substantially below the annual demand. Yet a 100% level of power autonomy is challenging to reach at reasonable cost given today’s prices. A 100% level of self-consumption requires storing the surplus of PV production and consuming this surplus in times of low or no PV production. For a 100% level of power autonomy, shifting production from summer (when PV production is high) to winter (when energy demand is highest) is necessary. This would require a large decentral storage for shifting energy from one season to another which is, due to the size and the low full-load hours of storage utilisation, far beyond being economically attractive. Moreover, this could also be provided by sector coupling and power-to-heat with a seasonal thermal storage system. In contrast to a 100% level of power autonomy, a 100% level of energy autonomy could be easily achieved by dimensioning the solar field in a magnitude that the energy production is larger than the yearly energy consumption, neglecting time-dependencies of production and consumption.
Experiences from typical households with PV systems in central Europe show that self-consumption is in the order of magnitude of 30% without battery systems. However, self-consumption can strongly vary as it depends on the size, orientation and location of the plant and the size of the household. Thereby the level of self-consumption depends on the simultaneity of PV production and energy consumption. This simultaneity can be relaxed by installing a decentralised storage capacity. The economic attractiveness of such a storage system depends on the electricity costs compared to the PV LCOE and the storage costs. Hence, solar field size and battery size can be optimised concerning the own consumption profile. At today’s battery prices and retail electricity prices of about 30 €ct/kWh in Germany as well as PV LCOE in the range of less than 10 €ct/kWh, the self-consumption rate in Germany can be increased up to 70% while still being close to a profitable investment in single-family houses (cf. Dietrich and Weber 2018).
The self-consumption of locally produced electricity may not be restricted to single-family houses but could also be extended to multi-dwelling buildings and larger areas or districts of homes (“Energy communities” in the wording of the EU legislation). Tenant electricity (also called district electricity) is locally produced electricity offered to private or commercial tenants. The model is equally suitable for condominium communities. The tenant electricity is produced in “immediate proximity” to the rental property and does not need to be routed through public networks. So grid charges and concession levies could be avoided making the model economically attractive for consumers. In Germany, security of supply is not affected by the purchase of tenant electricity. If additional power is needed, it can be obtained via the public grid. Conversely, surplus electricity from the tenant electricity system can be fed into the public grid under the terms of the subsidy scheme (renewable energy act). However, the success of such tenant electricity models strongly depends on the regulatory framework conditions in the different countries, especially whether additional taxes, levies and grid fees can be avoided and whether costs for the electricity grid have to be paid per kWh and not per connection point. Also, transaction costs are likely to be considerably higher for multi-stakeholder arrangements than for PV installations owned and operated by one household. Discussion is still ongoing, whether and how such models should be promoted, especially as the state loses revenues from taxes on the other side. And also, levies have to be borne by other customers. Furthermore, there is an ongoing discussion about completely off-grid energy communities, which have backup capacities instead of the public grid to ensure security of supply.
10.8 Markets in Europe Versus North America
Whereas electricity market design also comprises elements like the design of incentive mechanisms for greenhouse gas emission reduction and renewable energies (see Sects. 6.2.3 and 6.2.4), the subsequent considerations focus on the design of the core electricity market segments: short-term electricity markets, long-term electricity markets, markets for reserve energy (as the most important ancillary service) and congestion management. Table 10.2 summarises key design elements of these submarkets of the electricity market that are typical for most European and some North American electricity markets (for more details see, e.g., Baldick 2017; Chaves-Avila 2014; Ehrenmann 2018; Roques 2018, 2019; Ockenfels et al. 2008; Grimm et al. 2008); thereby it is worth mentioning that in both regions also electricity markets with quite different designs exist.
The European electricity markets are typically characterised by a high level of decentralisation with different exchanges, whereas competitive markets in the USA rely on a central and powerful institution – the so-called Independent System Operator (ISO). In European markets, players are free to trade the electricity bilaterally or send their bids to one of the power exchanges (like EPEX SPOT), which execute auctions and facilitate continuous trading. As these auctions represent multi-unit auctions (cf. Sect. 8.3) with uncertain demand, theoretical results obtained for single-unit auctions, like the revenue equivalence theorem (Vickrey 1961) cannot be transferred (cf. Stoft 2002, pp. 100–101). This market design is also called MinISO or exchange model or bilateral market, or auction market model. The bids of the market players are based on their strategies (notably obtained through self-scheduling, cf. Sect. 4.4, i.e. self-unit commitment and self-dispatch) and the market clearing process of the day-ahead market results in one (zonal) market price, e.g. for every hour of the following day for the respective market area. Besides bids for one specific hour of the following day (simple bid), day-ahead markets usually offer the opportunity to put more complex (non-convex) bids on the market. A prominent example of a complex bid is a so-called block bid (cf. Sect. 10.1.1). Such a block bid has to be entirely accepted or fully rejected (Fill-or-Kill criterion). It is not possible to accept the bid only for some of the hours.
The day-ahead markets are complemented by the possibility of trading electricity continuously in intraday markets to consider new information, which was not available day-ahead. Qualified market players can also decide to make bids to provide reserve capacity and reserve energy via different reserve markets (taking into account their opportunity costs), where the TSOs are single buyers (see Sect. 10.3). Clearing these energy and reserve markets typically results in zonal prices for the respective market area, mostly a country. To integrate European electricity markets, the markets for different countries are coupled (Multi-Regional Coupling) by exchanging information between European exchanges and using the available transmission capacities for electricity transport between countries for exports and imports to equalise differences in electricity market prices (see Sect. 7.2). If the available transfer capacity is sufficient, this will lead to precisely the same market price in the two countries. Grid congestions between countries are considered in the market process with the help of flow-based market coupling, whereas internal congestions can hardly be handled by the market coupling. After the market clearing process, the TSOs responsible for network operation must make load flow calculations and apply different measures for congestion management (e.g. redispatch) in the case of congestions (see Sect. 10.6).
In contrast to the European electricity market design, offersFootnote 26 to buy or sell electricity and capacity in North American markets like PJM (Pennsylvania, New Jersey, Maryland Interconnection) have to be given to a central pool. The responsible ISO then clears the whole market centrally. This system design is also called MaxISO or the pool model. As the ISO is also in charge of operating the transmission grid, although not necessarily being the owner of the grid, the ISO as a central institution has all information needed to calculate the optimal solutions for the energy and reserve markets simultaneously, considering electricity grid constraints (so-called co-optimisation; see, e.g., Papavasiliou 2016). Therefore, ISOs can execute security-constrained scheduling calculations day-ahead and security-constrained dispatch calculations nearly in real-time (e.g. for every five minutes) to determine locational marginal prices (LMP) for every node in their system. The results of the security-constrained dispatch calculations show the level of operation for all units in the system at five-minute intervals, which means that reserve capacity is only needed for intra-five-minute variability (Baldick 2017). Financial transmission rights (FTR) may be used under this market design to hedge against different marginal prices in different locations (see Sect. 10.6). To conduct security-constrained unit commitment and dispatch calculations, ISOs need a huge amount of (truthful) information, e.g. about the costs and production constraints of the production, storage and consumption units (multi-part bids) and of the transmission assets. The optimal results of the central calculation can lead to situations, where, e.g., a generation unit is “in the market”, although the nodal prices at the location of this installation are not sufficient to cover the production costs, leading to the necessity of compensation payments, so-called side payments.
The two market designs emphasise different aspects of competitive markets. The European framework has been fostering on the freedom of market players to enter into contracts and to dispose individually of their assets, limiting the role of the monopolistic grid operators. In the USA, the emphasis has rather been on getting the incentives for the market players right, especially since nodal pricing internalises grid constraints and thus does not incentivise power producers (and consumers) to externalise costs on the grid (see also Wilson 2002).
In view of the transition towards a sustainable electricity system, both aspects are highly important. Yet for Europe, the major issue is whether the intertwined European and national legislators are willing to engage into the major institutional overhaul necessary to establish locational marginal pricing. According to the European treaties, the European Commission has an important role to play to enable trade and competitive markets across Europe. Yet its mandate is limited when it comes to imposing new international institutions.
10.9 Further Reading
-
Meeus, L. (2020). The Evolution of Electricity Markets in Europe. Cheltenham: Edward Elgar.
-
This book describes how Europe has experienced the evolution of modern electricity markets since liberalisation in the mid-90s. The author explains the sequence of electricity markets in Europe from wholesale to balancing markets. He also discusses forward transmission markets, capacity mechanisms, redispatching and flexibility markets.
-
EC. European electricity market reports. https://data.europa.eu/euodp/en/data/dataset/european-electricity-market-reports.
-
The European Commission publishes quarterly reports on European gas and electricity markets and energy prices in Europe. These quarterly reports give a good overview of recent developments of the energy markets and analyse main developments on the markets and interactions between countries.
10.10 Self-check of Knowledge and Exercises
Self-check of Knowledge
-
1.
Explain how a unique market price within one hour is determined.
-
2.
Name at least three day-ahead markets for electricity (electricity exchanges) in Europe.
-
3.
What are block bids?
-
4.
Explain the main difference between day-ahead and intraday markets, primarily focusing on the aspect of continuous trading.
-
5.
How is cross-border trading organised? Explain the difference between explicit and implicit trading of cross-border capacities.
-
6.
Name and explain at least two system services.
-
7.
Name and explain at least three different types of capacity mechanisms. What is the purpose of capacity mechanisms?
-
8.
What is redispatch?
-
9.
Explain the difference between ex-ante and ex-post congestion management.
-
10.
Explain how market prices in two regions are determined with the help of the standard supply and demand model in two cases: with and without congestion.
-
11.
What are retail electricity markets and which general price components can be distinguished on these markets?
-
12.
Explain the average composition of retail prices at the example of Germany for different customers.
-
13.
What is the difference between energy and power autonomy? What autonomy is easier to be achieved?
Exercise 10.1: Power Markets
-
1.
In the context of electricity markets, characterise futures markets according to the purpose the markets serve and classify them according to the time between the commercial transaction and the physical delivery of the service.
-
2.
Name elements of electricity market design and their specifications in typical European and North American electricity markets.
-
3.
Can generators cover their fixed costs if the market price always equals the (physical) marginal costs of the price-setting technology? Distinguish in your answer base, medium and peak-load technologies.
-
4.
Discuss the role of capacity markets in this context. How do capacity markets impact the market price?
Exercise 10.2: Market Clearing and Redispatch
In a European country (one market area), the following generation capacities are available:
-
3 CCGT with a capacity of 300 MWel each, located in the northern part of the country,
-
3 OCGT with a capacity of 100 MWel each, located in the southern part of the country,
-
2 coal power plants with a capacity of 800 MWel each, located in the northern part of the country,
-
1 coal power plant with a capacity of 800 MWel, located in the southern part of the country and
-
wind power plants with a capacity of 400 MWel, located in the northern part of the country.
For the techno-economic characterisation of the technologies, please refer to Chap. 4. The fuel costs for coal are assumed to be 12 €/MWhth, the fuel costs for natural gas 45 €/MWhth and the CO2 price is 30 €/t.
-
(a)
Calculate the clearing price of the day-ahead market assuming perfect competition for an hour with wind feed-in of 200 MW. The demand in this hour is estimated to be 2900 MW, equally distributed between the different parts of the country.
-
(b)
Considering the results of (a), the TSO identifies a congestion between the northern and the southern part of the country in his day-ahead congestion forecast. So, the TSO decides to demand a redispatch in the amount of 300 MWel to avoid this congestion. Which additional costs will arise?
Exercise 10.3: Self-supply and Level of Energy Autonomy of a PV System
A PV system with a peak capacity of Pp = 4 kW will be installed on a building with an annual electricity demand of 4000 kWh. The PV modules can be oriented to the south or split to an east and west orientation.
The following data are given:
Assumptions | 2010 | 2017 |
|---|---|---|
Capacity [kW] | 4 | 4 |
Full-load hours South [h/a] | 976.25 | 976.25 |
Full-load hours East–West [h/a] | 828.75 | 828.75 |
Grid feed-ina South [kWh/a] | * | 2600 |
Grid feed-in East–West [kWh/a] | * | 1500 |
Specific investment PV [€/kW] | 3500 | 1500 |
Interest rate [%] | 3 | 0.1 |
Subsidy tariff [€/kWh] | 0.41126 | 0.12 |
Electricity price [€/kWh] | 0.23 | 0.3 |
Load [kWh] | 4000 | 4000 |
Lifetime [a] | 20 | 20 |
-
(a)
Determine the share of self-consumption and the level of energy autonomy for the systems in 2017. What is the influence of the orientation on the level of self-consumption?
-
(b)
Calculate the electricity price at which an east–west orientation is preferable compared to a south exposure in 2017?
-
(c)
The south-oriented PV system shall be expanded to include a battery storage system with a storage capacity of 4 kWh. The electricity consumption from the grid decreases to 1.361.78 kWh/a. Calculate the share of self-consumption and the level of energy autonomy.
Notes
- 1.
Block bids and multi-part bids are summarized under the term complex bids. For multi-part bids see Sect. 10.8.
- 2.
This may even lead to paradoxically rejected block bids (for details see, e.g., Madani and Van Vyve 2014).
- 3.
Each country engaging in trade will increase its overall economic surplus. In the simple models of Sects. 7.2 and 7.3, this corresponds to a decrease in cost – when costs are adjusted for the value of imports and exports. Yet not necessarily all market participants within the countries will benefit from cross-border trading. Typically, producers in high-price markets lose profits whereas consumers benefit from lower prices. The opposite is true in low price areas.
- 4.
EMIR: European Market Infrastructure Regulation. MiFID II: Markets in Financial Instruments Directive. REMIT: Regulation on Wholesale Energy Market Integrity and Transparency. While the first two are applicable to a broad range of financial derivatives, the last one specifically applies to the energy sector and imposes increased reporting requirements on energy traders.
- 5.
- 6.
Cf. Sect. 5.1.4.2 for this and the other reserve categories.
- 7.
If overall supply adequacy is satisfied; see Sect. 10.5.
- 8.
A profound overview of market mechanisms and remuneration concepts for voltage control is given in Hinz (2017, Chap. 3).
- 9.
In this context, first the question has to be answered, how an adequate level of supply adequacy is to be defined (quantitatively).
- 10.
This might especially be the case for traditional energy companies that are often characterized to be extremely risk-averse. On the role of risk aversion for generation investment see e.g. Neuhoff and De Vries (2004).
- 11.
Depending on the slope of the supply and demand functions for capacity, the effects of an error in setting the price or the quantity lead to a bigger deviation from the equilibrium (see e.g. Oren 2000).
- 12.
This means that even in the case of a failure of one system element, a stable system operation is feasible.
- 13.
A (very) long-term measure not considered in this chapter would be to build new transmission capacities.
- 14.
Ex-ante in this context means before clearing of the (day-ahead) market.
- 15.
Netting means that electricity flows over the same line in opposite directions offset each another.
- 16.
The interested reader is referred to a more detailed description of the market coupling optimisation problem, which can, e.g., be found in Ringler (2016, p. 109).
- 17.
In some markets, nodal prices are only used for the generation side, whereas on the consumption side the nodal prices are aggregated e.g. to zonal prices. Aggregating nodal prices, e.g. across a region, is often used to limit consumer price risk exposure (cf. Neuhoff and Boyd 2011, pp. 7–8).
- 18.
In these auctions, it has to be guaranteed that only feasible FTRs are issued by running the so-called Simultaneous Feasibility Test (SFT) (for more information see e.g. Hedman et al. (2011)).
- 19.
Ex-post in this context means after clearing of the (day-ahead) market. Sometimes this form of congestion management is also called curative congestion management, which might lead to confusion as curative actions can also be seen as post-fault actions (see, e.g., Hoffrichter et al. 2019).
- 20.
In some European countries, contracts are offered for different power levels. In consequence, the base rate is higher for higher power peaks. In Germany, DIN 18015-1 “Planning of electrical systems in residential buildings” (DIN 2020) regulates the specifications of electrical house connections. The standard assumes a power requirement of 14.5 kW for a (standard) residential unit.
- 21.
- 22.
Of course, this statement depends on the regulation of power grids. In most European countries, costs are passed-on from higher voltage levels to lower voltage grids resulting in higher costs for consumers at low-voltage levels (cf. Sect. 6.1.4). This can be justified by the fact that the customers at the lower levels additionally make use of the (electricity transport) services at the higher levels.
- 23.
Depending on their electricity consumption, energy-intensive industries can apply for exemptions from non-energy related cost components of the electricity price such as the renewable levy.
- 24.
Cf. EU Energy Poverty Observatory: https://www.energypoverty.eu/.
- 25.
- 26.
In some day-ahead markets also virtual bids are allowed. This means that the virtual day-ahead bid to sell or buy electricity has to be offset by a corresponding bid to buy or sell the electricity back on the real-time market.
References
ACER. (2013). Capacity remuneration mechanisms and the internal market for electricity. European Union Agency for the Cooperation of Energy Regulators (ACER).
Androcec, I., & Wangensteen, I. (2006). Different methods for congestion management and risk management. In 9th International Conference on Probabilistic Methods Applied to Power Systems. Available at: https://www.researchgate.net/publication/224704006_Different_Methods_for_Congestion_Management_and_Risk_Management [Accessed August 19, 2022].
Baldick, R. (2017). Seams, ancillary services and congestion management: US versus EU electricity markets. Available at: https://medium.com/florence-school-of-regulation/seams-ancillary-services-and-congestion-management-us-versus-eu-electricity-markets-ab9ad53a16df [Accessed December 21, 2018].
Bhagwat, P., Marcheselli, A., Richstein, J., Chappin, E., & De Vries, L. (2017). An analysis of a forward capacity market with long-term contracts. Energy Policy, 111, 255–267.
Bozarovski, S., & Petrova, S. (2015). A global perspective on domestic energy deprivation: Overcoming the energy poverty–fuel poverty binary. Energy Research & Social Science, 10, 31–40.
Bublitz, A., Fraunholz, C., Zimmermann, F., & Keles, D. (2016). Overview on market design options for European electricity markets. Reflex report. Available at: http://reflex-project.eu/wp-content/uploads/2017/11/D5.1_Overview_on_market_design_options_update.pdf [Accessed May 26, 2022].
Bublitz, A., et al. (2019). A survey on electricity market design: Insights from theory and real-world implementations of capacity remuneration mechanisms. Energy Economics, 80, 1059–1107.
Bundesnetzagentur. (2015). Monitoringbericht 2015. Report, Bonn. Available at: http://www.bundesnetzagentur.de/SharedDocs/Downloads/DE/Allgemeines/Bundesnetzagentur/Publikationen/Berichte/2015/Monitoringbericht_2015_BA.pdf [Accessed May 26, 2022].
Bundestag. (2022). Gesetz über die Elektrizitäts- und Gasversorgung (Energiewirtschaftsgesetz vom 7. Juli 2005) zuletzt geändert durch Art. 2 Gesetz v. 23.5.2022. Deutsche Bundesgesetze und -verordnungen.
Burke, B., Merrill, H., Schweppe, F., Lovell, B., McCoy M., & Monohon, S. (1988). Trade off methods in system planning. IEEE Transactions on Power Systems, 3(3), 1284–1290. https://doi.org/10.1109/59.14593
Chaves-Avila, J. P. (2014). European short-term electricity market designs under high penetration of wind power. Dissertation: TU Delft. Available at: https://doi.org/10.4233/uuid:cbc2c7bd-d65e-4f4c-9f88-2ab55c11def8 [Accessed May 26, 2022].
Cramton, P., & Ockenfels, A. (2012). Economics and design of capacity markets for the power sector. Zeitschrift für Energiewirtschaft, 36, 113–134.
Cramton, P. C., & Stoft, S. (2006). The convergence of market designs for adequate generating capacity with special attention to the CAISO’s resource adequacy problem. A White Paper for the Electricity Oversight Board. Available at: https://hepg.hks.harvard.edu/files/hepg/files/cramton_stoft_0406.pdf?m=1523368470 [Accessed May 26, 2022].
de Vries, L. (2004). Policy framework for the stabilization of investment in generating capacity. In Proceedings of the 19th World Energy Congress, London, UK.
de Vries, L. J., & Hakvoort, R. A. (2004). The question of generation adequacy in liberalised electricity markets. Available at SSRN: https://ssrn.com/abstract=600503 [Accessed May 26, 2022].
Dietrich, A., & Weber, C. (2018). What drives profitability of grid-connected residential PV storage systems? A closer look with focus on Germany. Energy Economics, 74, 399–416.
DIN. (2020). DIN 18015-1: 2020-05. Electrical installations in residential buildings—Part 1: Planning principles Beuth.
Duthaler, C., Emery, M., Andersson, G., & Kurzidem, M. (2008). Analysis of the use of PTDF in the UCTE transmission grid. In Power System Computation Conference, Glasgow. Available at: https://core.ac.uk/download/pdf/147964029.pdf [Accessed August 19, 2022].
EC. (n.d.). European electricity market reports. Available at https://data.europa.eu/euodp/en/data/dataset/european-electricity-market-reports [Accessed: June 13, 2022].
EC. (2016). Commission staff working document accompanying the Report from the Commission: Final Report of the Sector Inquiry on Capacity Mechanisms SWD/2016/0385 final. Available at https://eur-lex.europa.eu/legal-content/DA/TXT/?uri=CELEX:52016SC0385 [Accessed August 19, 2022].
EC. (2017a). Commission Regulation (EU) 2017/1485 establishing a guideline on electricity transmission system operation. European Commission. Available at: https://eur-lex.europa.eu/legal-content/EN/TXT/PDF/?uri=CELEX:32017R1485 [Accessed May 26, 2022].
EC. (2017b). Commission Regulation (EU) 2017/2195 establishing a guideline on electricity balancing. Available at: https://eur-lex.europa.eu/legal-content/EN/TXT/?uri=uriserv:OJ.L_.2017.312.01.0006.01.ENG&toc=OJ:L:2017:312:TOC [Accessed January 11, 2021].
ECA. (2015). European electricity forwards and hedging products—State of play and elements for monitoring. Final Report to Acer. Economic Consulting Associates Limited. Available at: https://www.acer.europa.eu/en/Electricity/Market%20monitoring/Documents_Public/ECA%20Report%20on%20European%20Electricity%20Forward%20Markets.pdf [Accessed May 26, 2022].
Ehrenmann, A. (2018). Response Electricity market design and the green agenda. In Transforming Energy Markets 41st IAEE International Conference, Groningen.
Grande, O., Doormann, G., & Wangensteen, I. (2001). Peaking capacity in restructured power systems: experience and solutions. In 2001 IEEE Porto Power Tech Proceedings (Cat. No. 01EX502).
Grimm, V., Ockenfels, A., & Zoettl, G. (2008). Strommarktdesign: Zur Ausgestaltung der Auktionsregeln an der EEX. Zeitschrift für Energiewirtschaft, 32, 147–161. https://doi.org/10.1007/s12398-008-0020-7
Hedman, K. W., Oren, S. S., & O’Neill, R. P. (2011). Optimal transmission switching: Economic efficiency and market implications. Journal of Regulatory Economics, 40, 111–140. https://doi.org/10.1007/s11149-011-9158-z
Hinz, F. (2017). Voltage stability and reactive power provision in a decentralizing energy system (Vol. 12). Series of the Chair of Energy Economics and Dissertation: Technische Universität Dresden. Available at: https://nbn-resolving.org/urn:nbn:de:bsz:14-qucosa-229585 [Accessed May 26, 2022].
Hirth, L., Schlecht, I., Maurer, C., & Tersteegen, B. (2019). Kosten- oder Marktbasiert? Zukünftige Redispatch-Beschaffung in Deutschland. Neon & Consentec (im Auftrag des BMWi). Available at: https://www.bmwk.de/Redaktion/DE/Publikationen/Studien/zukuenftige-redispatch-beschaffung-in-deutschland.html [Accessed May 26, 2022].
Hoffrichter, A., Kollenda, K., Schneider, M., & Puffer, R. (2019). Simulation of curative congestion management in large-scale transmission grids. In Bucharest: 2019 54th International Universities Power Engineering Conference (UPEC). Available at: https://doi.org/10.1109/UPEC.2019.8893627 [Accessed May 26, 2022].
Hogan, W. (2005). On an ‘Energy only’ electricity market design for resource adequacy. Center for Business and Government, John F. Kennedy School of Government, Harvard University, Cambridge (MA). Available at: https://scholar.harvard.edu/whogan/files/hogan_energy_only_092305.pdf [Accessed May 26, 2022].
Höschle, H. (2018). Capacity mechanisms in future electricity markets. Dissertation: KU Leuven. Available at: https://limo.libis.be/primo-explore/fulldisplay?docid=LIRIAS1731489&context=L&vid=Lirias&search_scope=Lirias&tab=default_tab&fromSitemap=1 [Accessed August 18, 2022].
Joskow, P., & Tirole, J. (2007). Reliability and competitive electricity markets. The RAND Journal of Economics, 38, 60–84.
Joskow, P. L. (2008). Lessons learned from the electricity market liberalization. The Energy Journal, 29, 9–42.
Just, S. (2011). Appropriate contract durations in the German markets for on-line reserve capacity. Journal of Regulatory Economics, 39, 194–220.
Kunz, F. (2013). Improving congestion management: How to facilitate the integration of renewable generation in Germany. The Energy Journal, 34, 55–78.
Kunz, F., Neuhoff, K., & Rosellón, J. (2016). FTR allocations to ease transition to nodal pricing: An application to the German power system. Energy Economics, 60, 176–185.
Madani, & Van Vyve. (2014). Minimizing opportunity costs of paradoxically rejected block orders in European day-ahead electricity markets. In 11th International Conference on the European Energy Market (EEM14). Available at: https://doi.org/10.1109/EEM.2014.6861237 [Accessed May 26, 2022].
Meeus, L. (2020). The evolution of electricity markets in Europe. Edward Elgar.
MIGRATE. (2018). Massive integration of power electronic devices. Project funded under the EU Horizon 2020 scheme. Available at: https://www.h2020-migrate.eu/_Resources/Persistent/b955edde3162c8c5bf6696a9a936ad06e3b485db/19109_MIGRATE-Broschuere_DIN-A4_Doppelseiten_V8_online.pdf [Accessed May 26, 2022].
Moser, A. (2015). Systemstudie zum Einspeisemanagement erneuerbarer Energien. Wissenschaftliche Studie im Auftrag der EWE Aktiengesellschaft, RWTH Aachen.
Neuhoff, K., & Boyd, R. (2011). International experiences of nodal pricing implementation. Climate Policy Initiative. Available at: https://www.climatepolicyinitiative.org/wp-content/uploads/2011/12/Nodal-Pricing-Implementation-QA-Paper.pdf [Accessed May 26, 2022].
Neuhoff, K., & de Vries, L. (2004). Insufficient incentives for investment in electricity generation. Cambridge Working Papers in Economics CWPE 0428. Available at: https://core.ac.uk/download/pdf/142112.pdf [Accessed May 26, 2022].
Newbery, D. (2002). Regulatory challenges to European electricity liberalisation. Swedish Economic Policy Review, 9, 9–43.
Nüßler, A. (2012). Congestion and redispatch in Germany. A model-based analysis of the development of redispatch. Dissertation: University of Cologne.
Oliveras, L., Peralta, A., Palència, L., Gotsens, M., López, M., Artazcoz, L., Borrell, C., & Marí-Dell’Olmo, M. (2021). Energy poverty and health: Trends in the European Union before and during the economic crisis, 2007–2016. Health & Place, 67, 102294.
Oren, S. (2000). Capacity payments and supply adequacy in competitive electricity markets. In VII Symposium of Specialists in Electric Operational and Expansion Planning, Curitiba. Available at: https://oren.ieor.berkeley.edu/workingp/sepope.pdf [Accessed May 27, 2022].
Oren, S. (2003). Ensuring generation adequacy in competitive electricity markets. Energy Policy and Economics, University of California Energy Institute, UC Berkeley. Available at: https://escholarship.org/uc/item/8tq6z6t0 [Accessed June 18, 2022].
Papavasiliou, A. (2016). Co-optimization of energy and reserves. In FPM Meeting, Paris. Available at: https://www.diw.de/documents/dokumentenarchiv/17/diw_01.c.545499.de/fpm-paris-2016-10-04-papavasiliou.pdf [Accessed May 27, 2022].
Pérez-Arriaga, I. J. (1999). Reliability and generation adequacy. IEEE Power Engineering Review, 19, 4–5.
Ringler, P. (2016). Erzeugungssicherheit und Wohlfahrt in gekoppelten Elektrizitätsmärkten. Dissertation: Karlsruhe Institute of Technology (KIT). Available at: https://publikationen.bibliothek.kit.edu/1000064573/4015819 [Accessed May 26, 2022].
Roques, F. (2018). Market design for electricity—Comparing the US and EU. Available at: https://www.youtube.com/watch?v=uD8j1Mmc3Ws [Accessed September 16, 2021].
Roques, F. (2019). Wholesale power market design—Key issues and principles for an efficient decarbonisation. In IX Electricity Security Advisory Panel Workshop, Paris. Available at: https://iea.blob.core.windows.net/assets/imports/events/240/S3_4_Roques.pdf [Accessed May 27, 2022].
Schermeyer, H., Vergara, C., & Fichtner, W. (2018). Renewable energy curtailment: A case study on today’s and tomorrow’s congestion management. Energy Policy, 112, 427–436.
Schreiber, S., Zöphel, C., & Möst, D. (2021). Optimal energy portfolios in the electricity sector: Trade-offs and interplay between different flexibility options. In D. Möst, et al. (Eds.), The future European energy system—Renewable energy, flexibility options and technological progress, pp. 177–198. Springer.
Sovacool, B. (2012). The political economy of energy poverty: A review of key challenges. Energy for Sustainable Development, 16, 272–282.
Stoft, S. (2002). Power system economics—Desigining markets for electricity. Wiley.
Swider, D. J., & Weber, C. (2007). Bidding under price uncertainty in multi-unit pay-as-bid procurement auctions for power systems reserve. European Journal of Operational Research, 181, 1297–1308.
Vickrey, W. (1961). Counterspeculation, auctions, and ompetitive sealed tenders. The Journal of Finance, 16, 8–37.
Wilson, R. (2002). Architecture of power markets. Econometrica, 70, 1299–1340.
Author information
Authors and Affiliations
Corresponding author
Rights and permissions
Copyright information
© 2022 The Author(s), under exclusive license to Springer Nature Switzerland AG
About this chapter

Cite this chapter
Weber, C., Möst, D., Fichtner, W. (2022). Electricity Markets in Europe. In: Economics of Power Systems. Springer Texts in Business and Economics. Springer, Cham. https://doi.org/10.1007/978-3-030-97770-2_10
Download citation
DOI: https://doi.org/10.1007/978-3-030-97770-2_10
Published:
Publisher Name: Springer, Cham
Print ISBN: 978-3-030-97769-6
Online ISBN: 978-3-030-97770-2
eBook Packages: Economics and FinanceEconomics and Finance (R0)