
Abstract
Thermal spray coating starts with proper surface preparation, which is an essential and critical operation on which the quality of the coating and its adhesion to the substrate strongly depend. The coating material and the nature of the substrate are the major factors in determining what kind of surface preparation is necessary to achieve optimal bonding. Substrate surface preparations comprise essentially of; machining of the part to its final dimensions, cleaning the surface, masking to prevent deposit formation on areas that are not to be coated, surface roughening followed by final cleaning. It is also important to keep in mind that the coating must never end abruptly at the part extremity and that surface preparation should be done as close as possible to the timing of the spraying operation to avoid the deterioration of the quality of the prepared surface. In this chapter, following a brief review of the surface preparation, attention is given to different technologies currently used for the cleaning and surface roughening steps, including grit blasting, high pressure water roughening, and laser treatment.
Access provided by Autonomous University of Puebla. Download chapter PDF
Keywords
- Substrate design
- Masking
- Surface roughening
- Cleaning
- Solvent degreasing
- Baking
- Ultrasound cleaning
- Wet and dry blasting
- Brushing
- Dry ice blasting
- Grit blasting
- High pressure water roughening
- Laser surface treatment
1 Introduction
As mentioned in Chap. 1, Introduction to Thermal Spray, of this book, the increasing demands for combined functional requirements of materials while keeping the final cost of the part at an acceptable level led to the ever-increasing demand which allows the decoupling of the surface properties of a part from its bulk and structural properties. Numerous thermal spray technologies have been reviewed in this context in Chaps. 6, 7, 8, 9, 10, 11 and 12, covering Cold Spray (CS), Flame Spraying (FS), DC and RF Induction Plasma Spraying (DC-APS) (RF-IPS), Wire Arc Spraying (WAS), and Plasma Transferred Arc (PTA) deposition. One common aspect of all of these technologies is that they require proper surface preparation in order to ensure the adhesion of the coating to the substrate and achieving the functional modification of the surface properties in a reliable and economical fashion.
Surface preparation for thermal spraying is a relatively simple and intuitive task that starts at the design stage of the part in order to avoid sharp edges and corners, which can be the starting point of crack initiation in a coating. The following five principal steps of surface preparation include, machining, cleaning, masking, roughening, and finishing. This chapter is devoted to a brief description of each of these steps with emphasis on thermal spray process requirement and coating performance needs.
2 Basic Concepts
Thermal spraying begins with proper surface preparation, which is absolutely essential. Steps must be undertaken correctly in order for the coating to perform the design expectation [Davis J.R. ed. (2004)]. Without surface preparation, failure of the coating becomes highly probable because coating adhesion quality is directly related to the cleanliness, the roughness, and sometimes the proper machining for optimal coating performance. The coating material and the nature of the substrate are the major factors in determining what kind of surface preparation is necessary to achieve a resistant bonding.
2.1 Substrate Design
Good surface preparations start at the design stage. A number of important rules have to be respected in the design of the part to be coated in order to avoid creating weakness points in the coating where cracks would initiate once the coated part is exposed to mechanical or thermal stresses. The principal guidelines recommended by the Thermal Spraying, American Welding Soc. (1985) [Davis J.R. ed. (2004)], illustrated in Fig. 14.1, can be summarized as follows. The LHS of the figure representing what NOT to do while the RHS representing what is recommended. While these recommendations are illustrated for flat surfaces, they apply equally well to cylindrical or other surfaces:
-
A coating must never end abruptly at the part extremity. A sharp edge, as illustrated on the LHS of Fig. 14.1a, may act as a stress raiser where cracks will develop, especially when loads are applied. Coating at the extremity of a part should accordingly present a narrow-feathered band, rather than a sharp edge.
-
When undercutting a substrate area to accept the coating, the coating deposited must never end abruptly. In the undercuts the corners must be chamfered, or its cutting edge removed before spraying. The chamfer angle should be about 30° as illustrated in Fig. 14.1b. Sharp corners capture loose spray particles, dusts, and debris, resulting in porous areas.
-
For a part with a sharp corner at 90°, the corner must be chamfered at 45°, as illustrated in Fig. 14.1c, or rounded with radius of >0.75 mm. Otherwise, with an abrupt edge, cracks will develop.
-
For a part with a sharp shoulder at 90o the shoulder must be chamfered at 45°, as illustrated in Fig. 14.2d, or rounded with radius of >0.75 mm to avoid the development of cracks.

Recommended machining for areas to be sprayed: (a) best design with a narrow-feathered band at the coating extremities, (b) undercut shape chamfered at about 30°, (c) corners must be chamfered at 45° or rounded with radius > 0.75 mm, (d) shoulders at 90° must be chamfered at 45° or rounded with radius of >0.75 mm. Reprinted with kind permission from ASM International [Davis J.R. ed. (2004) and Thermal Spraying, American Welding Soc. (1985)]

(a) Grooved substrate and (b) smooth substrate. Reprinted with kind permission from American Welding Society [Davis J.R. ed. (2004)]
For the spraying of thick coatings or coatings on a substrate with rounded profile with a short radius of curvature, it is recommended to machine grooves or threads into the surface to be sprayed. As illustrated in Fig. 14.2a, such groves will reduce shear stresses parallel to the surface by restricting shrinkage stresses, and disrupting lamellar patters of splat deposition on the surface of the substrate. [Thermal Spraying American Welding Soc. (1985)]. The surface is generally roughened after grooving. Two types of grooves are used: V-shaped ones, when the V angle relatively to the part surface is 70° with the root rounded, or U-shaped grooves, between 1.1 and 1.4 mm in width.
2.2 Masking
Masking is necessary to prevent the deposition of the coating on areas where it is not wanted. It also improves the uniformity of the deposit when coating limited areas. A wide range of coating materials are used, including self-adhesive tapes or hard masks. In either case, the material use should be resistant to the conditions to which it is exposed in the roughening and thermal spray coating stages of the operation. Its attachment to the substrate should be reliable and strong, while being readily removal at the end of the coating step. Two types of masks are commonly used:
-
Contact masks, using self-adhesive tapes, as illustrated in Fig. 14.3a, are applied to the substrate on the areas that are to be protected. The tape is withdrawn after grit blasting and thermal spraying operation. Any residual glue in the areas that were covered must be cleaned by an appropriate solvent. As shown in Fig. 14.3b, the edge of the coating in this case is sharp and can induce, in that area, debonding due to stresses when loads are applied. Contact masking is mostly used when the number of parts to be coated is small.
-
Shadow masks, consisting of placing a metal shield machined to the dimensions and profile of the areas to coated and firmly fixing it to the substrate, as shown in Fig. 14.3c, for both grid blasting and thermal spraying operations. Because of the small spacing between the shield and the substrate, a narrow-feathered band at the edges of the coating is formed as recommended for non-protected parts, Fig. 14.3d. Masks are generally recommended for the coating of a large number of parts. While they are reusable, they still need to be renewed on a regular basis due to normal wear and tear depending in its utilization conditions.
Fig. 14.3 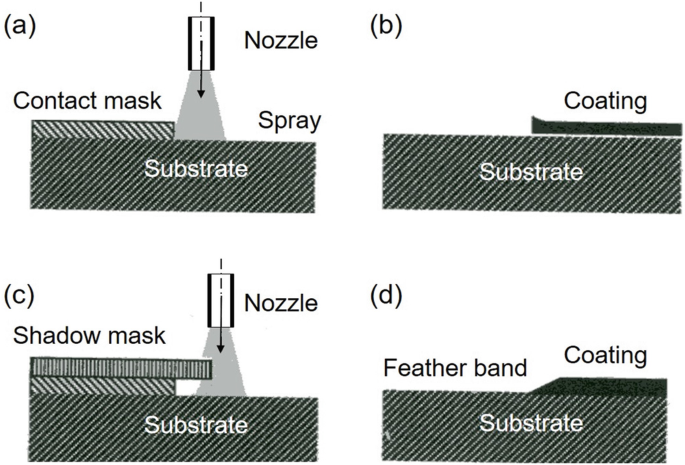
Effect of masking technique on coating profile: (a) contact masking, (b) coating profile obtained with contact masking , (c) shadow masking, (d) coating profile obtained with shadow masking [Davis J.R. ed. (2004)]. Reprinted with kind permission from ASM International

2.3 Surface Roughening
2.3.1 Definitions
Surface profile characterization is rather complex because of the different type of defects that can be simultaneously present in a surface. As illustrated in Fig. 14.4, these can generally be classifieds in the following three broad groups based on their linear dimension “wave-length,” with Fig. 14.4a representing the combination of all of the three in a single part.
-
Shape defects are observed at rather large scales of few centimeters, Fig. 14.4b.
-
Undulation is generally present at the millimeters scale level, Fig. 14.4c.
-
Roughness is observed at yet a smaller scale, Fig. 14.4d.
Roughness is typically considered to be the high frequency, short wavelength component of a measured surface characteristic that is the most pertinent to thermal spraying. This is due to the fact that the roughness scale is comparable with the size distribution of the sprayed powder/molten droplets impinging on the surface of the substrate. As will be discussed in Chap. 15, Coating Formation, the compatibility between the size of the spray droplets and surface roughness can have an important impact on the level of mechanical adhesion of the coating to the surface of the substrate.

Schematic representation of different types of surface defects as measured using contact-skidded instruments. (a) Combination of all three types of surface defects; (b) shape-type defects; (c) undulation-type defects and (d) roughness—type defects
2.3.2 Measurement Techniques
Surface roughness is a critical parameter on which the quality of the bonding between the coating and the substrate strongly depends. It can be measured using “contact-type” instrument [Dong S. et al. (2011), Montavon G. (2004)] in which a styles scans over the surface to detect the surface profile characteristics along a given trace. Alternately, a “non-contact approach” can be used based on optical, ultrasonic, and capacitance methods [Vorburger T.V. and E.C. Teague (1981), Tonshoff H.K. et al. (1988), Shin Y. C. et al. (1995), Bradley C. (2000)].
With a “contact-type” instrument, the profilometer diamond stylus scans repeatedly over the surface to be evaluated in different random orientations, measuring in each scan the surface profile characteristics. The collected data is then analysis, and statistically averaged over at least over 12–18 scans in order to have a reasonable assessment of the properties of the surface. A typical trace of a single traverse of length lt is given in Fig. 14.5. A cut-off length is defined in order to discriminate the possible undulation from the roughness. If the cut-off length is below 1 mm the undulation is reduced. The assessment length ln must be at least 5–6 times the cut-off length in order to define a length comprising undulation and roughness. The previous and post-running segments of the scan are discarded from the acquisition [Dong S. et al. (2011), Montavon G. (2004)]. The main limitation of the technique is the size of the stylus compared to that of undercuts. The stylus may be either too blunt to reach the bottom of deep valleys or too sharp and scratch the surface of the substrate or round the tips of sharp peaks. In such cases the probe acts as a physical filter that limits the accuracy of the instrument.

Definitions of different length for roughness measurement: With a contact skidded instrument, such as the profilometer diamond stylus, the instrument probes the surface over a traverse length lt [Reprinted with kind permission from Prof. G. Montavon]
Non-contact instruments, on the other hand, employing optical, ultrasonic, and capacitance [Vorburger T.V. and E.C. Teague (1981), Tonshoff H.K. et al. (1988), Shin Y. C. et al. (1995), Bradley C. (2000)], offer a better precision at the risk to have the surface profile modified through the sample preparation protocol. There are also limitations to non-contact instruments that rely on optical interference that cannot resolve surface features that are smaller than some fraction of their operating wavelength. This is especially true when measuring very smooth surfaces [Bradley C. (2000), and Cedelle J. et al. (2006)] for which there is a growing interest in conjunction with the plasma spraying of nanopowders using suspension or solution spraying. The splat sizes in these cases are in the range 0.1–1.0 μm that is in the same size range as that of the roughness levels of smooth surfaces.
An interesting comparison between the different techniques used for the measurement of surface roughness at the micrometer scale level is presented in the paper by [Conroy M. et al. (2005) and Hu Z. et al. (2008)]. [Al-Kindi GA and Shirinzadeh B (2007)] point out that accurate surface characterization would require three-dimensional (3-D) surface measurements for a better understanding of the surface properties. Such measurements are, however, rather complex and demanding in terms of data processing compared to traditional two-dimensional (2-D) surface measurements. In the following, the discussion of surface characterization parameters will be limited to 2-D measurements based on the amplitude and spacing criteria [Tomovich SJ and Peng Z (2005)]. The most frequently used parameters are:
-
The arithmetical average, AA;
-
$$ AA=\frac{h_1+{h}_2+\dots {h}_N}{N} $$(14.1)
where hi with i = 1 to N, the height of all peaks and undercuts (without regard to the sign) from the centerline and, N the number of measurements.
As illustrated in Fig. 14.6, the following parameters are commonly used for the characterization of the value of the surface roughness over a scan of length, l.

Definitions of the average roughness Ra, root mean square roughness Rz, distance between highest peak and deepest undercut, Rt [Montavon G. (2004)]
-
The average roughness , Ra;
-
$$ {R}_a=\frac{1}{l\ }{\int}_0^lz(x). dx $$(14.2)
-
The root-mean square roughness , Rz
-
$$ {R}_z=\sqrt{\frac{1}{l}{\int}_0^lz{(x)}^2 dx} $$(14.3)
The Rt is the distance between the highest peak and the deepest undercut and which describes local singularities (Fig. 14.6). This value is very important for the mechanical adhesion of splats.
The standard deviation of the profile angle, RΔq, represents the root mean-square roughness, is obtained from the local profile slope (dz(x)/dx) of the roughness profile as shown in Fig.14.7 given by Eq. 14.4.

Definition of the slopes used to define RΔq [Bahbou F. and P. Nylen (2005)]
-
The skewness parameter , Sk;
-
$$ {S}_k=\frac{1}{\sigma^3}\ {\int}_{-\infty}^{+\infty }{\left(z-m\right)}^3\varphi (x)d $$(14.5)
where z is the surface height, m its mean value, x the sampling length and φ(x) the distribution function of the surface heights. The influence of the skewness value on the surface morphology is illustrated in Fig. 14.8. The skewness has been shown to be particularly important at the nanometer-scale because it plays a key role on the liquid droplet wetting ability upon its flattening on the surface of the substrate and thus on splat formation [Thomas T.R. (1999), Bahbou F. and P. Nylen (2005), Fukumoto M. and Y. Huang (1999).
Fig. 14.8 
Scheme of surfaces with different skewness. Reprinted with kind permission from [Montavon G. (2004)]

Figure 14.9 illustrates the skewness effect on a stainless steel 304 L kept at room temperature (Fig. 14.9a) with Sk close to 0 and preheated at 250 °C with a DC plasma torch (Ar–H2 plasma) during 120 s, resulting in a skewness close to 1 due to surface oxidation (Fig. 14.9b).

304 L stainless steel surface 1 × 1 μm2 (a) kept at room temperature after polishing, (b) preheated by a DC plasma torch (Ar-H2) at 250 °C during 120 s. Reprinted with the permission of Elsevier [Cedelle J. et al. (2006)]
The kurtosis Ku or third moment is used to quantify the anomalies in the heights, as illustrated in Fig. 14.10.

Illustration of surface morphologies and resulting Kurtosis [Conroy M. et al. (2005)]. Reprinted with the permission of Prof. G. Montavon
Parameters are also used to define the mean spacing Rsm, which is the arithmetic mean of the widths of the profile within the single measuring length that consecutively cross a lower threshold (C2) and an upper threshold (C1), as given by Eq. 14.6 and shown in Fig. 14.11.

Definition of the arithmetic mean spacing. Reprinted with kind permission from Springer Science Business Media
The question is: which parameter is directly related to the coating adhesion? For example, Bahbou F. and P. Nylen (2005) have studied the influence of Ra, Rsm, and RΔq on the adhesion of Ni 5 wt.% Al coating plasma sprayed onto Ti-6Al-4 V substrates grit blasted with two brown alumina grit sizes (blasting angle 45°). Results show that the adhesion values measured are poorly correlated with Ra or Rsm. However, the hybrid parameter containing both amplitude and spacing properties of the surface RΔq (i.e., the average slope: see Fig. 14.7) is rather well correlated to the coating adhesion.
Of course, many other parameters can be used to characterize surfaces, including fractal dimensions [Amada A. and T. Hirose (2000), Fukumoto M. et al. (2004), Amada S., H. Yamada (1996), Amada S. and A. Satoh (2000), Guessasma S., et al. (2003)]. In the latter case; however, the methodology to accurately describe the surface state is very important and the fractal methodology is sensitive to the measurement scale and to the calculation protocol [Amada S. and A. Satoh (2000)].
3 Cleaning
This is the first step for the substrate preparation. Before spraying, all contaminants, such as scale, oil, grease, and paint must be removed. After removing all contaminants, parts should be protected from airborne debris and fingerprints and should be handled with clean fixtures and materials. The main cleaning techniques are described in detail in ASM Handbook Volume 05: Surface Engineering (1994).
3.1 Solvent Degreasing
Solvent degreasing is a fast, efficient, and economical way commonly used to remove organic contaminants. Parts should be soaked 15–30 min to remove oil from interstices and surface pores. Porous materials must be soaked for longer periods. Most solvents are hazardous, and manufacturer’s instructions should be followed strictly (usage, location, aeration, and disposition). Recycling of solvents is strongly recommended. The solvents most often used include: Methyl-ethyl-ketone (MEK) and acetone. Aliphatic hydrocarbons are also used but in a blend of other solvents or diluents to be less aggressive and drying without forming a film. Isopropyl alcohols are used for precision cleaning, but they are not effective on heavy oils and some other contaminants. Large parts can be steamed or submerged into solvents, for example, aqueous washer solutions containing acetic acid. Chlorinated solvents, while very effective, are no more allowed due to environmental concerns.
3.2 Baking
The porous parts, such as those resulting from sand castings, that may absorb large quantities of oil are baked at 315 °C for 4 h to dry the oil and prevent bleeding.
3.3 Ultrasonic Cleaning
This process is used for relatively large pieces when contaminants are lodged in a restricted area. The solvent has to be adapted to the problem and the safety requirements. The equipment consists of a holding tank filled with a cleaning solution, mostly water with an appropriate detergent, in which the part is soaked while being exposed to strong ultrasonic vibration.
3.4 Wet or Dry Blasting
Wet abrasive blasting uses diluted slurry of abrasive media projected by an air jet onto the surface. Typical slurries are in the ratio 0.6 kg/L and rust inhibitors must be added. The abrasive size has to be adapted to the works to be done. Parts must be carefully rinsed after cleaning.
Dry abrasive is used to remove baked-on-deposits, scale, and oxides. A compressed air stream containing abrasive particles is directed, through a nozzle, toward the part to be treated [Lidong Wang (2004)]. The system is similar to grit blasting, but it should not be used for roughening because the contaminants introduced in the grit could pollute the surface.
3.5 Acid Pickling
Dilute acid etching is a very efficient method . The part is immersed totally in an acid solution for up to a few hours depending on the material and stock removal desired. After pickling, a hot water rinsing, an alkaline solution, and a careful hot water or steam blast cleaning are necessary.
3.6 Brushing
This process is used when only localized cleaning is needed. Small rotary wire brushes driven by a power tool are used in these cases to clean the surface.
3.7 Dry Ice Blasting
Dry ice blasting is a blasting method that uses small, compact dry ice pellets, which are not as hard as alternate blasting material. They are made of solid carbon dioxide at a temperature of about −79 °C. Typical pellet sizes are in the few mm range (typically a diameter of 3 mm and 5–15 mm long). The dry ice pellets are accelerated in a jet of compressed air similar to that used in traditional blasting operations. Upon impact the energy transfer to the surface knocks contaminants as in grit blasting, while the dry ice pellet explodes and warms rapidly, the CO2 gas produced expanding partly under the contaminant surface, thus participating in its removal. Moreover, they also create a micro-thermal shock between the surface contaminant and the substrate, inducing cracking and delamination of the contaminant. Dry ice blasting is a mild pretreatment method, since the dry ice pellets are relatively soft (hardness of 2–3 Mohs), thus causing only minimal damage to the surface and the fringe area. The system can be used on easily damaged surfaces like nickel, chromium , and soft aluminum for the removal of contaminants such as adhesives, varnish, oil, grease, and coal dust [Stratford S (2000), Spur G et al. (1999), Elbing F et al. (2003) and Bardi U et al. (2004)].
Dry ice blasting has occasionally been combined with the plasma spray coating operation. In this case, the dry ice blasting nozzle was located just before the plasma torch while the substrates were attached to a rotating holder with its axis orthogonal to those of the plasma torch and the dry ice blasting nozzle. With the simultaneous dry ice blasting of the substrate during the coating operation, the substrate and coating temperatures were reduced by a factor up to 2 compared to air jets cooling . [Dong S. et al. (2011)] have compared plasma sprayed Al2O3, CoNiCrAlY, and steel coatings, obtained with either conventional air cooling or dry ice blasting during plasma spraying. Denser and less oxidized steel and CoNiCrAlY coatings were obtained with dry ice blasting and the adhesive strength of the Al2O3 coating obtained was increased by about 30%. Authors attributed the improvement of the Al2O3 coating adhesion to the cleaning effect of the dry ice, the denser non-ceramic coating properties, to the mechanical effect associated with the impact of the dry ice on the surface, and the oxide reduction due to the better cooling efficiency [Dong S. et al. (2011)].
4 Roughening by Grit Blasting
After cleaning and masking several methods are used to produce a surface to which the sprayed coating will adhere. Dry abrasive grit blasting is the most commonly used roughening technique by which dry abrasive particles are propelled toward the substrate at relatively high speeds. On impact, the sharp, angular particles act like chisels, cutting small irregularities into the surface creating the so called “roughness” depending on the nature and size of the grit used, the substrate material properties, as well as the grit blasting conditions, as described in the following section.
4.1 Grit Blasting Equipment
The type, size, and degree of automation of any blast system must be tailored to the part and to the scale of the operation. Blasting must always be performed in an enclosure designed for that purpose and equipped with exhaust and dust collection equipment’s. As the grit particles fracture during the process and releases debris from the surface of the substrate in the form of fine dust, the used grit must be cleaned, re-screened, sized, and dust removed before recycling it in the process (generally it falls through a grated floor to a conveyor that transfers it to the cleaning system).
In thermal spraying, mainly two types of machines are used for the grit blasting operation:
-
Blast cabinets with suction-type nozzles
-
Pressure machines or blast generators
The principle of the suction-type gun is illustrated in Fig. 14.12.

Principle of the suction-type gun [Davis J.R. ed. (2004)]
The abrasive medium is dispensed from a hopper and air propelled to the substrate. These machines can be used with almost any type of abrasive with the exception of the larger sizes of crushed iron. This type of machine is less efficient than pressure-type machines, but the grit flow rate is lower (in a ratio of 3–6) and simpler. For more information about grit and air flow rates see the table given in [Davis J.R. ed. (2004)].
The pressure-type machine is shown schematically in Fig. 14.13. It is used for large work pieces requiring high production rates. They are more effective and efficient than suction-type machines, since higher velocities are imparted to the abrasive grains, thus allowing for greater cutting action. They use a closed reservoir for the abrasive, a carrier gas and a blasting nozzle. The reservoir is pressurized, and the grit carried, through the hose and nozzle to the part to be grit blasted. The reservoir must be periodically recharged with the abrasive, which is done automatically every time the compressed air supply is stopped. Different types of grit can be used with pressure-type machines with the grit velocity directly linked to the air pressure used.

Principle of the pressure-type grit-blasting machine
4.2 Grit Blasting Nozzles
Straight nozzles are commonly used for commercial work. There are many sizes (diameters), lengths, and configurations as illustrated in Fig. 14.14 for the three most common ones:

Schematic of three typical grit-blasting nozzles: (a) cylindrical or conical (b) Venturi (c) with deviated jet
Long wear nozzles are generally made of carbide (mainly WC) or a carbide-based composite [Bacova V. and D. Draganovska (2004) and Deng J., S. Junlong (2008)]. They are inserted into a steel or aluminum mounting to protect their hard, brittle, inner core.
The compressed air velocity vg, which determines the grit particle velocity, depends strongly on the nozzle internal cross section area Sn (when compressibility effects are neglected, where the air mass flow rate \( \left({\dot{m}}_g={\rho}_g\ {v}_g\ {S}_n\right) \) with ρg being its specific mass of the air. Because of the gradual wear of the nozzle inner surfaces during operation, its principal dimensions need to be checked on a regular basis to avoid drifting of the grit blasting, which would obviously affect the surface properties of the grit-blasted parts. It is to be noted that, for example, for an 8 mm i.d. nozzle a 10% increase in its internal diameter results in a 27% increase of Sn with a corresponding drop of the grit velocity for the same compressed air flow rate.
4.3 Grit Material
The most commonly used grits are aluminum oxide, silicon carbide, and steel grit. Upon impact, the abrasive particles induce a plastic deformation of the substrate and the sharp angular particles act like chisels, cutting small irregularities in the surface. As shown by Griffiths B. J., D. T. Gawne et al. (1996), two main types of surface damage were observed.
-
The first is produced by an impact from a sharp, angular grit particle that forms an indentation, often with a lip at its periphery. The crater formed is angular with steep sides and resembles the shape and form of the impinging grit. The crater is formed by plastic indentation of the surface region and elastic compression of the hinterland immediately beneath. It is designated indentation-deformation.
-
The second type of damage in which an impinging particle strikes the surface and micro-machines a crater with a large lip or prow at its exit end. The sharp edge of the particle has cut into the metal, creating a fresh surface, pushing the metal and folding it over onto the undisturbed surface. The crater is more curved than the previous one but still has very angular features particularly in the region of the micro-chip. This is designated cutting-deformation since it involves fracture as well as elastic-plastic deformation.
The amount of substrate deformation and irregularity created at the surface is a function of the size, specific mass, and hardness of the impacting particle and of its speed and angle at which it is directed toward the substrate (see Fig. 14.15a). Of course, the substrate deformation and the irregularity formed also depend on the substrate material (hardness, Young’s modulus …). The surface roughness is obtained by brittle fracture and/or micro-cutting [Griffiths B. J., D. T. Gawne et al. (1996)]. On impact the grit particles rebound without breaking (Fig. 14.15a) or with breaking (Fig. 14.15b).

Schematic of the grit particle impact creating an irregularity in the substrate before rebounding (a) without breaking, (b) with breaking
Again, it is very important to keep in mind that the particle momentum \( {m}_p\overrightarrow{v_p} \) depends on its mass, proportional to the cube of its mean diameter. Thus, broken particles, if reused, will have a lower momentum, even if, for the same airflow rate, the particle velocity increases when its size decreases.
Since the roughness of the surface depends on the size of the grit, abrasives are supplied in different grades characterized by the screen or sieve used to determine powder size and/or its PSD. They are defined by standard mesh sizes (usually between 12 and 320). The smaller is the mesh number, the courser is the grit (see Chap. 13 Powders, wires and cords). Smaller particles allow for the preparation of a larger area per hour (more particles in 1 kg of powder) but the roughness is less. The bigger the particles are, the faster is the material removal from the substrate surface and thus the rougher is the finish. Of course, the larger the particle grit size is, the higher is the compressive peak close to the substrate surface.
It is also important to emphasize that the number of particles impacting on a given surface during one second varies with the grit size and decreases when the grit size increases. This is illustrated in Fig. 14.16 from [Maruyama T. et al. (2006)].

Dependence of the number of grit particles per second on the mean grit diameter (suction-type machine, 6 mm i.d. nozzle, blasting pressure of 0.4 MPa [Bellmann R. and A. Levy (1981)], copyright ASM International, reproduced with kind permission
4.3.1 Aluminum Oxide
It is an angular and durable blasting abrasive that can be recycled (after sieving) many times. It is among the hardest grits that is used systematically for very hard surfaces (> 45 HRC). On soft surfaces (e.g., aluminum) it may be embedded. When properly crushed, aluminum oxide grits have sharp cutting edges. Its specific mass of 3900 kg/m3 is about half that of chilled iron grit (about twice as many particles in a kg of grit). There are two types of aluminum oxide:
-
Brown aluminum oxide , which contains less than 1.5% free silica, its composition is, for example, 93.3% Al2O3, 3.5% TiO2, 1.8% SiO2, 0.4% Fe2O3 (CaO and MgO < 1%), all percentages being in wt.%.
-
White aluminum, which is 99.5% pure grade. It is very hard (> 9 on the Mohs scale).
4.3.2 Silicon Carbide Grit
It is the hardest blasting medium available. High quality silicon carbide is manufactured to a blocky grain shape that splinters and results in grit particles having rather sharp edges. It may react at high temperatures with various substrates. The concern is that damage to the base material may occur, and coating deterioration may be caused by the combination of silicon and carbon with oxygen as well as the elements present both in the base material and in the coating. On the other hand, SiC allows getting “near to zero” contamination at the interface coating/substrate because it dissolves during heat treatment [Maruyama T. et al. (2006)]. SiC has a much greater tendency to embed and it breaks down more rapidly than aluminum oxide. However, it results in a surface with higher peaks and deeper undercuts when considering the same substrate, the same grit size and the same blasting conditions. This is illustrated in Fig. 14.17 [Yankee S.J. et al. (1991)].

Effect of grit material on surface roughness obtained (a) SiC grit (b) alumina grit. Same substrate, grit size distribution and blasting conditions [Scrivani A. et al. (2006)]
4.3.3 Angular Chilled Iron
The steel used contains more than 0.8 wt.% carbon (depending on its hardness) and less than 0.05 wt.% of sulfur and phosphorous. Its specific mass is about 7300 kg/m3. Different chemistries lead to different hardness:
-
The softer one (40–50 HRC) rounds off rapidly and is mainly used for stripping oxides and cleaning,
-
The harder one (55–65 HRC) maintains its angular shape and provides a good cutting action.
4.3.4 Other Grits
Silica is inexpensive and widely available. However, it presents an environmental hazard with the possibility of causing silicosis. In some countries, its use is either forbidden or submitted to strict regulations.
-
Crushed garnet: its composition and blasting properties vary widely, depending on the origin of the ore.
-
Crushed slag: it is made from the slag of certain types of furnaces. It is very angular, but its silica content must be checked.
4.4 Blasting Parameters
As mentioned earlier the quality of surface roughening by grit blasting depends on the blasting parameters, the properties of the grit used, as well as the properties of the substrate. These can be summarized as follows:
-
Blasting pressure/impact velocity
-
Blasting distance
-
Impact angle
-
Blasting time
-
Grit size and composition
-
Substrate Young’s modulus
4.4.1 Blasting Pressure
When increasing the blasting pressure, the particle impact velocity is increased. However, the effect is strongest with pressure-type machines, but rather small with suction-type machines [Amada S. et al. (1999) and Bahbou M.F. et al. (2004a)].
4.4.2 Blasting Distance
Results reported by [Mellali M. et al. (1997)] with three brown alumina grits, given in Fig. 14.18, shows the dependence of Ra on the blasting distance (suction-type machine, 8 mm i.d. nozzle). Whatever grit size is used, first Ra increases with the blasting distance reaching a plateau followed by a gradual decrease at distances above 150 mm.

Dependence of the average roughness Ra on the blasting distance for three different brown alumina grits, suction-type machine, nozzle i.d. 8 mm, aluminum substrate AU4G [Amada S. et al. (1999)]
Similar results were obtained with cast iron substrates FT-25 and hard steel 100C6. The results dispersion increases slightly with distance and the plateau is slightly broader when the Young’s modulus of the substrates increases. When the blasting distance, db is too short, the rebounding particles reduce the number and/or the efficiency of impacting grit particles with which they collide in-flight. When db is too large, the particle velocity decreases, especially that of small particles, which have a lower inertia. It is worth noting that results are more variable when considering Rt instead of Ra. However, the general trend is the same.
4.4.3 Impact Angle
The influence of the impact angle is still subject to controversy. However, most authors agree on the fact that if a surface is blasted at an angle from one direction and then sprayed at an angle of the opposite direction the coating-substrate bond is very weak. This observation demonstrates that the sprayed particles must penetrate into the surface asperities in order to be mechanically bound to the substrate surface [Davis J.R. ed. (2004)]. It could also be said that blasting with an angle results in some sort of “shadowing” effect. The blasting angle is generally varied between 45° and 90°. Below 45° the coating adhesion becomes very poor. One observation is that Ra is not affected by the blasting angle variation (between 45° and 90°). However, the fractal dimension changes [Yankee S.J. et al. (1991)]. Similar results were obtained by Mellali M et al (1997), who showed that between 60° and 90° the Ra variation was within the error limit. The study of Bahbou F. and P. Nylen (2005) spraying Triballoy 800 on Ti-6Al-4 V substrate (grit blasted with alumina: 60 mesh and a suction-type machine) has allowed precisely determining the shadowing effect. The results presented in Fig. 14.19 show that adhesive strength increases with the increase of the blasting angle from about 22 MPa at 45° to 28 MPa at 90° (27% increase), and it increases even more when spraying with the same angle (see Fig. 14.19). This demonstrates the existence of the shadowing effect, which is maximal when blasting at 55° and spraying at 90°.

Influence of the grit-blasting/spraying angles on adhesion (Triballoy 800 on Ti-6Al-4 V substrate). Numbers indicating blasting/spraying angles [Bahbou M.F. et al. (2004a)]
4.4.4 Blasting Time
Blasting time is a very important parameter. It is defined as the time which each surface unit will be exposed to grit particles. It depends on:
-
The radius of the target area, rt (mm), which increases with the blasting distance (almost linearly) [Amada S. et al. (1999)], and the nozzle i.d., and is almost insensitive to the grit size
-
The displacement velocity of the blasting nozzle, vm (m/s)
For example, Wigren J. (1988), using a sample support with a diameter (Ds = 600 mm), established that the blasting time tb (s) can be estimated using Eq. 14.7 as follows:
where P is the number of passes. The corresponding values of Ra for different alloys as a function of \( \left({t}_b/{r}_t^2,{10}^{-3}\right) \) [according to Eq. 14.7] are given in Fig. 14.20.

Dependence of the average roughness Ra on the reduced blasting time \( \left({t}_b/{r}_t^2,{10}^{-3}\right) \) for various alloys (alumina grit, suction-type machine, blasting distance 150 mm, grit flow 2 kg/mm) [Wigren J. (1988)]
The average roughness increases rapidly with the blasting time, reaching a plateau in a relatively short period (~0.003 × \( {r}_t^2 \) ~ 2.5–3 s). The time needed to reach this plateau (about 4 reduced times in Fig. 14.20) is the optimum blasting time [Celik E. et al. (1999)]. For longer blasting periods, the roughness decreases slowly, ut, as it will be shown later, the percentage of residual grit imbedded into the surface increases (see Sect. 14.4.5). Moreover, when increasing the blasting time, the substrate hardness increases with the blasting resulting in some sort of cold work (shot peening effect [Wigren J. (1988) and Celik E. et al. (1999)]). Of course, the larger is the grit size, the faster is the substrate hardening. This illustrated in Fig. 14.21 from Amada S. et al. (1999), where an aluminum alloy AU4G substrate has been blasted with 3 grit sizes of brown alumina during different times. In this figure, the time is expressed in terms of number of passes, a pass corresponding to the optimum blasting time (i.e., about 4 reduced time see Fig. 14.21). After 6 passes with the largest grit, suddenly the roughness is reduced by about 39%. It corresponds to the crushing of the peaks when the underneath hardness increases. For smaller grit sizes, the phenomenon occurs later (for example, 21 passes with the 1 mm grit on AU4G). When considering a harder substrate, for example 100C6 instead of AU4G, the phenomenon occurs after 11 passes for the 1.4 mm grit.

4.4.5 Influence of the Grit
As it could be expected the Ra increases with the increase of the particle size of the grit. This illustrated in Fig. 14.22 as reported by [Mellali M. et al. (1997) and Al-Kindi GA, Shirinzadeh B (2007)].

Influence of the brown alumina grit size (0.5, 1, and 1.4 mm) on the average roughness Ra for three substrate materials: AU4G, FT25, and 100C6 (p = 0.3 MPa, d = 130 mm, optimum time, suction-type machine, nozzle i.d. 8 mm) [Mellali M. et al. (1997)]
A similar result has been obtained by Yang Y. et al. (2006), who have shown that for grit sizes over 1.4 mm the Ra increases more slowly.
The nature of the grit also plays a role. For example, [Tanaka Y. and M. Fukumoto (1999) and Mohammadi Z. et al (2007)] have blasted a Ti-6Al-4V substrate with alumina grit (300–425 μm) and silica grit (710–1400 μm) both with suction-type machine, and silica grit (355–710 μm) with a pressure type machine. The blasting conditions were adapted to obtain for the three grits the same Ra = 3.51 ± 0.15 μm. When spraying hydroxyapatite in the same conditions, the following result was obtained for the bond strength (BS) of the coating:
-
Alumina grit (300–425 μm) suction-type machine, BS = 24.1 ± 2 MPa
-
Silica grit (710–1400 μm) suction-type machine, BS = 18.1 ± 3.4 MPa
-
Silica grit (355–710 μm) pressure type machine, BS = 19.1 ± 3.4 MPa
No clear explanation is given to these results and authors do not precise the grit residues. The effect of the grit nature (steel grits and conventional grits) on the roughness of A36/1020 steel has also been studied by Varacalle D. J. et al. (2006).
4.4.6 Effect of Substrate Young’s Modulus
For the same blasting conditions the Young’s modulus of substrate controls the roughness obtained as shown in Fig. 12.23 from Wigren J. (1988) and Thomas T.R. (1999). For the same blasting conditions, the average roughness increases when the Young’s modulus decreases (Fig. 14.23).

4.5 Grit Residue
Unfortunately, grit blasting always leaves grit residues on the surface. In most cases the grit embedding happens as shown in Fig. 14.24. A grit particle is broken on impact with the substrate and one fragment of it remains at the surface while the others rebound. Then the next particle impacting on the remaining fragment imbeds it. These phenomena are controlled, on the one hand, by the number grit particles impacting the substrate at any given time and their momentum distribution and, on the other hand, the Young’s modulus of the substrate material. The amount of grit residues increases with the substrate ductility, which becomes a problem for light weight alloys.

Scheme of the embedding of grit particles at the substrate surface
According to [Fukumoto M. and Y. Huang (1999) and Varacalle D. J. et al (2006)], the residues can have a significant impact on:
-
Surface preparation
-
Diffusion between substrate and coating
-
Wetting properties of impacting molten spray droplets on the substrate
-
Thermal stress due to thermal expansion coefficient mismatch between grit-matrix and first layers of the coating
In the following, a discussion is presented of the influence of the grit blasting parameters on the quantity of grit residues left at the surface and the available technique that could be used for their removal and then how to get rid of them. All measurements presented were performed at the optimum blasting distance for the different grit sizes and nozzle sizes used.
The analytical techniques used for the evaluation of level of surface contamination by grit residue include:
-
X-ray fluorescence [Mellali M. et al. (1997), Varacalle D. J. et al. (2006), Thomas T.R. (1999) and Tomovich S.J. and Z. Peng (2005)]: According to Wigren J. (1988), the analysis of 500 mm2 area requires about 30 seconds with a precision better than ±10%,
-
Optical microscopy coupled with image analysis: When using white alumina grit the imbedded particles are clearly seen with an optical microscope and the ratio of their surface S′ to the surface S of the substrate is easy to estimate [Amada S. et al. (1999)], [Al-Kindi GA, Shirinzadeh B (2007)],
-
Energy dispersive X-ray analysis: For alumina grit containing mainly Al2O3 and ZrO2, Amada S. et al. (1999), Maruyama T. et al. (2006) and Maruyama T. et al. (2007) measured Al and Zr at the substrate surface. The image indicating the content of one element was processed by image analysis using back-scattered mode to identify the alumina grit residue. The residual fraction of grits was determined as the ratio of the area covered by the residual grits to the total area of the substrate.
-
Dissolution of the blasted surface: the method was used by Maruyama T. et al. (2006) and Maruyama T. et al. (2007), for carbon steel substrates grit blasted with alumina. After dissolution of the blasted surface in a mixed acid solution, the grit residue removed was weighted and the substrate thickness measured. The method also allows obtaining the grit particle penetration depth that can be compared with cross-sectional images of the blasted surface.
4.5.1 Influence of the Blasting Angle
As shown in Fig. 14.25 [Bahbou M.F. et al. (2004a)], grit residue increases monotonously with the increase of the blasting angle, reaching a maximum at 75°–90°. The effect is mainly due to the easier rebounding of grit particles impacting the surface of the substrate at smaller angles between 45° and 75°.

4.5.2 Influence of the Blasting Time
The grit residue increases significantly with the blasting time. As with the substrate average roughness (see Fig. 14.20) the grit residue increases very fast up to a reduced time of about 4 (corresponding to 2.5 to 3.0 s) and after this knee increases more slowly but regularly as shown in Fig. 14.26 [Wigren J. (1988)]. Similar results were obtained by Mellali M. et al. (1997).

4.5.3 Influence of the Grit Size
The grit residue increases drastically with the blasting time. As for the substrate average roughness (see Fig. 14.20) the grit residue increases very fast up to a reduced time of about 4 (corresponding to 2.5–3 s) and after this knee increases more slowly but regularly (see Fig. 14.27 from [Maruyama T. et al. (2006)]. Similar results were obtained by [Mellali M. et al. (1997)].

Relationship between the mean diameter of the grit and the penetration depth of the imbedded grit (suction-type machine, blasting nozzle i.d. 6 mm, blasting pressure 0.4 MPa; white alumina grit, cold rolled carbon steel). Reprinted with kind permission from Springer Science Business Media [Maruyama T. et al. (2006)]
The bigger are the grit particles, the deeper the grit residue is embedded in the substrate (particles mass increases as the cube of its diameter). This illustrated in Fig. 14.28 from [Maruyama T. et al. (2006)].

Figure 14.29 from [Wigren J. (1988)] represents the correlation between average roughness and grit residues for different blasting pressures, blasting times, and two blasting angles. It shows that an increased pressure always means increased Ra and increased amount of grit residue, due to the higher energy of the grit particle (the same effect is obtained for a given pressure by increasing the grit particle mean size), and the higher flow of grit particles. The high Ra and low-grit residue percentage are best obtained with high pressure and short time for a given grit size [Mellali M. et al. (1997)]. The blasting angle is not the most important parameter.

Illustration of the correlation between surface roughness and grit residue, as a function of blasting pressure, angle and blasting time, see conditions in Fig. 12.20 caption: t1 = 10−3 \( {r}_t^2 \) s, t2 = 3 × 10⁻³ \( {r}_t^2 \) s, t3 = 12 × 10−3 \( {r}_t^2 \) s, t4 = 12 × 10−3 \( {r}_t^2 \) s [Bellmann R. and A. Levy (1981)]
4.5.4 Grit Residue Removal
The cleaning procedure after grit blasting, to get rid of as much residue as possible, consists in blowing compressed air at a pressure of 0.4–0.5 MPa with a nozzle i.d. of 4 mm for a few tens of seconds and then immersing the substrate in an acetone bath solution ultrasonically agitated. As measured by Yankee S.J. et al. (1991) on Ti-6Al-4V substrates blasted with SiC or Al2O3 grit with a size of 36 mesh, the SiC residues are easier to remove than the Al2O3 ones. This is illustrated in Fig. 14.30 where the percentage decreases in the original contamination ratio is plotted (the original ratio being normalized at 100%).

Reduction in contamination, as determined via X-ray fluorescence, for two cleaning procedures (Ti-6Al-4V substrate, 36 mesh grit: SiC or Al2O, suction-type machine, 6.4 mm i.d. nozzle, 0.5 MPa). Reprinted with kind permission from ASM International [Yankee S.J. et al. (1991)]
It can be seen that both methods work for SiC, but they are much less effective for Al2O3, which has the tendency to embed in the Ti-6Al-4V substrate surface. The SiC-roughened substrates were found to contain 7 area % of residue grit, while Al2O3-roughened substrate entrained 12 area %. However, in spite of that, the adhesion of hydroxyapatite (HA) coatings sprayed under the same conditions presented better adhesion on the alumina grit-blasted substrate and cleaned by air blast (compare Fig. 14.31a to Fig. 14.31b), in spite of the fact that the Ra was similar and the alumina grit residues more important with alumina [Yankee S.J. et al. (1991)].

Comparison of adhesion (breaking) strength of HA coatings plasma sprayed on Ti-6Al-4 V substrates roughened with (a) SiC and (b) Al2O3. Reprinted with kind permission from ASM International [Yankee S.J. et al. (1991)]
4.6 Grit Wear
The grit wear is strongly linked to the material used, the particle momentum at impact, that is, the blasting pressure and/or the grit size. For example, SiO2 is more breakable than SiC, which is more breakable than alumina. For alumina, Mellali M. et al. (1997) have made a systematic study of the grit wear. Figure 14.32 shows three grit size distributions after one cycle (corresponding to the optimum blasting time: the knee in the curves of (Fig. 14.21) for three blasting pressures and three grit sizes. The fragmented grit is important especially for the largest particles.

Change of the alumina grit size distribution after one cycle (~3 s) for different blasting pressures and different initial grit sizes. Black bars correspond to the initial size distribution (suction-type machine, nozzle i.d. 8 mm) (a) 1.4 mm, (b) 1 mm, and (c) 0.5 mm. Reprinted with kind permission from Springer Science Business Media [Mellali M. et al. (1997)], copyright © ASM International
A single cycle of the grit significantly increases the quantity of small particles particularly when their velocity (blasting pressure) increases. The grit fragmentation increases with the number of cycles, as summarized in Table 14.1, for a suction-type machine and a XC38 low-carbon steel substrate.
The authors [Mellali M. et al. (1997)] also show that when using the same grit, without sieving it, to roughen surfaces, the Ra obtained decreased, as shown in Fig. 14.33, and the grit residue increases, especially for the larger grit for any substrate [Mellali M. et al. (1997)].

Average roughness of AG4.5 substrates obtained with three different alumina grit sizes (1.4, 1, and 0.5 mm) used for up to six cycles without sieving it. Reprinted with kind permission from Springer Science Business Media [Mellali M. et al. (1997)], copyright © ASM International
4.7 Residual Stress Induced by Grit Blasting
Grit blasting induces compressive stress within metallic substrates [He Jianhong et al. (2008)] by plastic deformation of a layer of about 0.1–0.2 mm in thickness below its surface [Mellali M. et al. (1997)]. This is illustrated in Fig. 14.34 for a cast iron substrate blasted with 0.5 mm alumina grit. With 1.4 mm alumina grit, the maximum compressive residual stress can reach 1600–2000 MPa. This stress, of course, modifies the stress distribution between coating and substrate. When spraying materials with high heat content the blasting compressive stress can be partially released when the plastically deformed substrate layer is heated over the recovery temperature [Liao H. et al. (1999)]. This relaxation is only partial because the spray time is generally shorter than the time necessary for complete relaxation. To relax substrate compressive stress after grit blasting and before spraying, the substrates must be heated in a furnace, where the atmosphere is controlled to avoid oxidation, for example, according to the recommendation of ASM Metals Handbook (1964).

Residual stress distribution, measured by hole drilling method, within a cast iron FT25-blasted substrate (suction-type machine, p = 0.3 MPa, nozzle i.d. 8 mm, alumina grit d50 = 0.5 mm). Reprinted with kind permission from Springer Science Business Media [Mellali M. et al. (1997)], copyright © ASM International
Mellali M. et al. (1997) have studied the influence of the grit-blasting parameters on the residual compressive stress induced by following the deflection of flat beams (2 × 10 × 100 mm) grit blasted under different conditions. Compared to the hole drilling method, the beam deflection gives only a mean value and no distribution along the substrate thickness, but the measurement is straightforward. Table 14.2a summarizes few results obtained with a low-carbon steel substrate (34CD4), grit blasted with three different alumina grits, and two blasting pressures. As could be expected, the deflection increases drastically with the grit size (roughly tripled between a grit of 1.4 mm against one of 0.5 mm) and the blasting pressure, especially for the 1.4 mm grit. The blasting time has also a non-negligible effect, especially for the largest grit (see Table 14.2b).
At last, when martensitic transformation occurs during blasting, for example, when grit blasting an austenitic stainless steel, large distortion can be observed [Abukawa S et al. (2006)].
4.8 Concluding Remarks on Grit Blasting
Grit blasting is a complex process, which has a significant impact on the adhesion of the sprayed coatings. For the best mechanical adhesion, intuitively the peak heights, characterized by Rt, must be adapted to the mean size of the splats, as illustrated in Fig. 14.35. Of course, the spacing between peaks also plays a key role [Mellali M. et al. (1997), Bahbou F. and P. Nylen (2005) and Fukumoto M. et al. (2004)].

Schematic of splat size relative to grit blasted surface peak sizes. (a) Splat size adapted to peak size. (b) Too small splat sizes relatively to peak size. (c) Too large splat size relatively to peak sizes
To achieve good mechanical adhesion, it is not sufficient that the size of the peak is adapted to that of the splat size; the flattening liquid drop must also penetrate within the undercuts. For that the impact pressure (ρp∙vp2) must be larger than the surface tension force. It results in the following expression:
where σp is the liquid drop surface tension and δuc the characteristic dimension of the undercut. Finally, the good criteria must consider both phenomena. The parameter that seems the most suitable to characterize the surface roughness seems then to be the root mean square value RΔq related both to peak sizes and mean distances between peaks. RΔq has not yet been systematically studied, but the coating adhesion can be rather well linked to it [Bahbou F. and P. Nylen (2005)].
Once the peaks mean size and distance between them has been chosen for a mean splat dimension, the way to achieve the corresponding roughness depends on:
-
Choice of the blasting machine (pressure or suction type)
-
Blasting nozzle internal diameter and air pressure controlling the grit particle velocities
-
Grit mean size and material controlling, with the particle mean velocity, the mean momentum of grit particles on impact with the substrate
It must be kept in mind, however, that the grit residues are also linked to the roughness and thus to particle size, velocity, and material, as well as the residual stress created within the top layer of the substrate. While residual stress can be released by heat treatment, removal of grit residue is more challenging. It may be simpler in this case to avoid, or reduce grit residue, by optimal selection of the blasting parameters (e.g., by choosing a smaller grit for obtaining the same roughness [Griffiths B. J., D. T. Gawne et al. (1996)].
Tables 14.3 and 14.4 summarize respectively the effects of the grit choice and of the grit-blasting parameters on the substrate modification (roughness, grit residue, residual stress induced) and the grit wear. While these offer good guidance in selecting the right grit and blasting conditions, it must be kept in mind that all these results depend strongly onto the substrate and especially its Young’s modulus. For example, with the same grit blasting conditions, the substrate roughness decreases if the Young’s modulus of the substrate increases.
5 High Pressure Water Jet Roughening
To avoid the embedded contaminants of the grit-blasting process, one of the alternative methods for surface preparation is the use of high-speed fluid jets. The advantage compared to grit blasting is no grit residues, less health hazard, and improved surface cleanness of the substrate. One of the first studies devoted to this technique using Inconel 718 substrates was reported by Taylor T. A. (1995a, b).
5.1 Equipment and Description of the Process
Pumps with pressures up to 360 MPa (51,000 psig) are used with the diameter of the water jet defined by a sapphire orifice with internal diameter of 0.3 or 0.4 mm. Water is the most widely used blasting fluid, often pretreated by reverse osmosis to fulfill the requirement of the pumping system. The velocity of the water jet at the exit of the sapphire orifice is a function of the water pressure, given by Eq. 14.9
where p is the water pressure, ρw the specific mass of water, and φ is the nozzle efficiency parameter [Momber A. W. et al. (2002)]. The energy of the jet is given by
where \( {m}_w={\dot{m}}_w\times {t}_E \), with \( {\dot{m}}_w \) the water jet mass flow rate and tE is the local exposure time (tE = LT/vt) with LT being the length of the profiled section and vt the transverse velocity of the jet with respect to the substrate, which is typically in the range of 50–2000 mm/min. The water jet mass flow rate is given by:
where do is the sapphire orifice internal diameter and α the outflow parameter. This results in the following expression for jet energy, Ej [Taylor T. A. (1995a)]:
For example [Abukawa S. et al. (2006)], with do = 0.3 mm, an exposure time of 600 ms and two water pressures , the following values are obtained:
-
p = 200 MPa (30,000 psig), vi = 600 m/s, Ei = 590 J,
-
p = 275 MPa (41,000 psig), vi = 704 m/s, Ei = 960 J.
The length of the water jet consists of a core zone, a transition zone, and a droplet-formation zone. The beginning of the droplet zone, Lc, is given by the following relationship [Taylor T. A. (1995a, b)]:
where do is the diameter of the sapphire orifice. For example, with do = 0.3 mm the droplet zone begins at Lc ~ 90 mm from the nozzle exit. Of course, the longer the standoff distance is, the larger is the water-spray region. The droplet velocity decreases with distance. A typical single erosion trace is between 1.5 and 2 mm. The pressure generated by an impacting water drop, po, is estimated as follows [Taylor T. A. (1995a)]:
where cs is the shock speed, cm the sound velocity, and ρm the specific mass of the substrate and at last cw the sound velocity in water. The shock speed is given by
For example [Taylor T. A. (1995a)], for a jet velocity of 600 m/s, with cw = 1460 m/s the impact pressure is po = 1496 MPa (217,700 psig)! Thus, the target, at a given standoff distance receives a number of high stress impacts resulting in a non-negligible residual stress below the substrate surface. The additional cyclic component (multiple droplet impact) gives rise to work hardens and embrittles of the surface. For example, after the water jet treatment, the surface hardness of hot-rolled low carbon steel (UH1) is significantly increased: from 24.3 HBR to 41.3 HBR [Taylor T. A. (1995a)].
The erosion of the substrate material by the water jet requires a minimum local exposure time. This is illustrated in Fig. 14.36 from Momber A. W. et al. (2002), representing the specific material removal in (mg/mm2) as a function of the local exposure time. Below a critical exposure time tEC no erosion occurs (tEC ~ 0.02 s). When the exposure time increases, the specific material removal increases linearly in the first stage, followed by a gradual flattening of the curve at tEs.

Influence of the water jet time exposure on the specific mass removal of the substrate [Momber A. W. et al. (2002)]. Reprinted with kind permission from Elsevier
The successive phenomena are summarized in Fig. 14.37 from Momber A. W. et al. (2002): below tEC probably a certain number of impacting water drops is required to erode material. However, the surface below is work harden and embrittle with micro-crack formation. The micro-cracks grow and over the time tEC intersect with each other with material loss occurring until the saturation level is reached at which further materials loss is stopped.

Thresholds and material removal in water jet profiling. Reprinted with kind permission from Elsevier [Momber A. W. et al. (2002)]
5.2 Water Jet-Blasting Parameters
The main parameters are the water pressure, stand-off distance between the water jet nozzle and the substrate, blasting time as well as the material mechanical properties.
5.2.1 Water Pressure
As shown by Eq. 14.9 the water jet velocity depends on the square root of the pressure and which has a significant influence on the metal erosion. This is illustrated in Fig. 14.38 from Taylor T. A. (1995b) for IN-718 solution annealed (1 h at 954 °C).

Water jet erosion of IN-718, heat treated 1 h at 954 °C. Weight loss per kilogram of water delivered versus water pressure jet (nozzle i.d. 0.4 mm). Reprinted with kind permission from Elsevier [Taylor T. A. (1995b)]
This figure shows a parabolic dependence on pressure, which indicates the existence of a threshold pressure , which is here about 196 MPa (29,400 psig). This threshold pressure can also be observed in Fig. 14.39, where 207 MPa (31,050 psig) is probably very close to it.

Erosion (mg/cm2) of IN-718 heat treated for 1 h at 954 °C, as a function of the mass of water delivered (kg/cm2) for three blasting pressures (nozzle i.d. 0.4 mm). Reprinted with kind permission from Elsevier [Taylor T. A. (1995a)]
5.2.2 Blasting Distance
As underlined by Taylor [Taylor T. A. (1995a) and Momber A. W. et al. (2002)], the optimum distance to achieve the best roughening is about 7.6 mm.
5.2.3 Blasting Time
The importance of a critical blasting time, tEc has been clearly shown in Fig. 14.36. [Taylor T. A. (1995a)] who emphasized that there is “a minimum mass of water required to impinge before there is measurable erosion that is an incubation period.” The minimum mass of water per unit surface (kg/m2) is calculated by dividing the water jet mass flow rate (kg/s) at a given pressure by the product of the water jet width (w) multiplied by its transverse velocity, vt (m/s). In conventional grit blasting roughening occurs after a minimum blasting time, and for a water jet it can be assumed that it corresponds to a minimum mass of water per unit surface (kg/m2). This is illustrated in Fig. 14.39 from Taylor T. A. (1995a), representing the metal eroded (mg/cm2) as a function of the mass of water delivered by square centimeters (kg/cm2) for three blasting pressures.
The effect of the blasting time is also shown in Fig. 14.40 from Taylor T. A. (1995a), where the logarithm of the erosion loss (mg/cm2) is shown as a function of the logarithm of the traverse rate, vt (cm/min) for two blasting pressures: 207 and 345 MPa (31,050 and 51,750 psig). It can be seen that a small decrease of the blasting time induces a one order of magnitude decrease of the erosion.

Water jet erosion of IN-718, heat treated for 1 h at 954 °C, log10—log10 plot of weight loss versus jet traverse rate Tr (cm/min) showing an approximate slope of −2. Reprinted with kind permission from Elsevier [Taylor T. A. (1995a)]
The average surface roughness Ra is linked to the erosion loss (mg/cm2), as shown in Fig. 14.41 from Taylor T. A. (1995b). Although Ra varies rapidly up to 15 μm with the erosion weight loss, this variation is strongly damped for larger values. The water jet pressure does not seem to have any effect.

Water jet erosion of Rene 80: dependence of the average roughness Ra on the erosion weight loss: two pressures: 276 and 345 MPa are considered, nozzle i.d. 0.4 mm. Reprinted with kind permission from ASM International [Taylor T. A. (1995b)]
The cleaning procedure after grit blasting, to get rid of as much residue as possible, consists in blowing compressed air at a pressure of 0.4–0.5 MPa with a nozzle i.d. of 4 mm during a few tens of seconds and then immersing the substrate in an acetone bath solution ultrasonically agitated. As measured by Yankee S.J. et al. (1991) on Ti-6Al-4V substrates blasted, with a 36 mesh SiC or Al2O3 grit, the SiC residues are easier to withdraw than the Al2O3 ones. It can be seen that both methods work for SiC but they are much less effective for Al2O3, which has the tendency to embed in the Ti-6Al-4V substrate surface. The SiC roughened substrates were found to contain 7 area % of residue grit, while Al2O3 roughened substrate entrained 12 area %.
5.2.4 Substrate Material
Figure 14.42 from Taylor T. A. (1995b) correlates the surface roughness of a number of superalloys with their erosion weight losses. There are substantial differences in the roughness achieved with an Inconel sample depending on the heat treatment. The overexposure presents a substantially higher erosion loss and greater roughness. All alloys have a similar behavior for practical applications where Ra is in the range 3–8 μm.

Water jet erosion of various superalloys. Surface roughness versus weight loss. Reprinted with kind permission from Elsevier [Taylor T. A. (1995b)]
5.2.5 Comparison Grit and Water Jet Blasting
Taylor T. A. (1995a) remarks, “the detail of eroded surface by water jet increases with increasing magnification, suggesting the water jet erosion produces a fractal surface. The highest magnification micrograph shows a multitude of granular fractures of about 2 μm in size and rather micro-faceted.” When compared with conventional grit blasting at the same magnification and for similar average roughness, the feature size is at least an order of magnitude finer in the water jet surface. In contrast the grit-blasted surface appears smoother as the magnification is increased (see, e.g., Fig. 14.43 from Momber A. W. et al. (2002).

Eroded surface sections (scale 100 μm) of hot-rolled low carbon steel (UH1) Left: grit-blasted surface (alumina grit d50 = 165 μm, nozzle i.d. 8 mm, p = 0.475 MPa, suction-type machine) Right: water jet blasted (nozzle i.d. 0.3 mm, p = 248 MPA). Reprinted with kind permission from Elsevier [Momber A. W. et al. (2002)]
Knapp J.K. and J.A. Taylor (1996) have compared Inconel 718 and Mar-M 509 roughened by water jet and grit blasting and then plasma sprayed with the same superalloy. The have shown superior bounding capabilities of water jet roughened substrates compared to grit blasted substrates. For more details on water jet blasting, the interested reader can consult the reference by [Momber A.W. and R. Kovacevic (1998)].
Abrasive Water Jetting
It seems that Abrasive Water Jetting (AWJ) can improve pertinent surface characteristics with a higher degree of surface roughness due to the abrasion of the water jet and abrasive particles [Kovacevic R. et al. (1997)]. In this process the erosion of substrate material is primarily through the action of the abrasive particles, which are accelerated by a thin jet of high velocity water and directed through an AWJ nozzle [Wang L (2004)]. Abrasive particles are in the 100–150 mesh range and compared to conventional grit blasting, AWJ reduces grit embedding and grit residues. As for water blasting, the Ra increases with water pressure between (210 and 354 MPa) (31,500 and 53,100 psig), and with blasting time (up to a certain limit). The Ra increases also with the impingement angle, increasing progressively up to 60° and then slightly diminishing [Wang L (2004)]. This technique is mainly used for the abrasion and erosion of hard materials [Zeng J. and T.J. Kim (1996), and Ness E. and R. Zibbell (1996)].
6 Laser Treatment: Protal Process
The idea of laser treatment consists in coupling one or more Q-switched Nd:YAG lasers to the thermal spray torch. The PROTAL process has been developed by [Coddet C. and T. Marchione (1993), Coddet C. and T. Marchione (1997a), Coddet C. and T. Marchione (1997b), and Coddet C. and T. Marchione (1999)]. It combines in a single step the spraying operation and the surface preparation. The purpose of the laser irradiation is to eliminate the contamination films and oxide layers, to generate a surface state enhancing the deposit adhesion, and to limit the recontamination of the deposited layers by condensed vapors [Coddet, G. et al. (1999), and Coddet C. and T. Marchione (1997a)].
6.1 Laser Ablation
The interaction between a laser beam and a surface is a very complex problem that depends, among other parameters, on the nature of the substrate, its chemical and physical surface properties, the surface microgeometry (roughness), the beam energy density, the duration of irradiation, and the nature and pressure of the surrounding atmosphere. According to Coddet and Marchione (1997b), the incident laser energy is absorbed following two complementary mechanisms, namely the photonic absorption and the inverse Bremsstrahlung absorption. In both cases, the final result induces the excitation of electrons in the matter. The relaxation of these electrons follows three different mechanisms, depending on the electric properties of the substrate. For insulating materials, there is trapping of the excited electrons. For semiconductor materials, the relaxation is accomplished by heat radiation, while for metallic materials, which is the most common situation, the relaxation passes by the emission of a quantum of vibration energy (i.e., phonon). Basically, the phenomenon will consist of either thermal effects (the irradiation absorption increases the temperature locally until vaporization phenomena occur) or nonthermal effects such as photoablation. In every case, for each material, an intensity threshold needs to be observed.
The following parameters are to be considered in laser irradiation–material interaction:
-
Nature of the substrate, its chemical and physical surface properties, its surface micro-geometry (roughness) and for semi-transparent materials (such as zirconia, for example, in the 1 μm wavelength range) pores and cracks which reduce the material transmissivity.
-
E04nergy density of the laser beam (J/m2) and its angle of incidence. The latter is very important because the absorption of the laser energy by the material diminishes rapidly with the increase of the angle beyond 25°, between the laser beam and the normal direction with respect to the substrate surface.
-
Nature and pressure of the surrounding atmosphere. In most cases in thermal spraying, substrates are metallic. For a good adhesion of the sprayed particles to the substrate surface, it is necessary to clean the surface from adsorbates and condensates and, if possible, eliminate the oxide layer (when spraying a metal onto a metal).
-
The energy delivered by the laser irradiation must be adapted to what is required and the nature of the contamination [Coddet and Marchione (1999)]. The lowest threshold laser beam energy is required to get rid of the adsorbates and condensates at the surface (the maximum energy of chemisorption is below a few eV). Higher threshold laser beam energy is required to ablate the oxide layer at the material surface (provided it is thin enough of the order of a few tens of nanometers). Depending on the properties of the oxide layer, three possibilities must be considered:
-
If oxide layer is transparent to the irradiation wavelength, the energy will be absorbed by the metallic substrate underneath (in general a layer of a few tenths of μm). The resulting thermal effect abruptly expands the surface and induces the breaking and ejection of the oxide layer on top of it.
-
If oxide layer is semi-transparent, absorption will take place by both the oxide layer and the substrate.
-
If the oxide layer is opaque, the same phenomena occur as when it was transparent, but it is now the oxide layer which is heated.
-
6.2 Protal Experimental Setup
Depending on the thermal and optical characteristics of substrates, different phenomena such as heating, roughening, and ablation can be observed according to the energy density (J/m2) [Coddet, G. et al. (1999)]. In is essential in this case that the laser and spray gun be rigidly mounted in such a way that the passage of the laser treatment of the surface to be sprayed precedes immediately, or even overlap slightly, the passage of the spray gun for the deposition step. A schematic of a typical integrated system for the PPROTAL process is given in Fig. 14.44. The laser head is maintained near the spray torch in front of the sample holder. Both axes of the laser head and plasma torch make an angle of 20° relative to normal axis with respect to the substrate surface.

Schematic of the integrated system for the PROTAL process for air plasma spraying. Reprinted with kind permission from Springer Science Business Media [Coddet, G. et al. (1999)], copyright © ASM International
It is of primary importance that the sprayed spot is in the center of the laser irradiated spot, which must be larger than the spraying spot (see Fig. 14.45). Otherwise, particles would impact on a nontreated surface.

Schematic configuration of the laser-treated zone and of the location of the sprayed particles jet during the PROTAL process. Reprinted with kind permission from Springer Science Business Media [Coddet, G. et al. (1999)], copyright © ASM International
The laser used in the PROTAL process is a Q-switched Nd-YAG laser from Quantel (laser blast 1000), which operates at 1064 μm with an average power output of 40 kW, a maximum pulse frequency of 120 Hz with pulse duration (FWHM) of 10 ns. The laser beam is transferred through SiO2 optical fibers. Due to present technical limitations, the power delivery is about 10 W per fiber. A specific optical arrangement allows achieving rectangular-shaped beams with a “top-hat” energy distribution that permitted homogeneous irradiation [Coddet, G. et al. (1999)]. The laser head-target distances, defined by the optical system, range from 70 to 120 mm [Landau L. and E. Lifshitz, (1984)]. With this setup, energy densities that can be supplied vary from 5 to 25 kJ/m2.
6.3 Example of Results
First of all, it must be recalled that all laser parameters will have to be changed according to the material of the treated substrates. As per our knowledge, only the following substrate materials and coatings have been studied:
-
Aluminum-based alloy 2017 substrates with pure Cu, Ni-20 wt.% Cr, Al2O3-13 wt.% TiO2 coatings [Coddet, G. et al. (1999)], and Ni-5 wt.% Al coatings [Li H. et al. (2006a)].
-
Titanium-based alloy Ti-6Al-4V substrate with pure Cu, Ni-20 wt.% Cr, Al2O3-13 wt.% TiO2 [66], Ni-5 wt.% Al coatings [Coddet, G. et al. (1999)], [Li H. et al. (2006a)], [Leung N.P. et al (1992), and Conroy M. et al. (2005)].
-
Nickel-based alloy IN718 substrate with Ni-5 wt.% Al coating [Costil S. et al. (2004)].
-
Magnesium alloy AZ91 substrate with Ni-20 wt.% Cr coating [Liao H. et al. (2003)].
Moreover the influence of the laser treatment on the surface modification has been studied for the following substrates: pure aluminum (99.99%) [76], Ti-6Al-4V [Bahbou M.F. et al. (2004b) and Li H. et al. (2006b)], aluminum alloy A2017, and iron base alloy A430 [Li H. et al. (2006b)].
In general, it can be stated that the effect of the laser treatment depends on the substrate material, its oxidation (oxide layer thickness, porosity, and crack network), its roughness, and of course on the laser parameters (energy density, number of pulses).
6.3.1 Substrate Modifications
For Ti-6Al-4V substrates, the roughness generated by laser treatment varies with the laser energy density and the number of pulses, as indicated in Fig. 14.46. A significant increase of Ra begins at 10 kJ/m2, corresponding to the emergence of craters. Up to 20 kW/m2 the craters spread all over the surface and correspond to the maximum roughness. Above that value the surface is smoothened, and the roughness diminishes. Increasing the number of laser pulses smoothens the surface and protects the early-formed craters, thus the Ra decreases [Li H. et al. (2006b)]. Fig. 14.47a presents the initial state of the Ti-6Al-4V surface and Fig. 14.47b shows the craters after exposure to a single laser pulse of 20 kW/m2.

Dependence of a Ti-6Al-4V average surface roughness (Ra) on the laser energy density and number of laser pulses. Reprinted with kind permission from Springer Science Business Media [Li H. et al. (2006b)], copyright © ASM International

SEM images of the same zone of a Ti-6Al-4V surface: (a) initial state, (b) surface treated by a single laser pulse at a fluence of 20 kW/m2. Reprinted with kind permission from Springer Science Business Media [Li H. et al. (2006b)], copyright © ASM International
Craters are systematically created at surface defect locations, defects such as micro-inclusions or small scratches. The effect of the laser energy density and number of pulses is shown in Fig. 14.47. When comparing Fig. 14.47a, b it can be seen that with the increase of the laser energy density, the induced craters become denser with an enlarged size, linked to more ejected material [Li H. et al. (2006b)]. With multiple pulses, the irradiated surface becomes smooth displaying some periodic variation (Fig. 14.47c) that can be attributed to the laser-induced surface melting at the outermost layer [Li H. et al. (2006b)]. When the number of laser pulses increases to about 20, a “mud-cracked” morphology is formed on the smooth surface and the surface presents a yellowish color (slight oxidation). If more laser pulses are applied, the “mud-cracked” morphology becomes more distinct with a brighter yellow color that is an indication of the laser induced oxides (Fig. 14.47d) [Li H. et al. (2006b)]. Correspondingly, the Ra and the skewness SK vary, as indicated in Table 14.5 (Fig. 14.48).

SEM observation of laser irradiated area on Ti-6Al-4V substrate surfaces: (a) after a pulse at 10 kJ/m2, (b) 1 pulse of 20 kJ/m2, (c) 10 pulses at 20 kW/m2, and (d) 120 pulses at 20 kJ/m2. Reprinted with kind permission from ASM International [Li H. et al. (2006b)]
Similar results, however with fewer details, have been obtained for other materials [Coddet, G. et al. (1999)], [Costil S. et al. (2004)], [Li H. et al. (2006b)], [Bahbou M.F. et al. (2004b)]: in all cases, craters are formed with laser flux thresholds adapted. Of course, when increasing the number of laser pulses, which can also be done by reducing the relative laser-substrate velocity, the substrate temperature increases [Liao H. et al. (2003)].
6.3.2 Splat Formation
For Ni-5 wt.% Al sprayed on Ti-6Al-4V splats tend to be disk shaped when the laser heating of substrate reaches about 165 °C. It is worth noting that with the conventional preheating by the plasma jet, the same result is achieved at 250 °C, while the splat is extensively fingered at 165 °C [Li H. et al. (2006a)].
However, if the substrate has been preheated by the plasma torch at about 200 °C, the difference between splats with and without laser treatment is very small [74]. On non-preheated substrates, splats are close to disk shape when laser treatment is used, and are extensively fingered otherwise [Li H. et al. (2005)]. Of course, the disk-shaped splats are obtained only if the laser energy density is sufficient, that is, roughly 15 kJ/m2 [Coddet, G. et al. (1999)].
6.3.3 Coating Adhesion
Adhesion has been measured either by the interfacial indentation test or the tensile adhesion test. However significant differences were observed between the results (tensile adhesion test) of different treatments according to the method used, the interfacial indentation seeming to be more favorable to the PROTAL process [Coddet C. and T. Marchione (1997a). Compared to the standard preparation (degreasing and grit blasting but with no preheating) the PROTAL process applied to a smooth surface is either equivalent (NiCr coating) or worse (pure Cu or Al2O3-TiO2). However, it must be kept in mind that with the PROTAL process and the 7.5 kJ/m2 flux, the Ra is only about 0.09 μm, and the oxide layer has not been completely removed. Moreover, the size of the laser spot is very close to that of the sprayed spot and thus the adhesion is probably poor in the fringes of the sprayed spot.
However, the process must be carefully optimized for each substrate and sprayed material. For example, with Ni-20 wt.% Cr deposited on magnesium alloy substrates [Li H. et al. (2006b)] the adhesion reaches 50 MPa for an energy density of 10 kJ/m2, about 20 MPa with 15 kJ/m2, and close to 30 MPa for 20 kJ/m2! When preheating the substrate over the transition temperature (250 °C) for Ni-5 wt.% Al sprayed onto Ti-6Al-4V, the adhesion of the coating reaches 30 MPa. On the other hand, when the preheating is followed by one laser pulse at 20 kJ/m2, it is raised to 40 MPa. To conclude , while this technique seems to be promising because it combines surface preparation with the spray operation, much effort is still necessary to optimize it.
7 Case Studies
Bahbou M.F. et al. (2004b) studied the effects of grit-blasting and plasma-spraying angles on the adhesion strength of an alloy (Tribaloy 800) that was plasma sprayed on a titanium-base alloy. Five different spray and grit-blast angles were investigated: 45°, 55°, 65°, 75°, and 90°. The surface texture in different directions was characterized by the classic average roughness and by a fractal analysis number using a two-dimensional fractal analysis method. The grit residue was measured by an X-ray spectrometer. The study showed that the maximum adhesion strength was close to a 90° blasting and spraying angle. However, the grit residue reached its maximum at a 75° blasting angle. From the image analysis of the interface in different directions, it was found that the non-perpendicular grit blasting produces an anisotropic surface. The fractal analysis method showed a rather good correlation with the blasting angle. However, no good correlation between the fractal number and the adhesion strength was found.
According to Zeng Z. et al. (2012), in order to prepare heat-resistant inner layer of hot-forging die, plasma spraying, plasma re-melting, and plasma spray welding were adopted. Cr3C2 coatings of Ni-based were prepared, respectively, with 10%, 20%, and 30% Cr3C2 powder and W6Mo5Cr4V2 substrate. The coating microstructure analysis, the micro-hardness test, and the measurement of thermal parameters of coating were conducted. The experimental results show that the coating has the better thermophysical property by using plasma spray welding method with the powder ratio of 90% Ni60 and 10% Cr3C2, and by this way the micro-hardness of coating can achieve 1100 HV.
According to Wang J. et al. (2012), in order to produce the hear-resistant inner layer of hot-forging die, the plasma spraying and plasma re-melting and plasma spray welding were adopted. Substrate material was W6Mo5Cr4V2, including 10%, 20%, 30% tungsten carbide (WC) ceramic powder used as coating material to obtain different Nickel- based WC alloys coating. Micro-structure and micro-hardness analysis of the coating layer were conducted, as well as thermophysical properties for the coating layer were measured. The experimental results showed that the coating prepared with 70%Ni60, 30%WC powder had the best properties with plasma spray welding, in which the micro-hardness achieved 900 HV, meanwhile it can improve the thermal property of hot-forging die dramatically.
Dong S-J et al. (2013) deposited by atmospheric plasma spraying aluminum coating, as an example of spray coating material with low hardness, while dry ice blasting was applied during the deposition process. The deposited coatings were characterized in terms of microstructure, porosity, phase composition, and the valence states. The results showed that the APS aluminum coatings with dry ice blasting present a porosity of 0.35 ± 0.02%, which is comparable to the bulk material formed by the mechanical compaction. In addition, no evident oxide has been detected, except for the very thin and impervious oxide layer at the outermost layer. Compared to plasma-sprayed Al coatings without dry ice blasting, the adhesion increased by 52% for Al substrate using dry ice blasting, while 25% for steel substrate. Corrosion behavior of coated samples was evaluated in 3.5 wt.% NaCl aqueous using electrochemistry measurements. The electrochemical results indicated that APS Al coating with dry ice blasting was more resistant to pitting corrosion than the conventional plasma-sprayed Al coating.
Tian J.-J.et al. (2018) recall that corrosion of metal plays a detrimental role in service lifetime of parts or systems. Therefore, coating a protective film that is fully dense and defects free on the base metal is an effective approach to protect the base metal from corrosion. In this study, a dense NiCr-20Mo coating with excellent lamellar interface bonding was deposited by plasma spraying of the novel shell–core– structured Mo-clad-NiCr powders, and then post-spray shot peening treatment by cold spraying of steel shots was applied to the plasma-sprayed NiCr-20Mo coating to obtain a fully dense coating through eliminating possibly existed pores and un-bonded interfaces within the NiCr-20Mo coating. Corrosion behaviors of the NiCr-20Mo coatings before and after shot peening were tested to investigate the effect of the post-spray shot peening on the corrosion behavior of the NiCr-20Mo coating. Results showed that a much dense and uniform plasma-sprayed NiCr-20Mo coating with perfect lamellar bonding at most of interfaces was deposited. However, the electrochemical tests revealed the existence of through-thickness pores in the as-plasma-sprayed NiCr-20Mo coating. Through the post-spray shot peening treatment, a completely dense top layer in the coating was formed, and with the increase in the shot peening intensity from one pass to three passes, the dense top layer became thicker from 100 μm to reach 300 μm of the whole coating thickness. Thus, a fully dense bulk-like coating was obtained. Corrosion test results showed that the dense coating layer resulting from densification of shot peening can act as an effective barrier coating to prevent the penetration of the corrosive medium and consequently protect the substrate from corrosion effectively.
Grishina I. P. et al. (2019) proposed a combined technology for the modification of the surfaces of titanium implants by laser radiation followed by the plasma spraying of biocompatible coatings. They performed comprehensive investigations of the coatings with the use of SEM, optical microscopy, and other methods. The coatings obtained by using the proposed procedure were characterized by the high adhesive strength, structural uniformity, and a sufficiently high degree of hydrophily.
Ding Y. et al. (2019) recall that the adhesive strength to the substrate plays an important role in the performance of thermal-sprayed coatings and could determine the coating’s service life. It depends to a large extent on the state of the substrate surface prior to coating deposition. In this work, a novel surface pre-treatment technique was introduced to thermal spraying, namely, bristle blasting. This process is fundamentally a mechanical abrasion process using a rotating brush-like wheel. The adhesive strengths of a plasma-sprayed metallic coating (Ni5Al) and a ceramic coating (Al2O3) were examined and compared to that of coatings sprayed with conventional grit blasting surface pre-treatment. A mild steel and an aluminum alloy were selected as substrate materials. The results indicated that bristle blasting could be a practical solution for steel and aluminum alloys when grit blasting is not applicable on site. The adhesion of the sprayed coatings with different pre-treatments increased sequentially from mechanical grinding, bristle blasting to grit blasting. The adhesive strength of the Ni5Al coating deposited on the bristle-blasted substrate reached 60% of the adhesive strength of a coating deposited with the traditional grit-blasting pre-treatment, while for the alumina coating, it was only about 30%. Moreover, the effect of substrate materials should be considered when using bristle blasting as a surface preparation.
8 Summary and Conclusions
The proper preparation of the substrate surface prior to spraying is essential for the coating adhesion. It has to be carried out within the shortest time possible prior to spraying. Surface preparation comprises the following four steps:
-
Cleaning is the first step to removing contaminants such as oil, greases, paint, rust, scale, and moisture. This operation is quite conventional, but it is essential.
-
Masking is necessary to prevent the deposition of the coating on areas where it is not wanted. It also improves the uniformity of the deposit when coating limited areas.
-
Roughening is crucial for optimal coating adhesion to the substrate. The degree of roughness has to be compatible with the mean size of splats: the Rt (also called Rz) must be about 2.5 times the mean splat diameter, and the spacing between peaks has to be sufficient for the liquid flattening droplet to penetrate between them. The root mean square value RΔq seems to be the roughness parameter that correlates the best with the coating adhesion. Roughening can be achieved by grit blasting or water jet. The former is probably the most commonly used. The degree of roughness, grit residues, and blasting induced stress depends on the blasting system used (suction or pressure-type machines), blasting pressure (important for pressure-type machine), blasting distance that must be optimized, grit material, and size. Since the grit particles can break down during the blasting operation, the grit used must be continuously sieved, and the fines discarded, in order to maintain a close control on the uniformity and degree of roughness generated. The main disadvantage of grit blasting is that grit residues must be removed prior to spraying, which is not necessarily easy. The main advantage of water jet, compared to blasting, is that no residue is formed. The degree of roughening depends strongly on the water jet pressure and mass flux of water per unit surface area (kg/m2). This parameter is calculated by dividing the water jet mass flow rate (kg/s) at a given pressure by the product of the water jet width (w) multiplied by its transverse velocity (m/s). Because of the rapid wear of the equipment and the liquid jet nozzles, which are rather expensive, this technique is mainly used for sophisticated coatings as in aero-engine industry.
-
Adsorbates and condensates elimination is performed either by preheating the substrate, generally with the spray torch, to temperatures at which they evaporate, or by blasting the substrate with dry ice just ahead of the spray spot, or by using a laser focused upstream of the spray spot. Substrate preheating is by far the most commonly used on an industrial scale; dry ice blasting has started to be used, while laser pretreatment is a still mainly at the laboratory developed stage.
Abbreviations
- 2-D:
-
Two-Dimensional
- 3-D:
-
Three-Dimensional
- AWJ:
-
Abrasive Water Jetting
- BS:
-
Bond Strength
- CS:
-
Cold Spray
- DC:
-
Direct Current
- DC-APS:
-
DC-Atmospheric Plasma Spraying
- FS:
-
Flame Spraying
- HA:
-
Hydroxyapatite
- i.d.:
-
internal diameter
- LHS:
-
Left-Hand Side
- MEK:
-
Methyl-ethyl-ketone
- PSD:
-
Particle Size Distribution
- PTA:
-
Plasma Transferred Arc
- RF:
-
Radio Frequency
- RF-IPS:
-
RF-Induction Plasma Spraying
- RHS:
-
Right-Hand Side
- SMT:
-
Surface Modification Technologies
- WAS:
-
Wire Arc Spraying
References
Abukawa, S., K. Kobayashi, and Y. Kobayashi. 2006. The relationship of work distortion and surface roughness on grit blasting process. In TS-2006, ed. B. Marple et al. Materials Park: ASM International.
Al-Kindi, G.A., and B. Shirinzadeh. 2007. An evaluation of surface roughness parameters measurement using vision-based data. International Journal of Machine Tools and Manufacture 47: 697–708.
Amada, A., and T. Hirose. 2000. Planar fractal characteristics of blasted surfaces and its relationship with adhesion strength of coatings. Surf Coat Technol 130: 158–163.
Amada, S., and A. Satoh. 2000. Fractal analysis of surface roughened by grit blasting. Journal of Adhesion Science and Technology 14 (1): 27–41.
Amada, Shigeyasu, and Hiroshi Yamada. 1996. Introduction of fractal dimension to adhesive strength evaluation of plasma-sprayed coatings. Surface and Coatings Technology 78: 50–55.
Amada S., T. Hirose, and T. Senda (1999) Quantitative evaluation of residual grits under angled blasting, Surface and Coatings Technology 111 1–9.
ASM Handbook. 1994. Volume 05: Surface Engineering (1056 pages).
ASM Metals Handbook. 1964. ASM International, Materials Park, OH 44073–0002, USA.
Bacova, V., and D. Draganovska. 2004. Analysis of the quality of blasted surfaces. Materials Science 40 (1): 125–131.
Bahbou, F., and P. Nylen. 2005. Relationship between surface topography parameters and adhesion strength for plasma spraying. In ITSC-2005, ed. E. Lugscheider. Düsseldorf: DVS.
Bahbou, M.F., P. Nylen, and J. Wigren. 2004a. Effect of grit blasting and spraying angle on the adhesion strength of a plasma-sprayed coating. Journal of Thermal Spray Technology 13 (4): 508–514.
Bahbou, F., P. Nylen, and G. Barbezat. 2004b. A parameter study of the PROTAL® process to optimize the adhesion of Ni5Al coatings. In ITSC-2004. Düsseldorf: DVS.
Bardi, U., L. Carrafiello, R. Groppetti, F. Niccolai, G. Rizzi, A. Scrivani, and F. Tedeschi. 2004. On the surface preparation of nickel superalloys before CoNiCrAlY deposition by thermal spray. Surface and Coatings Technology 184: 156–162.
Bellmann, R., and A. Levy. 1981. Erosion mechanism in ductile metals. Wear 70: 1–27.
Bradley, C. 2000. Automated surface roughness measurement. International Journal of Advanced Manufacturing Technology 16: 668–674.
Cedelle, J., M. Vardelle, and P. Fauchais. 2006. Influence of stainless-steel substrate preheating on surface topography and on millimeter- and micrometer-sized splat formation. Surface and Coatings Technology 201 (3–4): 1373–1382.
Celik, E., A.S. Demirkiran, and E. Avei. 1999. Effect of grit blasting of substrate on the corrosion behavior of plasma sprayed Al2O3 coatings. Surface and Coatings Technology 116–119: 1061–1064.
Coddet, C., and T. Marchione. 1993. Process for the preparation and coating a surface and apparatus for practicing sand process (in French), French patent FR-9,209,277, July 21st., (1993).
———. 1997a. Process for the preparation and coating a surface and apparatus for practicing sand process, European patent extension EP-0,580,534-A1 April 23rd. (1997).
———. 1997b. Process for the preparation and coating a surface and apparatus for practicing sand process, US patent extension, US-5,668,564, Nov 18th. (1997).
———. 1999. Process for the preparation and coating a surface and apparatus for practicing sand process, Canadian patent extension, CA-2,101,004 July 13th., (1999).
Coddet, G., S. Montavon, O. Ayrault-Costil, F. Freneaux, G. Rigolet, F. Barbezte, A. Diard Folio, and P. Wazen. 1999. Surface preparation and thermal spray in a single step: The PROTAL process-example of application for an aluminium-base substrate. Journal of Thermal Spray Technology 8 (2): 235–242.
Conroy, M., et al. 2005. A comparison of surface metrology techniques. Journal of Physics Conference Series 13: 458–465.
Costil, S., H. Li, and C. Coddet. 2004. New developments in the PROTAL® process, in ITSC-2004, DVS, Düsseldorf, Germany, proceedings.
Davis, J.R., ed. 2004. Handbook of thermal spray technology. Materials Park: ASM International.
Deng, J., and S. Junlong. 2008. Sand erosion performance of B4C based ceramic nozzles. International Journal of Refractory Metals and Hard Materials 26: 128–134.
Ding, Y., H. Li, and Y. Tian. 2019. Bristle blasting surface preparation in thermal spraying. Journal of Thermal Spray Technology 28: 378–390.
Dong, S., B. Song, B. Hansz, H. Liao, and C. Coddet. 2011. Improvement in the microstructure and property of plasma sprayed metallic, alloy and ceramic coatings by using dry ice blasting. In 5th. RIPT conference, CEC Limoges December 2011, e-proceedings.
Dong, S.-J., B. Song, G.-S. Zhou, C.-J. Li, B. Hansz, H.-L. Liao, and C. Coddet. 2013. Preparation of aluminum coatings by atmospheric plasma spraying and dry-ice blasting and their corrosion behaviour. Journal of Thermal Spray Technology 22 (7): 1222–1229.
Elbing, F., N. Anagrehb, L. Dorn, and E. Uhlmann. 2003. Dry ice blasting as pretreatment of aluminum surfaces to improve the adhesive strength of aluminium bonding joints. International Journal of Adhesion and Adhesives 23: 69–79.
Fukumoto, M., and Y. Huang. 1999. Flattening mechanism in thermal sprayed Ni particles impinging on flat substrate surface. Journal of Thermal Spray Technology 8 (3): 427–432.
Fukumoto, M., I. Ohgitani, and T. Yasui. 2004. Effect of substrate surface change on flattening behaviour of thermal sprayed particles. Materials Transactions 45 (6): 1869–1873.
Griffiths, B.J., D.T. Gawne, and Guishu Dong. 1996. The erosion of steel surfaces by grit-blasting spraying as a preparation for plasma. Wear 194: 95–102.
Grishina, I.P., S.V. Telegin, A.V. Lyasnikova, O.A. Markelova, and O.A. Dudareva. 2019. Development of the combined technology of modification of the surface of titanium implants by laser radiation with subsequent plasma spraying of bio-compatible coatings. Metallurgist 63 (1–2): 215–230.
Guessasma, S., G. Montavon, and C. Coddet. 2003. On the implementation of the fractal concept to quantify thermal spray deposit surface characteristics. Surface and Coatings Technology 173 (1): 24–38.
He, Jianhong, Bruce Dulin, and Thomas Wolfe. 2008. Peening effect of thermal spray coating process. Journal of Thermal Spray Technology 17 (2): 214–220.
Hu, Z., Lei Zhu, Teng Jiaxu, Xuehong Ma, and Shi Xiaojun. 2008. Evaluation of three-dimensional surface roughness parameters based on digital image processing. International Journal of Advanced Manufacturing Technology 2008 (January).
Knapp, J.K., and J.A. Taylor. 1996. Waterjet roughened surface analysis and bond strength. Surface and Coatings Technology 86–87: 22–27.
Kovacevic, R., M. Hashish, R. Mohan, M. Ramula, T.J. Kim, and E.S. Geskin. 1997. State of the art of research and development in abrasive-water-jetting machining, Transactions of ASME. Journal of Manufacturing Science and Engineering 119: 776–785.
Landau, L., and E. Lifshitz. 1984. Statistical physics. Moscow: MIR.
Leung, N.P., W. Zupka, and W. Ziemlich. 1992. Cleaning techniques for removal of surface particulates. Journal of Applied Physics 73: 513–3523.
Li, H., S. Costil, H.-L. Liao, and C. Coddet. 2005. Role of laser surface preparation on the adhesion of Ni-5 wt%, Al coatings deposited using the PROTAL® process. In ITSC-2005: Explore its potential! ed. E. Lugscheider. Materials Park: ASM International.
———. 2006a. Role of the laser surface preparation on the adhesion of Ni-5 wt% Al coatings deposited using the PROTAL® process. Journal of Thermal Spray Technology 15 (2): 191–197.
Li, H., S. Costil, S.-H. Deng, C. Coddet, H.-L. Liao, K. Richardt, E. Lugscheider, and K. Bobzin. 2006b. Ni-Cr coatings deposited on a magnesium alloy substrate using the Protal process. In ITSC-2006, ed. B. Marple. Materials Park: ASM International.
Liao, H., P. Vaslia, Y. Young, and C. Coddet. 1999. Determination of the residual stress distribution from in situ measurements for thermally sprayed WC-Co coatings. Journal of Thermal Spray Technology 6 (2): 235–241.
Liao, H., A. Gammondi, S. Costil, and C. Coddet. 2003. Influence of surface laser cleaning combined with substrate preheating on the splat morphology. In TS-2003: Advancing the science and applying the technology, ed. C. Moreau and B. Marple, 883–888. Materials Park: ASM International.
Maruyama, T., K. Akagi, and T. Kobayaski. 2006. Effects of blasting parameters on removability of residual grit. Journal of Thermal Spray Technology 15 (4): 817–821.
———. 2007. Effect of the blasting angle on the amount of the residual grit on blasted substrates. In TS-2007, ed. B.P. Marple et al. Materials Park: ASM International.
Mellali, M., A. Grimaud, A.C. Léger, P. Fauchais, and J. Lu. 1997. Alumina grit blasting parameters for surface preparation in the plasma spraying operation. Journal of Thermal Spray Technology 6 (2): 217–227.
Mohammadi, Z., A.A. Ziaei-Moagyed, and A. Sheik-Mehdi Mesgar. 2007. Grit blasting of Ti-6Al-4 V alloys: Optimization and its effect on adhesion strength of plasma sprayed hydroxyapatite coatings. International Journal of Materials and Product Technology 19: 415–423.
Momber, A.W., and R. Kovacevic. 1998. Principles of abrasives water jet machining. London: Springer Ltd.
Momber, A.W., Y.C. Wong, R. Ij, and E. Budiharma. 2002. Hydro-dynamic profiling and grit blasting of low-carbon steel surfaces. Tribology International 35: 271–281.
Montavon G. 2004. Quality control of thermal sprayed coatings, Course Thermal Spraying, Aliderte Limoges France.
Ness, E., and R. Zibbell. 1996. Abrasion and erosion of hard materials related to wear in the abrasive water jet. Wear 196: 120–125.
Scrivani, A., G. Rizzi, and C. Giolli. 2006. Improved surface preparation of nickel-superalloys for MCrAlY coatings on gas turbine. In Proceedings of ITSC-2006 conference, ed. B. Larple et al. Materials Park: ASM International.
Shin, Y.C., S.J. Oh, and S.A. Coker. 1995. Surface roughness measurement by ultrasonic sensing for in-process monitoring. ASME Journal of Engineering for Industry 117: 439–447.
Spur, G., E. Uhlmann, and F. Elbing. 1999. Dry-ice blasting for cleaning: Process, optimization and application. Wear 233–235: 402–411.
Stratford, S. 2000. Dry ice blasting for paint stripping and surface preparation. Metal Finishing 98 (6): 493–499.
Tanaka, Y., and M. Fukumoto. 1999. Investigation of dominating factor on flattening behavior of plasma sprayed ceramic particles. Surface and Coatings Technology 12 (121): 124–130.
Taylor, T.A. 1995a. Surface roughening of metallic substrates by high pressure pure waterjet. Surface and Coatings Technology 76–77: 95–100.
———. 1995b. Surface roughening of superalloys by high pressure water jets. In TS-1995: Science and technology, ed. C.C. Berndt and S. Sampath, 351–358. Materials Park: ASM International.
Thermal Spraying, Practice, Theory and Applications. 1985. American Welding Society, Miami, FL.
Thomas, T.R. 1999. Rough surfaces. London: Imperial College press.
Tian, J.-J., Y.-K. Wei, C.-X. Li, G.-J. Yang, and C.-J. Li. 2018. Effect of post-spray shot peening treatment on the corrosion behavior of NiCr-Mo coating by plasma spraying of the shell–core–structured powders. Journal of Thermal Spray Technology 27: 232–242.
Tomovich, S.J., and Z. Peng. 2005. Optimized reflection imaging for surface roughness analysis using confocal laser scanning microscopy and height encoded image processing. Journal of Physics Conference Series 13: 426–429.
Tonshoff, H.K., H. Janocha, and M. Seidel. 1988. Image processing in a production environment. Annals CIRP 37 (2): 579–589.
Varacalle, D.J., Jr., D.P. Guillen, D.M. Deason, W. Rhodaberger, and E. Sampson. 2006. Effect of grit blasting on substrate roughness and coating adhesion. Journal of Thermal Spray Technology 15 (3): 348–355.
Vorburger, T.V., and E.C. Teague. 1981. Optical techniques for on-line measurements of surface finish. Precision Engineering 3 (2): 61–83.
Wang, L. 2004. Erosion testing and surface preparation using abrasive water-jetting. Journal of Materials Engineering and Performance 13 (1): 103–106.
Wang, J., H. Wang, H. Wang, and Z. Zeng. 2012. Preparation of Ni60-WC coating by plasma spraying, plasma re-melting and plasma spray welding on surface of hot forging die. Journal Wuhan University of Technology, Materials Science Edition 27 (4): 640–643.
Wigren, J. 1988. Grit blasting as surface preparation before plasma spraying. In Thermal spray: Advances in coatings technology, ed. D. Hauck, 99–104. Materials Park: ASM International.
Yang, Y., H.G. Wang, X.P. Cao, and L. Wang. 2006. Influence of substrate surface roughness on adhesive strength. In Proceedings of the ITSC-2006, ed. B. Marple et al. Materials Park: ASM International.
Yankee, S.J., R.L. Salsbury, and B.J. Pletka. 1991. Quality control of hydroxylapatite coating: properties, processes and applications. In TS-1991, ed. T. Bernecki, 505–513. Materials Park: ASM International.
Zeng, J., and T.J. Kim. 1996. An erosion model for abrasive waterjet milling of polycrystalline ceramics. Wear 199: 275–282.
Zeng, Z., H. Wang, Wang Hongfu1, and J. Wang. 2012. Preparation of Ni60-Cr3C2 coating by plasma spraying, plasma re-melting and plasma spray welding on W6Mo5Cr4V2.
Author information
Authors and Affiliations
Nomenclature
Nomenclature
Units are indicated in parentheses; when no units are indicated, the parameter is dimensionless.
1.1 Latin Alphabet
- AA:
-
Arithmetic average (μm), Eq.14.1
- c m :
-
Sound velocity in the substrate (m/s)
- c s :
-
Shock speed in the substrate (m/s)
- c w :
-
Sound velocity in water (m/s)
- d :
-
Blasting distance (m)
- d b :
-
Blasting distance (m)
- d o :
-
Sapphire orifice internal diameter for water jet (m)
- d 50 :
-
Particle diameter below which 50 wt.% of the particles are found
- Ds :
-
Sample support diameter (m)
- E j :
-
Water jet energy (J)
- h i :
-
Peak height (m)
- Ku :
-
Kurtosis, or third moment
- L c :
-
Distance to the beginning of the droplet zone (m)
- l n :
-
Assessment length (m), Fig. 14.5
- l t :
-
Transverse length (m), Fig. 14.5
- L T :
-
Length of the profiled section with the water jet (m)
- \( {\dot{m}}_g \) :
-
Air mass flow rate (kg/s)
- \( {\dot{m}}_w \) :
-
Water jet mass flow rate (kg/s)
- m p :
-
Particle mass (kg)
- \( {\dot{m}}_p \) :
-
Grit particle flow rate (kg/s)
- N :
-
Number of measurements (−)
- p :
-
Blasting pressure (MPa)
- P:
-
Number of passes
- r t :
-
Radius of the target area hit by blasting particles (m)
- R a :
-
Average roughness (μm), Eq. 14.2
- R sm :
-
Arithmetic mean of the widths of the profile (μm) Eq. 14.6
- R t :
-
Distance between the highest peak and the deepest undercut (μm)
- R z :
-
Root-mean square roughness (μm) Eq. 14.3
- R Δq :
-
Root mean square value (μm) Eq. 14.4
- S k :
-
Skewness parameter , Eq. 14.5
- S n :
-
Blasting nozzle internal cross section area (m2)
- t b :
-
Blasting time (s), Eq. 14.7
- t E :
-
Local exposure time (tE = LT/vt) to the water jet (s)
- t EC :
-
Critical exposure time to a water jet (s)
- t Es :
-
Time to saturation point (s) Fig. 14.36
- v g :
-
Air velocity (m/s)
- v j :
-
Water jet velocity (m/s)
- v m :
-
Displacement velocity of the blasting nozzle (m/s)
- v p :
-
Particle velocity (m/s)
- v t :
-
Transverse velocity of the water jet/substrate (m/s)
- x :
-
Sampling length (m)
- z :
-
Surface height (μm)
1.2 Greek Alphabet
- δ uc :
-
Characteristic dimension of the undercut (m)
- ρ g :
-
Air specific mass (kg/m3)
- ρ m :
-
Specific mass of the substrate (kg/m3)
- ρ p :
-
Specific mass of the particle (kg/m3)
- ρ w :
-
Specific mass of water (kg/m3)
- σ p :
-
Surface tension liquid drop
- φ :
-
Water jet nozzle efficiency parameter (−)
- φ(x):
-
Distribution function (−)
Rights and permissions
Copyright information
© 2021 Springer Nature Switzerland AG
About this chapter

Cite this chapter
Boulos, M.I., Fauchais, P.L., Heberlein, J.V.R. (2021). Surface Preparation. In: Thermal Spray Fundamentals. Springer, Cham. https://doi.org/10.1007/978-3-030-70672-2_14
Download citation
DOI: https://doi.org/10.1007/978-3-030-70672-2_14
Published:
Publisher Name: Springer, Cham
Print ISBN: 978-3-030-70671-5
Online ISBN: 978-3-030-70672-2
eBook Packages: Chemistry and Materials ScienceChemistry and Material Science (R0)