
Abstract
The CLARITY project (www.clarity-h2020.eu) aims to implement a new generation of climate services that allow the service users to perform an initial assessment of the expected climate change effects in the project area, as well as an initial assessment of the need for and of the usability of the adaptation options in the early project planning phase. The target users of this service are the consultants and urban planning experts that aren’t climate change experts but need to produce standardized reports indicating the climate hazard, exposure and impact data, as well as the expected impact of the adaptation options in the project area, as a part of the project planning. The initial implementation of this service uses the available open data to calculate the local heat hazard, population exposure and related impact indicators at the project location on the fly. In the initial implementation, the heat related can be automatically calculated for more than 400 European cities, with a spatial resolution of 500 × 500 m2. Extension to the flooding hazards and related impacts is in implementation. This article will describe in more detail the workflow and the technical implementation of the CLARITY screening service and discuss the value, potential and the limitations of the current service implementation.
You have full access to this open access chapter, Download conference paper PDF
1 Introduction/Methodology
1.1 Introduction
In recent years, the representation of climate information in a way to support decision making has been gaining momentum. Worldwide, these climate services are emerging as an essential tool to connect the advances in climate science with the domains of climate change adaptation.
The EU promotes climate resilience in different ways, e.g. by encouraging its member states to develop their own comprehensive climate adaptation plans [1], but also by providing support to individual projects by helping infrastructure developers in the identification of steps they can take to make investment projects climate resilient [2].
To provide customized support for urban and infrastructure planners, the CLARITY (Integrated Climate Adaptation Service Tools for Improving Resilience Measure Efficiency) project, funded through the European Union (EU) funding framework Horizon-2020, aims at providing an integrated Climate Services Information System (CSIS) to ease climate-proof urban infrastructure planning. CSIS guides users through several steps to obtain a project and location-specific assessment of climate change risks, as well as an evaluation of possible adaptation options.
In this paper, we shall explain the underlying CLARITY CSIS methodology, present the currently implemented CSIS application workflow and user interfaces and discuss the advantages, shortcomings and further development of the service.
1.2 CLARITY and the EU-GL Methodology
The CLARITY CSIS methodology is based on the “Non-paper Guidelines for Project Managers: Making vulnerable investments climate resilient” [3] and has been updated to comply with the IPCC-AR5 approach [4] by the CLARITY consortium [5]. The following Table 1 gives a summary of the changes, as compared to the workflow proposed in the original EU-GL document:
In line with the updated approach as outlined in the IPCC-AR5, the Hazard and exposure are independent variables of time and space, vulnerability is largely independent of time and space and the risk and impact evaluation are derived by the general relation:
Main difference between the risk and impact calculation is in the meaning of the “hazard” variable (H). In simple terms, the impact is a real or estimated damage resulting from a specific hazard event, whereas the risk is a probabilistic quantity that sums up all the possible damage for all the possible events in a certain period, weighted by the relative probability of the event.
For a concrete example of heat mortality (Fig. 1), this formula translates to “heat mortality (impact) is a function of the heat hazard intensity (e.g. duration of the heat episode) and the number of people in the area, as well as on their vulnerability to the heat hazard”.

Impact (damage) calculation example: impact of heat wave on human health.
Depending on the study scope, the elements at risk (population in Fig. 1) can be disaggregated in various vulnerability classes, e.g. by age (old people are more vulnerable than young ones) or by the socioeconomic status (poor people are more vulnerable than rich ones). Moreover, the vulnerability is almost location-independent. That is, the heat vulnerability of the population can be considered virtually the same in all of the southern Europe, but a different vulnerability curve must be used in the colder regions.
1.3 Screening Methodology: Simplifications and the Data Preparation
CLARITY methodology is applicable to studies with different complexity levels. In “expert” studies, the methodology is followed by the experts and merely the results of the work are presented using the CLARITY CSIS tool, whereas the “screening” calculations are performed automatically and nearly in the real-time. To achieve this, several simplifications need to be implemented.
For the start, the screening requires a pre-computed “screening data package” that contains a accurate but spatially relatively coarse hazard indicators, exposure and vulnerability data, as well as the high-resolution land cover data. Within the data package, the abstract notion of a “hazard” must be replaced by a concrete hazard indicator, e.g. a “heat hazard” by a “number of consecutive tropical nights” or a by another concrete indicator and a vulnerability function must be adjusted to the concrete hazard indicators used. Hazard input layers must be pre-calculated for a set of representative past and future climate scenarios. In practical terms, the CLARITY screening data package contains hazard layers for the following combination of parameters:
-
Three Representative Concentration Pathways: rcp2.6 (“early response”), rcp4.5 (“effective measures”) and rcp8.5 (“business as usual”)
-
Three event frequencies: “yearly”, “occasional” (every 5 years) and “rare” (every 20 years)
-
Four periods: historical, 2011–2040, 2041–2070 and 2071–2011
That is a total of ten datasets for each hazard indicator – nine for the future climate and the last on for the historical climateFootnote 1. Such indicators can be calculated from euro-CORDEX data at the resolution regional level (typically 10 × 10 km2) but preparing all the necessary indices for whole of the Europe, as we did in the project, is nevertheless a nontrivial task. As illustrated in Fig. 2, the resolution of this input data is far too low to be used in the urban screening context.

Number of “hot days” in the wider Vienna region, resolution 10 × 10 km2, historical data.
To account for the “urban heat islands” and similar urban microclimate effects, all the indicators must be available at a 500 × 500 m2 grid resolution or higher (e.g. 250 m or 100 m resolution would be even better). This type of downscaling can be performed as a part of an “expert study” for a smaller region, but a calculation for the whole Europe is not practical. Moreover, the expert studies tend to be rather expensive and preparing them can take weeks or even months.
To overcome this issue, CLARTIY consortium has developed a simplified downscaling models for each of the indicators that calculates the “local effects” (urban-scale variations) by superposing the high-resolution land cover data on e.g. terrain, building fabric, paving materials, green fraction, albedo, emissivity, shading conditions, and run-off coefficient on the lower resolution input data. The necessary high-resolution data has been extracted from (mainly) Copernicus datasets, as illustrated in the Fig. 3.

Example of information extraction from Copernicus datasets to derive the “albedo” dataset used in the CLARITY Urban Microclimate simplified model
The resulting urban-scale data is not as accurate as the results of a fully-fledged and validated expert study. However, the advantage is that the results can be calculated very quickly and cost efficiently. In our service prototype, the calculation typically takes 15–20 min on a simple server (no supercomputing facility necessary), even for relatively large areasFootnote 2.
A second advantage of this approach is that the effect of (some) adaptation options can be calculated by changing the characteristics of the land cover and re-calculating the local effects. E.g., the “cool paving” adaptation option changes the albedo and emissivity of the roads and build up open spaces, whereas the “green roofs” change the albedo, emissivity and the runoff coefficient, and introduce additional cooling through evapotranspiration.
Within the project, the simple downscaling models were developed: one for the heat hazard and one for the flooding hazard. At a time of writing this article, only the heat hazard model has been fully implemented in the CLARITY CSIS and the validation is under way. Full report on these models, and on the validation results, will be provided in a separate publication.
2 CSIS Screening Workflow Implementation
2.1 CSIS Overview
The CLARITY CSIS is composed of four main components:
-
1.
The web integration platform providing such functions as the user management, workflow management and data package management. This web platform is based on the Drupal 8 web application framework [6].
-
2.
WMS/WFS servers hosting the static (input) geospatial data that is necessary for the functioning of the service.
-
3.
Screening service based on the AIT EMIKAT platform [7] that implements the simple downscaling model, keeps track of all the project specific data and performs all the necessary calculations on demand. This service makes the calculation results available through standard WMS and WFS service as well as through an application specific read/write REST interface that can provide the data as e.g. GeoJSON or simple CSV tables.
-
4.
A set of the HTML5 GUI applications that can be easily embedded in the web integration platform and allow users to interact with the data from the backend services.
From the end-user, point of view, the GUI is the application. Therefore, this paper mainly concentrates on the implementation of the screening study workflow. More information on the technical details of the implementation is available in [8].
2.2 Prior to a Study: System Configuration and Data Management
Hidden from the end-users, the CSIS web integration platform allows the users with higher privilege level to define different types of the studies and the data packages that can be used with these study types. CLARITY data package is modelled similarly to a frictionless data package [9], and consists of:
-
Metadata that describes the structure and contents of the package (“descriptor”)
-
A set of “resources” such as data files that form the contents of the package
Moreover, each “resource” is a self-describing rich data set containing not only the links to the local data file(s) and/or service(s) providing the resource data on demand, but also the information about the data provenance, authors, licenses, and on the type of the data provided by this resource.
In contrast to the generic frictionless data package, the CLARITY data package specification imposes some constraints on the data and extends the descriptor with additional properties which ensure that data contained in a CLARITY data package is valid and suitable for being ingested and processed by CLARITY Services. On a technical level, a CLARITY data package is implemented as a set of related Drupal 8 “node” and “taxonomy” data types.
Data packages can be either imported in the CSIS from a JSON representation thereof or edited online using a relatively comfortable GUI interface. Once it is incorporated into the system, this data can be used both within the CSIS web integration platform and accessed by external services, either through a default JSON:API [10] or through a custom REST GET interface that outputs the complete data package at once and in a form that is (mostly) compatible with the frictionless data package JSON schema. Full CLARITY data package specification can be found at [11].
Second important configurable element of the CSIS integration platform is the “study template”. Study template consists of a set of the study-step templates corresponding to the steps in the CLARITY CSIS methodology. The integration platform provides an easy to use GUI for study template configuration that allows the system administrator to determine which of the methodology steps shall be covered by the specific study type and how each of the study step will look like.
As already mentioned, the way how the data is presented in a study is largely determined by the HTML5/JavaScript embedded applications and not by the integration platform itself. These applications are almost completely independent from the underlying integration platform and merely inherit some input parameters from it. Study templates provide placeholders where either such HTML5 applications or the Drupal views can be easily embedded. Finally, the study template also determines if some external data models need to be triggered by the study or not and how to do so. At a time of writing this article, only the “Urban infrastructure” screening model has been implemented, but we are also working on a “transport infrastructure screening”.
2.3 Starting a New Study
CLARITY CSIS studies are implemented as Drupal 8 groups, with the group itself containing the study context data and the actual study data modelled as group nodes. From the user perspective, starting a new screening study is as simple as clicking on the “Create a new study” button and filling in the initial context data (Fig. 4).

Adding a new study
Once this is done, the user is redirected to a study workspace, and provided with an introduction to CSIS methodology. The study workspace is illustrated in Fig. 5.

Study workplace
2.4 Study Workspace
Study workspace is a separate area on the CSIS that is dedicated to a specific study. It is implemented as a Drupal group and structured in the study steps (first row in in Fig. 5), with each step featuring several sub-steps (second row in in Fig. 5). Both the steps and the sub-steps are configurable through study-type templates, but each study step starts with the introduction and ends with a summary. While the introduction merely provides the contextual help, the summary sub-step provides a preview of the study report section corresponding to the current study step. Complete report can be accessed and printed or saved as PDF by clicking on the printer icon (right-top corner in Fig. 5).
The remaining sub-steps in the initial “Study” step are: “team”, “context”, “area”, and “data”. The functions related to these steps are:
-
Team: allows the study owner to invite other CSIS users as co-authors and assign them a specific role. Currently implemented are the “co-owner” (full rights), “team” (can edit but not delete the study elements) and “observer” (read-only)
-
Context: provides a summary of the study type and location and allows the user to re-define this. Most notably, this step allows user to indicate the country and the city/region where the project is situated.
-
Area: as illustrated in the Fig. 6, this step features a study area map. Initially, this map will automatically zoom and pan to the city/region chosen in the “context” step and feature a greyed region indicating where the study can be made. This can be a region that is significantly larger than the city itself, e.g. the Vienna region currently includes the suburban and rural areas around Vienna and even the city of Bratislava in neighboring Slovakia. This is a side effect of the way the underlying data (mainly the Copernicus Urban Atlas data [12]) is organized.
Fig. 6. 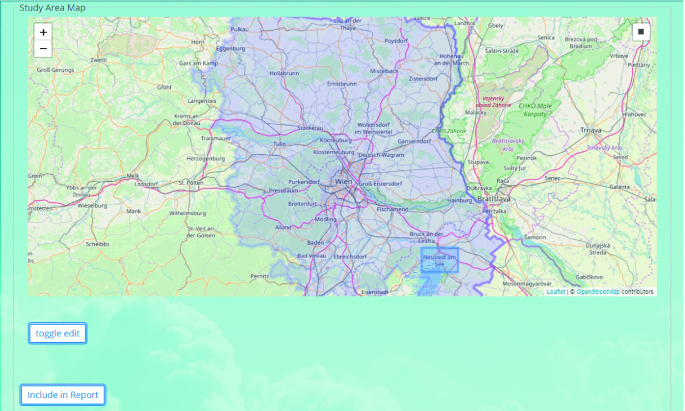
Choosing the study area

By clicking on the “toggle edit” button, the user can define a study area within this region. For illustration, a rather large area in the Neusiedl lake region has been selected in the Fig. 6.
The “include in report” button at the left-bottom corner of the Fig. 6 allows the user to take a map screenshot, add a comment to it and include the result in the future project report. This generic feature that appears again and again in the study workflow and allows the users to configure any interactive application that is embedded in the screening workflow, include the result in the report and comment the findings.
-
Data: here is where the user can choose a data package to be used in this study. Choice of the data package has a profound consequence on the data that will be available in the study. E.g., two data packages could provide data with different resolution/quality or even different type of data (different hazards, elements at risk, vulnerabilities, adaptation options).
Once the data package has been chosen, a “N out of 20 processes have finished. In general calculations take about 10–15 min depending on the size of the Study area.” will be shown to the user indicating that the calculation has been started in the background.
2.5 Data Visualization
What user needs to do to produce a study report now is to click through each of the steps and through all of the sub-steps shown on the screen, read the instructions provided in the contextual help, interact with the embedded applications and decide which data they wish to have included in the report. Currently, the screening workflow includes the following interactive applications (Fig. 7):

Prater area: land cover (green is the prater Park area) (Color figure online)
-
5.
First workflow step includes the EEA city factsheet, as a proof of concept for including third party applications.
-
6.
“Table” data views are provided at several steps. They allow the users to inspect the data values and allow sorting by any column and downloading of the data in several formats (CSV, JSON, GeoJSON).
-
7.
“Map” views are used in almost all steps, to visualize the geospatial data. As illustrated in Figs. 8, 9 and 10, it is already possible to compare the land cover with local heat hazard distribution, population density and heat mortality in the study area. Moreover, this comparison can be made for various combinations of the time period, emission scenario end event frequency and the resulting map screenshots can be easily included in the study report
Fig. 8. 
Prater area: mean radiant temperate (event frequency: yearly, rcp4.5, period: 2040–2071); temperature not calibrated but in a plausible range.
Fig. 9. 
Prater area: population exposure; scale: number of people living in the 500 × 500 m2 area
Fig. 10. 
Prater area: mortality (event frequency: yearly, rcp4.5, period: 2040–2071); units are “people per 500 × 500 m2 area”.
-
8.
Several scenario comparison views are provided in the scenario analysis (Fig. 11).
Fig. 11. 
Scenario comparison example: mortality pro million inhabitants in the whole study area.


2.6 Screening Model Calibration and Validation
CLARITY urban heat impact screening includes the calculation of the Ambient temperature TA, Mean Radiant temperature TMRT, and the simplified Universal Thermal Climate Index (TUTCI) [13], as well as the downscaling of the population density and the calculation of a severe heat impact on population (“mortality”) index – all at a 500 × 500 m2 spatial scale.
TMRT is calculated by applying a PLINIUS (CLARITY) simplified model, which is based on the SOLWAY model that was developed by Lindberg et al. [14], whereas the simplified TUTCI calculation was performed for a reference environment with a wind speed (va) of 0.5 m s-1 at 10 m height (approximately 0.3 m s-1 at 1.1 m), as defined by the International Society of Biometeorology Commission. Similar simplifications apply to calculation of the population distribution (exposure), whereas the vulnerability function, is based on mortality estimates from previous heat waves and the experiences of the medical experts that were consulted by PLINIUS. Similar simple models have also been developed for the flooding hazards.
Full details of the CLARITY models and their validation will be disclosed in a separate publication, but clearly, the models we use are extremely simplified, thus raising the question of validity of the results. Our initial tests have indeed shown that the mean radiant temperature provided by our screening model is higher than expected, resulting in an overestimate for the TUTCI as well. A closer analysis shows that CLARITY screening model produces the results that are comparable with those of SOLWAY but higher than those provided by e.g. Grasshopper and higher than suggested by available measurements.
On the other hand, the Figs. 8, 9, 10 and 11 clearly show that the models used provide plausible variations at a local scale. E.g., the temperatures are lower in the park area than in the city center; mortality scales with population density and heat index values; and mortality is higher in the “hotter” scenarios (rcp8.5, end of the century, rare events) than in the “colder” ones (historical and near-future data, lower RCP scenarios, yearly and occasional events).
Our working assumption is that the TMRT, which is calculated for the noon at the warmest day in the year is not representative for the TUCTI and mortality and needs to be scaled down to obtain more representative results. The calibration is currently performed against the Naples data and will be followed by validation in the Linz, Austria and Stockholm, Sweden, where the CLARITY expert studies are available. The details on the modeling used as well as the results of the calibration and validation will be published separately.
2.7 Adaptation Options
As indicated in the Sect. 1.3, the “local effect” models can be used both to calculate the variation of the hazard due to urban fabric and to calculate the effects of the adaptation options at the same scale. At a time of writing this article, we have defined several adaptation options that can be used in the screening study (Table 2) and implemented a simple mechanism for the administrators to indicate which adaptation options should be offered in a data package and for the end-users to indicate which adaptation options they wish to test in the screening study.
The initial values for the “effects” are a result of an offline study in the Naples area and haven’t been validated at other locations yet. That is, they may change in the future.
Fortunately, the adaptation options, including their effects and the data layers they are applicable to, are defined in the CSIS web integration platform and not hardcoded in the backend server. As a result, they can be easily reconfigured by the CSIS user with sufficient privileges, using the web interface and without any changes to the backend server.
2.8 The Future
CLARITY CSIS service is implemented as a “proof of concept” and its development will continue for another six months within the scope of the CLARITY project. Main planned developments include:
-
Adding support for the “flooding hazard screening” including the simple downscaling models, buildings exposure, flood vulnerability and damage indicators to the screening study.
-
Implementing the application workflow for assessing the effects of the adaptation options.
-
Implementing the “traffic infrastructure screening” study type, in addition to the “urban infrastructure” one.
-
Validating all the models used in the screening against sensor measurements and against the results of the (more accurate) model results from the CLARITY expert studies.
-
Improving and extending of the data visualisation methods. For example, the data views used by the table applications need to be redesigned and labels and units need to be added to the map legend(s). Furthermore, we plan to implement an application that will visualise the relevant indicator for the four time periods and the three RCP scenarios in one compact x-t graph.
-
Improving the application usability. For example, the application currently allows the user to define one combination of the time period, rcp scenario and the event frequency as a named “application present”. This preset is used in some parts of the workflow to decide what data needs to be visualised. In the future, this will be extended to allow the users to define several presets and supported by all the embedded applications.
3 Conclusion
At a time of writing this article (November 2019), the CSIS application is implemented at a “proof of concept”, the results appear plausible and the work on validation of the heat related indices is under way.
Once the features listed in Sect. 2.8 have been implemented, the CSIS service will turn into a very feature rich demonstrator that will allow the users to easily perform a two types of screening studies (urban and traffic infrastructure) for two key hazards (heat and flood), at least two elements at risk types (population and buildings in the urban infrastructure study type) and a limited number of adaptation option types in most of the Europe.
Apart from the uncertainties concerning the validation of the simple downscaling and impact models, the remaining implementation work is straightforward and the probability of not reaching these goals therefore considered very low.
Depending on the results of the model validation, two things can happen: either the simple models are found to be good enough for use with the EU-wide data package (as is or with additional tuning), or we will find out that they need to be configured and fine-tuned for use in a specific region. In both cases, the CSIS service could be relatively easily turned into a sustainable service offer that can provide the users with initial estimates of the future hazards and their impacts, as well as of the usability of the selected adaptation options.
Currently, we are looking for the partners interested in industrialization and exploitation of the project results. Early testers interested in the application are kindly asked to open a user account at the https://myclimateservices.eu/en platform and request a guided tour through the CSIS application or join one of the CSIS webinars.
Notes
- 1.
Actually 20, since a standard deviation layer is provided for each data layer, representing the variation between predictions by different climate models.
- 2.
In our service prototype, an “urban heat” screening calculation for an area of up to 500 km2 is finished in 15–20 min.
References
Delbeke, J., Vis, P.: EU Climate Policy Explained, European Union, Brussels (2016)
European Commission: An EU Strategy on adaptation to climate change, European Commission, Brussels (2013)
European Comission, Directorate-general Climate Action: Non-paper Guidelines for Project Managers: Making vulnerable investments climate resilient, European Comission, Brussels
Stocker, T.F., et al. (eds.): IPCC, Climate Change 2013: The Physical Science Basis. Contribution of Working Group I to the Fifth Assessment Report of the Intergovernmental, p. 1535. Cambridge University Press, Cambridge (2013)
Zuvela-Aloise, M. (ed.) CLARITY consortium: D3.1 Science support plan and concept. CLARITY, Vienna (2018)
Tomlinson, T.: Engineering drupal. In: Enterprise Drupal 8 Development For Advanced Projects and Large Development Teams, pp. 29–44. Apress, Berkeley (2017)
AIT Austrian Institute of Technology GmbH. EMIKAT – Emissionskataster (2019). http://www.emikat.at. Accessed 15 Nov 2019
Esbri, M.A., Havlik, D. (eds.): CLARITY consortium: D1.3 CLARITY CSIS V1. CLARITY, Vienna, Austria (2019)
Walsh, P., Pollock, R.: Data package. https://frictionlessdata.io/specs/data-package/. Accessed 15 Nov 2019
Sullice, G., Bosch, M.A., Leers, W., Tolboom, C.: JSON:API (2019) https://www.drupal.org/docs/8/modules/jsonapi. Accessed 15 Nov 2019
Esbri, M.A.: CLARITY Data Package Specification, Documentation and Examples (2019). https://github.com/clarity-h2020/data-package. Accessed 15 Nov 2019
COPERNICUS: Urban Atlas (2012). https://land.copernicus.eu/local/urban-atlas/urban-atlas-2012. Accessed 15 Nov 2019
Błażejczyk, K.: Mapping of UTCI in local scale (the case of Warsaw). Prace i Studia Geograficzne, WGSR UW, Nr. 47, 275–283 (2011)
Lindberg, F., Holmer, B., Thorsson, S.: SOLWEIG 1.0–Modelling spatial variations of 3D radiant fluxes and mean radiant temperature in complex urban settings. Int. J. Biometeorol. 7, 697–713 (2008)
Acknowledgement
This project has received funding from the European Union’s Horizon 2020 research and innovation programme under grant agreement n° 730335. The information and views set out in this publication are those of the author(s) and do not necessarily reflect the official opinion of the European Union.
Author information
Authors and Affiliations
Corresponding author
Editor information
Editors and Affiliations
Rights and permissions
Copyright information
© 2020 IFIP International Federation for Information Processing
About this paper

Cite this paper
Havlik, D., Schimak, G., Kaleta, P., Dihé, P., Leone, M.F. (2020). CLARITY Screening Service for Climate Hazards, Impacts and Effects of the Adaptation Options. In: Athanasiadis, I., Frysinger, S., Schimak, G., Knibbe, W. (eds) Environmental Software Systems. Data Science in Action. ISESS 2020. IFIP Advances in Information and Communication Technology, vol 554. Springer, Cham. https://doi.org/10.1007/978-3-030-39815-6_6
Download citation
DOI: https://doi.org/10.1007/978-3-030-39815-6_6
Published:
Publisher Name: Springer, Cham
Print ISBN: 978-3-030-39814-9
Online ISBN: 978-3-030-39815-6
eBook Packages: Computer ScienceComputer Science (R0)