
Abstract
Human migration, referring to people choosing to move not just because of a direct danger of persecution or death but also to improve their lives, is expected to grow rapidly in the near future. In this context, the recent Trans-Mediterranean region raised particular interest for the variety of migration routes and of institutional, social, cultural and economic issues. Further, the region is affected by many threats due to the interactions of climate change vulnerability, water scarcity and land degradation with the needs of increasingly urbanized populations and environmentally-intensive food production. The aim of this study is contributing to deepen the knowledge about the potential nexus among climate, geopolitics and migration across the Trans-Mediterranean region, through a comprehensive analysis, based on well consolidated and scientifically sound methods and data, about the climate-related hazards and their consequences on water and food availability. The findings suggest that the study region is increasingly facing a general warming and a decrease of water availability. The climate regime and hydrological cycle influence the agriculture, so that yields of the key energy and protein crops considered (wheat, maize, rice, soybean) seem highly endangered leading to an increase in irrigation needs posing additional pressures on the water sector. Building resilience for water resources and food production systems to climate change becomes thus crucial for the whole Trans-Mediterranean region. But while climate adaptation measures have to be implemented rapidly through agricultural practices, climate change mitigation cannot be neglected: in this context, the SDG agenda can provide robust foundations.
Access provided by Autonomous University of Puebla. Download chapter PDF
Keywords
1 Introduction
Today, 258 million people in the world live outside their country of birth, a figure that is expected to grow in the next period as a result of demographic growth, global connectivity, rising inequality and unemployment (UNDESA 2017). Human migration is defined by the International Organization for Migration as “the movement of a person or a group of persons, either across an international border, or within a State […] encompassing any kind of movement of people, whatever its length, composition and causes; it includes migration of refugees, displaced persons, economic migrants, and persons moving for other purposes, including family reunification”. As such it includes people choosing to move not just because of a direct danger of persecution or death, but also to improve their lives through better work, education, health or other reasons, as well as people whole livelihoods are directly threatened due to human or environmental conditions. It is a structural phenomenon in the world we live and it will be even more in the future to come. Against this context, the “Global Compact for Safe, Orderly and Regular Migration”, adopted in December 2018 by the majority of UN Member States (https://www.iom.int/global-compact-migration), represents the first global agreement in history that seeks to address migration with a common (although non-legally binding) approach based on 23 Principles.
This is especially of interest for the Trans-Mediterranean migration region, i.e. the one encompassing departure, transit and destination countries from Sub-Saharan Africa and Middle East to Europe. This region recently deserved attention at global level for the variety of migration routes as well as for a variety of institutional, social, cultural and economic issues affecting not only single countries internally but also international relationships and cooperation. The region faces significant environmental-related challenges due to the combination of climate change vulnerability, water scarcity, land degradation, coupled with increasingly urbanized populations that require environmentally-intensive food products as they experience a nutritional transition. For these reasons, more in-depth knowledge on how interacting geopolitics and environmental change interact and have an impact on the food system, in the present as well as in the future, can shed light on the extent to which these expected changes will act as drivers of human migration in the Trans-Mediterranean region.
The aim of this chapter is to investigate the potential nexus among climate, geopolitics and migration across the Trans-Mediterranean region. Such nexus is here analyzed focusing on countries of origin, transit and destination of Trans-Mediterranean migrations’ routes. Several key environmental (esp. climate change and its impacts) factors that influence resource (food and water) and socio-economic security, and thus the movement of individuals and populations, will be analyzed. A comprehensive spatially- and temporally-explicit analysis has been conducted about the exposure of the Trans-Mediterranean regions to climate hazards, namely atmospheric conditions, crop yield and water availability (proxies of food and water security, respectively) as observed along the historical period and expected for the future.
The chapter builds on the analyses conducted in the Report “Food and migration: Understanding the geopolitical nexus in the Euro-Mediterranean” (https://www.foodandmigration.com/) to deepen and consolidate the understanding on the above-mentioned nexus with a multidisciplinary approach that builds on environmental and social sciences.
In the following paragraphs, the background and rationale for the study is described, followed by the geographical domain, data and methods of analysis. The following section presents and discusses the results of the analysis, to finally draw key conclusions and recommendations.
2 Climate Change Assessments: An Overview
Many studies now recognize the link between climate change and human migration, due to the decline of ecosystem services, increasing constraints on natural resources, and associated socio-economic and geopolitical pressures under threatened environmental conditions (Piguet 2010). At the 21st Conference of Parties (COP 21) under the United Nations Framework Convention on Climate Change (UNFCCC), the Executive Committee requested the formation of a task force to develop recommendations on “integrated approaches to avert, minimize and address displacement related to the adverse impacts of climate change”.
Shortly before this important acknowledgement, the Intergovernmental Panel on Climate Change (IPCC), in its reports on “Managing the Risks of Extreme Events and Disasters to Advance Climate Change Adaptation” (IPCC 2012) and “Climate Change Impacts, Adaptation and Vulnerability” (IPCC 2014), stated that the vulnerability to climate change, including extreme events, is expected to become more and more heterogeneous across the globe in the future. The urgent need to tackle climate change with “rapid, far-reaching and unprecedented changes in all aspects of society” to limit global warming to 1.5 °C was also stressed in the Special Report on Global Warming of 1.5 °C released in October 2018 (IPCC 2018).
Many initiatives and projects attempted to quantify, based on available observational datasets, ensembles of climate to impact models, and synthesis statistics, the current to future vulnerability under climate change for the different countries and regions of the world.
As noteworthy example, the Notre Dame-Global Adaptation Index (ND-GAIN)Footnote 1 is a combination of over 74 variables into 45 core indicators to measure vulnerability and readiness for more than 180 UN countries from 1995 to the present. Vulnerability is intended as combination of exposure, sensitivity and adaptive capacityFootnote 2 with respect to climate change. More specifically, the exposure is the component associated to climate-related hazards and their physical impacts (among others, changes in cereals’ crop yield, water availability and variability). The readiness instead regards countries’ social, governance and economic ability to leverage investments for implementing climate adaptation actions.Footnote 3
Similarly, the joint World Food Programme and MetOffice initiative “Food Insecurity & Climate Change” (http://www.metoffice.gov.uk/food-insecurity-index/) focused on the Least Developed and Developing Countries of the World to investigate their vulnerability to suffer from climate change impacts in terms of food security, under current conditions and in the future. Based on the Hunger and Climate Vulnerability Index (HCVI) from Krishnamurthy et al. (2014), vulnerability was again calculated as combination of exposure (to climate-related hazards), sensitivity (of national agricultural production to climate-related hazards) and adaptive capacity (to cope with climate-related food shocks). The Food Insecurity was also projected for the medium-term (2050) and long-term (2080) time horizons in both cases revealing that, even under high adaptation and low emissions’ scenarios, food security is at risk of worsening in many countries of the world.
Food security depends on climate through impacts on water resources and agricultural production (via crop yield). It has been assessed that climate variability accounts for up to 60% of yield variability in many parts of the world (Ray et al. 2015) and it is thus a crucial factor for food stability. As example, meteorological droughts (lack of rain) often lead to hydrological and agricultural droughts (lack of water in surface to underground water bodies, and of moisture in the soil), so that the fulfillment of crop water requirement is at risk from both the rainfed and irrigation side (Ronco et al. 2017).
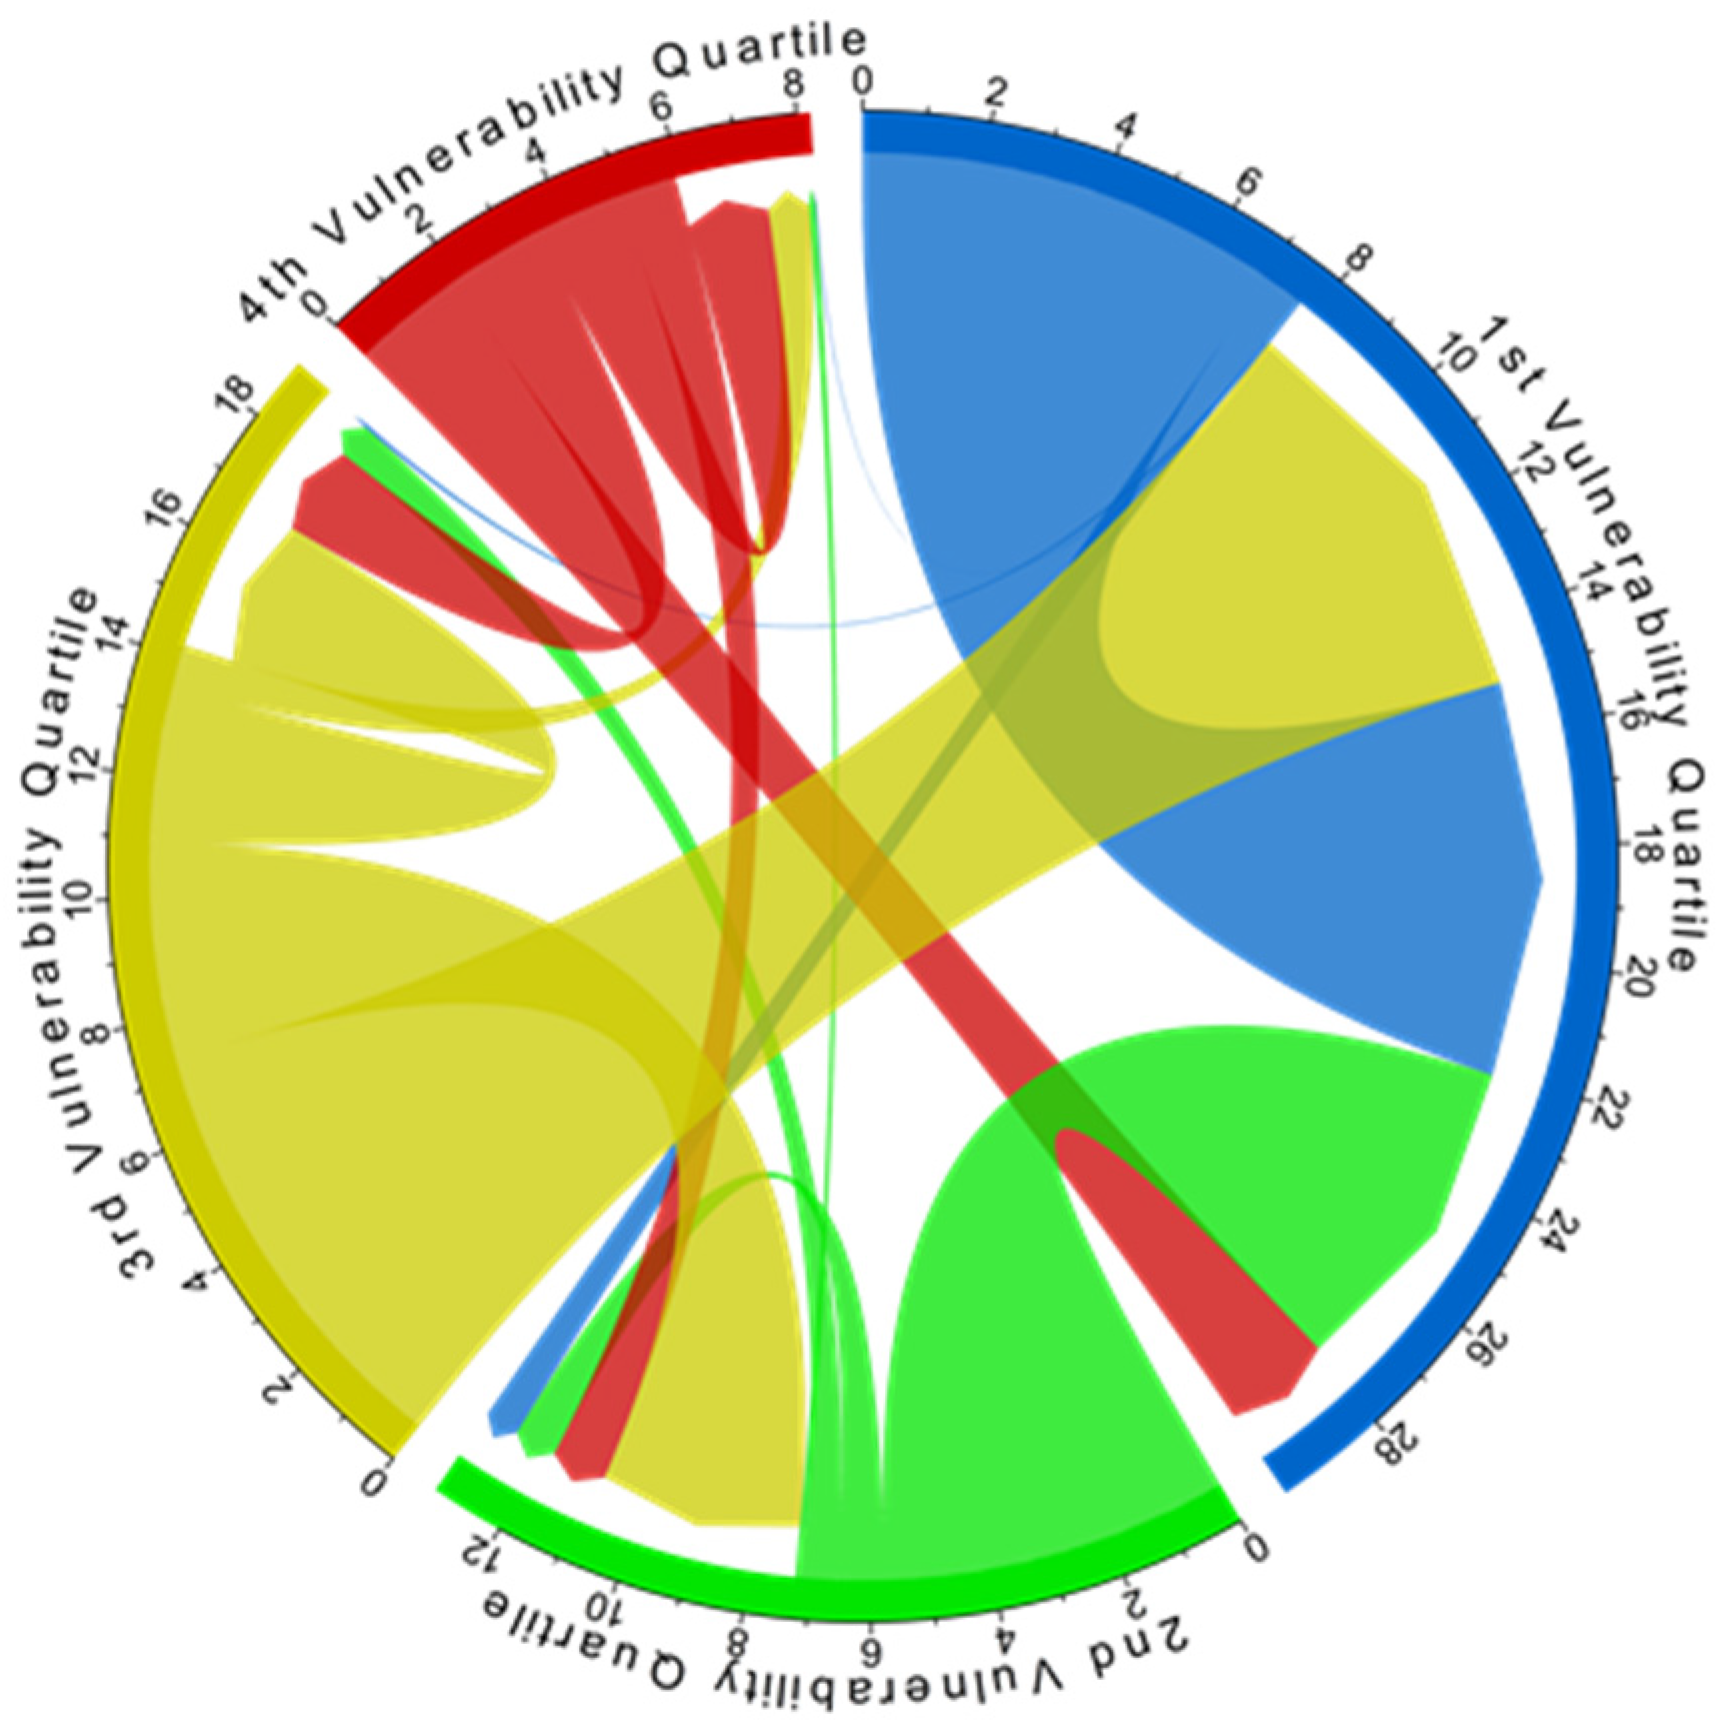
Climate change and its impacts thus are key determinant of present and future vulnerability to food insecurity in the countries of origin, transit and destination of migrants. In the context of increasing climate change vulnerability, especially in terms of resources—food, water and land—availability (Vörösmarty et al. 2000), the migration of individuals and communities from the most vulnerable areas becomes an important option, often the last chance, to adapt. The link between climate change and migration (both internal—e.g. from rural areas to cities—and international—from one country to another) was explored by Barrios et al. (2006), Marchiori et al. (2011), and Cai et al. (2016) looking at both rainfall and temperature variability. While one soon realizes that people tend to move from areas most exposed to climate shocks to less climate-vulnerable areas, as also shown by Grecequet et al. (2017), climate anomalies seem however driving migration more from middle income countries, while populations locked in deep and persistent poverty (low income countries) are constrained (“trapped”) by lack of economic resources to migrate (Cattaneo and Peri 2016; Grecequet et al. 2017) (see e.g. Fig. 1).

Bilateral migration flows between and within climate vulnerability quartiles: 2010–2015. Quartiles from first to fourth represent increasing vulnerability to climate change. Numbers and tick marks on periphery are counts of out- and in-migrants in units of millions. Migration flows and directions are represented by arrowed cords. (Source: Fig. 6. Grecequet et al. 2017; http://www.mdpi.com/sustainability/sustainability-09-00720/article_deploy/html/images/sustainability-09-00720-g006.png; caption modified)
Moreover, it is necessary to differentiate between migration caused by slow-onset climate-related events, such as droughts and land degradation, and those caused by fast-onset events, such as floods, storms, tsunamis or fires. While the former is usually voluntary, economically motivated, gradual and almost definitive; the latter is involuntary, rapid and tends to be temporary and reversible (Brzoska and Fröhlich 2016).
Additionally, as the latest World Food Programme report clearly shows, there is a particularly strong link between migrations, food and conflicts: refugee outflows per 1000 population increase by 0.4% for each additional year of conflict, and by 1.9% for each percentage increase of food insecurity, while “higher levels of undernourishment contribute to the occurrence and intensity of armed conflict” (World Food Programme 2017).
However, the clear relationships between climate trends, or their extremes, and conflicts driven by scarcity of essential resources, which are supposed to induce migrations, are still uncertain (Brzoska and Fröhlich 2016). Conflicts are not only direct drivers of climate-related migrations because of resources scarcity, but they can be also a consequence of climate vulnerability and increased competition for natural resources (Hsiang et al. 2013). Extreme climate events, such as recurrent floods but especially prolonged droughts and irreversible land degradation, may intensify the process of displacements and out-migration to a point that fast and large waves of migrants are not smoothly absorbed in destination countries, and this can ultimately produce security risks and make conflicts more likely in those receiving regions with a lack of stable structures and institutions to prevent or mitigate migration-induced resource scarcity. This condition can be exacerbated by ethnic tensions, distrust and demolition of social capital (Reuveny 2007). Further, Ghimire et al. (2015) found for example that displacement of people due to floods is not a cause of new conflicts but rather contributes to prolong existing conflicts all around the World. This is even truer when the high vulnerability to climate change coincides with other drivers, such as ethnic polarization, weak political structures and low levels of economic development (Brzoska and Fröhlich 2016).
3 The Trans-Mediterranean Migration Routes
To seize the importance of the challenge linked to migration, resources and climate, one should never dismiss the geopolitical context that conditions it. From this perspective, in fact, the Trans-Mediterranean region represents a critical juncture of two neighboring worlds defined as much by current asymmetries, as well as by their long-standing economic, political and socio-cultural linkages.
For what concerns Europe, frictions, potential conflicts and persistent migratory flows are having a significant impact on its culture and identity. This pattern is set to endure especially if the Old Continent will continue to highlight a visible lack of trust in its institutions and even in the possibility of a common approach to common challenges. In the meantime, Africa and the South-East Mediterranean countries are struggling with the greatest instability factors of our times, such as wars, terrorism, widespread poverty and the consequences of climate change on agriculture and food, which undermines their chances of economic and social development.
Within this picture, migration flows have become factors of interdependence between the two shores of the Mediterranean (Fig. 2). As recent experience shows, they can be sealed for some time but not forever, as they are capable of reacting promptly to political and economic shifts occurring in the countries of origin, transit and destination.

Major migration routes over the Trans-Mediterranean region. Source: Report “Food and migration: Understanding the geopolitical nexus in the Euro-Mediterranean” (https://www.foodandmigration.com/)
Paradigmatic, in this sense, the resumption of the migration route from Morocco to Spain in 2018, which has surpassed the Central Mediterranean route as the principal transit corridor for African migrants eager to reach Europe.
In the early 2000s, the prominent role of Spain as one of the main entry points of migrants to Europe contributed to consolidating the so-called West Mediterranean and the Atlantic routes. The popularity of this route peaked in 2006, when approximately 32,000 migrants landed in Spain, most notably from West Africa. However, the entry into force of bilateral agreements between the governments of Spain, Senegal and Mauritania contributed to considerably reducing these flows. In 2016, 10,631 attempts of illegal border crossing were detected between Spain and Morocco (mainly through the Spanish enclaves of Ceuta and Melilla in Africa), while entries via the Atlantic route were just 671.
Meanwhile, the popularity of the Central Mediterranean Route began to grow considerably, until it skyrocketed following the collapse of the Ghaddafi regime in Libya (2011) and the failure of the subsequent state-building process. With its branches drawing deeply into sub-Saharan Africa, this route prompted an unprecedented upsurge of arrivals by sea in Italy: from about 43,000 in 2013, to 170,100 in 2014, 153,842 in 2015, 181,436 in 2016, and 119,369 in 2017 (UNHCR Italy data portalFootnote 4). Nigeria and Eritrea were the most represented countries of origin. It was the natural consequence of the absence of any unitary authority in Libya, which greatly favored the role of the North-African country as a transit corridor for the flows directed towards Europe, whose push factors were the most disparate. From the presence of authoritarian regimes and systematic human rights abuses in countries of origin such as Eritrea and Gambia, to the state collapse and widespread insecurity in Somalia or the impact of the economic crisis in Nigeria.
The picture has started to change once again since mid-summer 2017, when volumes of migration through the Central Mediterranean shrank abruptly. This was widely seen as the result of the co-option of Libyan militias into anti-smuggling efforts prompted by the Italian and other European Union (EU) governments, the first interception of migrants at sea by the revamped Coast Guard of Tripoli and the agreements reached with other transit countries, such as Niger. The same mechanism had already been adopted with Syrian, Afghan and Iraqi refugees who had entered Europe from Turkey until March 2016. Still, ongoing-armed clashes in key transit nodes in the Sahel region and the presence of consolidated smuggling networks suggest that also this scheme might be much more volatile than it appears, with new transit-Mediterranean routes being carved out promptly, including from Tunisia, Algeria and Egypt.
During the first 10 months of 2018, for instance, migrants landed on the Italian coast were only 21,935 (Italian Ministry of Interior, Department for civil liberties and immigrationFootnote 5), while in the same period Spain experienced the arrival of 43,519 migrants by sea, up from the 28,349 landed altogether last year (UNHCR Spain data portalFootnote 6). The resumption of the Western Mediterranean route is therefore remaking Spain the first European country by number of migrant arrivals almost 20 years after the establishment of the Western route, with Madrid dealing with a very mixed humanity made of people from sub-Saharan Africa (Guinea, Mali, Ivory Coast), the Maghreb (Morocco, Algeria), and even the Middle East (Syria, Iraq).
Overall, the current management of migratory flows amounts to a veritable time bomb (Raineri 2018). Current trends suggest that sub-Saharan Africa is trapped in a Malthusian vicious circle, where poverty nourishes hunger, malnutrition and high infant mortality which, coupled with high fertility, imply a high rate of growth that generates even more poverty (Livi Bacci 2018). The high number of variables at play makes it hard to come out with reliable forecasts, and obliges one to draw on existing trends and likely scenarios. Within this context, climate change remains an important factor to assess the vulnerability of countries of origin, transit and destination of migrants.
Because the climate-geopolitics-migration nexus is both complex and spatially heterogeneous across the Trans-Mediterranean region, and it depends profoundly on the differential vulnerability of places and populations, it becomes essential improving the knowledge about the likely association between the resources’ exposure and (eco)systems’ sensitivity to climate change hazards, which potentially contributes to worsening migrations and/or conflicts in all the interested countries (origin, transit, destination).
4 Data and Methods
4.1 Geographical Context
The analyses developed in this chapter are concentrated on the Trans-Mediterranean region of migrations, encompassing the Mediterranean basin and part of its bordering continents (Central to South Europe, South-West Asia and Africa). As described above, this area recently deserved particular attention due to the people involved and issues triggered: institutional incapacity and divergences, human rights, cultural diversities, social instabilities and conflicts, employment conducts, poverty and health problems. Moreover, also the spatio-temporal variability of routes makes this region particularly interesting: African migratory routes, which often follow the ancient transit roads used for trade of every kind, starting with food and the other natural products, evolve constantly due to the changing intensity of push and pull factors, as well as the enforcement policies of local governments, which are effectively subsidized by some European countries.
The spatial domain of the analysis has been set to cover five regions, each comprising several countries, in some cases grouped for the successive discussion so to consistently address changes and re-arrangements of boundaries occurred over time (e.g. Sudan,Footnote 7 Former Yugoslav Republic). The regions and countries analyzed are (in alphabetical order)Footnote 8 (Fig. 3):
-
Central Europe (CE): Austria, Belgium, Luxembourg, France, Germany, Netherlands, Switzerland.
-
Mediterranean Europe (MedE): Albania, Bosnia and Herzegovina, Bulgaria, Croatia, Cyprus, Greece, Italy, Kosovo, Macedonia, Malta, Montenegro, Portugal, Romania, Serbia, Slovenia, Spain.
-
Middle East (ME): Armenia, Azerbaijan, Bahrain, Georgia, Iraq, Israel, Jordan, Kuwait, Lebanon, Oman, Qatar, Saudi Arabia, Syrian Arab Republic, Turkey, United Arab Emirates, Yemen.
-
North Africa (NA): Algeria, Egypt, Libya, Morocco, South Sudan, Sudan, Tunisia, Western Sahara.
-
West Africa (WA): Benin, Burkina Faso, Gambia, Ghana, Guinea, Guinea-Bissau, Ivory Coast, Liberia, Mali, Mauritania, Niger, Nigeria, Senegal, Sierra Leone, Togo.

Map of the domain, regions and countries
On the agricultural side, the analysis from the regional level was also focused to the 13 major players above reported in bold.
From a quick scan of the domain considering the ND-GAIN approach mentioned in Sect. 2, it seems that combining vulnerability to climate change hazards and other global challenges (such as, food, water, health, ecosystem services, human habitat and infrastructure) with the readiness to build climate change resilience, the average index is greater (worse) for the Trans-Mediterranean region than for the globe (50 vs. 48). Looking at Fig. 4, referring to the year 2016, more than 30% of the countries in the domain fall in the category “high vulnerability and low readiness” (red triangles; mostly Africa and Middle East countries), while another 13% have or high vulnerability (blue rhombus) or low readiness (yellow squares) but they are counterbalanced by their high readiness or low vulnerability, respectively. The northernmost countries of the domain in general have low vulnerability and high readiness (green circles).

Classification of Vulnerability and Readiness of countries according to the ND-GAIN approach. Colored symbols represent different degrees (low vs. high) of vulnerability (ordinate) and readiness (abscissa), within quadrants distinguished in function of the median values of Vulnerability and Readiness calculated across all the years (black horizontal and vertical line, respectively). Grey symbols are all other world’s countries not considered in the study. (Elaborated from http://gain.nd.edu/our-work/country-index/matrix/)
Based on the previously mentioned “Food Insecurity & Climate Change” initiative, the Table 1 reports the percent changes (positive = increase; negative = decrease) of food insecurity expected for those countries matching with our study domain. Among the different combination among emission level (low, intermediate, high) and adaptation degree (high, low, none) and time frames (2050 and 2080), we selected the two extremes. A general increase in food insecurity is expected, especially in the long-term scenario with high emissions and low adaptation.
4.2 Methods and Data for the Historical and Future Analysis
For a comprehensive analysis of the climate-water-food vulnerability across the Trans-Mediterranean region, first average (observed and projected) trends of precipitation and temperature are analyzed. Then, water resources are addressed in terms of average trends of the superficial water cycle component (runoff) and food security is analyzed by looking at agricultural yield variability for selected crops.
4.2.1 Climate
Concerning the historical climate analysis, the most consolidated and freely accessible data were considered about two atmospheric variables: precipitation and 2-m air temperature (simply “temperature” hereafter). Spatially interpolated (gridded) observational time series on these variables were available through the Climate Research Unit (CRU) dataset TS v4.0, at 0.5° × 0.5° resolution (ca. 50 km × 50 km) and with a monthly time step from 1901 to 2015 (https://crudata.uea.ac.uk/cru/data/hrg/; Harris et al. 2014). While the spatial resolution is largely valuable for global to sub-continental scale studies, the monthly resolution speed-up the investigation of intra-annual and inter-annual trends.
Concerning the future climate analysis, the model experiments from the phase 5 of the Coupled Model Intercomparison Project (CMIP5) (Taylor et al. 2012) were first considered. However, impact studies rarely use climate model outputs directly because they exhibit systematic error (i.e. bias) resulting from sub-grid scale parameterizations, simplified physics and/or incomplete knowledge of climate system processes (Cannon 2016; Sippel et al. 2016). Hence, the data obtained after applying a bias-correction method (Hempel et al. 2013) developed within the Inter-Sectoral Impact Model Intercomparison Project (ISI-MIP Fast-Track) were used. For 5 out of 6 Earth System Models (ESMs) considered here, data are available publicly and were downloaded via the ESGF server (https://esg.pik-potsdam.de/search/isimip-ft/); while in case of the CMCC-ESM,Footnote 9 the above-mentioned bias-correction method was implemented over raw data. A multi-model ensemble approach was then adopted, relying on the fact that multi-model average often out-performs any individual model compared to observations. To isolate the impact of different socio-economic scenarios on climate, two different Representative Concentration Pathways (RCPs) were selected: the RCP 4.5 and RCP 8.5 (Van Vuuren et al. 2011). The RCP 4.5 stabilizes radiative forcing at 4.5 Wm−2 in the year 2100 without ever exceeding that value, while the RCP 8.5 predicts a rising of the radiative forcing pathway leading to 8.5 Wm−2 top-of-atmosphere forcing by 2100.
Two main climate indicators were calculated from observed and projected monthly series, the Annual Mean Temperature (MAT, °C) and the Annual Precipitation Amount (APA, mm/year). For the historical period, they were computed for each year from 1951 to 2015. From them, trends of MAT (°C/year) and APA (mm/year) were also calculated and averaged at macro-regional and country level for the periods 1951–2015, 1971–1990 and 1995–2014. Finally, anomalies were quantified and again averaged at macro-regional and country level for the future periods 2016–2035 (centered on 2025) and 2041–2060 (centered on 2050) vs. the recent period 1996–2015 (centered on 2005).
4.2.2 Water Resources
Globally, water resources are highly shared among different human and natural sectors and systems. First of all, water is used by agriculture to cover Crop Water Requirements (CWRs). Even if such water needs are satisfied thanks to precipitation, especially in case of rainfed agriculture, many cultivations need additional water if and when rainfall is not enough to cover CWRs; thus, water is withdrawn for irrigation from superficial and underground sources. Under global changes, an increase of irrigation is largely projected with impacts on the whole water resource sector (Mancosu et al. 2015). Further, as meteorological droughts often lead to hydrological and agricultural droughts (lack of water in superficial to underground water bodies, and of moisture in the soil), the fulfillment of CWR is at risk from both the rainfed and irrigation side (Ronco et al. 2017).
As a comprehensive view, Fig. 5 shows the levels and types of water scarcity at the basin level assessed in 2007, showing that the dimensions of water resource scarcity are not only physical but also economic (thus relating to the capacity to deploy the water resource available locally due to socio-economic-institutional constraints).

Water scarcity levels in 2007. “Little or no water scarcity” means that less than 25% of water are withdrawn from rivers for human purposes. “Physical water scarcity” indicates that more than 75% of river flows are withdrawn for human uses (agriculture, industry, energy, domestic purposes). “Approaching physical water scarcity” means that more than 60% of river flows are withdrawn and thus these basins will experience physical water scarcity in the near future. “Economic water scarcity” indicates that, although less than 25% of water from rivers withdrawn for human purposes, malnutrition exists. (Source: figure as modified in Mancosu et al. (2015) from IWMI 2007)
This is why attention was given, in this chapter, also to the observed and projected changes in water availability, as proxy of water security in the Trans-Mediterranean region. In this sense, reanalysis datasets are valuable to provide runoff data at daily scale to assess likely changes on surface water availability, which is then drained along the river network. Reanalyses are observationally constrained model outputs, i.e. meteorological station measured variables are directly assimilated in the global circulation models, so that gridded products can be assumed representative of real conditions even in areas not covered by stations. Given the importance of the land component in the hydrological cycle, mainly in terms of topographic characteristics, the reanalysis dataset offering the finest spatial resolution (0.75° lat × 0.75° lon) at the time of the analysis (ERA-Interim; https://www.ecmwf.int/en/research/climate-reanalysis/era-interim) was selected for this study, with data available from 1979 to 2015.
For the future, changes in water availability will depend on changes in the volume, variability and seasonality of runoff (IPCC 2013). To this aim, runoff projections from four hydrological models participating to the ISI-MIP Fast-Track experiment (MPI-HM, WaterGAP, H08 and PCR-GLOBWB; https://www.isimip.org/impactmodels/), forced with five bias-corrected ESMs data under the RCPs 4.5 and 8.5, have been analyzed.
Moreover, to take into consideration the impact of human activities, projections derived from naturalized streamflow characterized by absence of water use vs. simulations used to quantify anthropogenic pressures on water resources under current socio-economic conditions were considered.
As indicator, the mean annual runoff (MAR) was first computed for each year from 1979 to 2015. After creating an ensemble by averaging across both ESMs and hydrological models, historical trends of MAR (mm/year) were calculated and averaged at macro-regional and country level for the whole period. Then, also the anomalies in MAR (mm/year) were calculated and averaged at macro-regional and country level for the future time frames considered (2016–2025 and 2041–2060) vs. the reference period 1996–2015.
4.2.3 Agriculture
Agriculture is arguably the sector most affected by climate change (Rosenzweig et al. 2014): changes in temperature, atmospheric carbon dioxide (CO2), and the frequency and intensity of extreme weather could have significant impacts on crop yields. Dealing with drought episodes could become a challenge in areas where rising summer temperatures cause soils to become drier. Although increased irrigation might be possible in some places, in other places water supplies may also be reduced, leaving less water available for irrigation when more is needed (Evans and Sadler 2008).
For that concerning the analysis in agricultural production, as proxy of food security, the extensive and continuously updated FAOSTAT database (http://www.fao.org/faostat/en/#home) allows accessing data on several agriculture-related topics like primary crop production and yield (production over harvested area). Yield data for all the countries consideredFootnote 10 for four crops, of which three cereal (maize, rice, wheat) and one leguminous/oil (soybean) crops. These crops were selected as a good compromise among several considerations:
-
They account for a significant share of the world’s agricultural production as well as in the study domain, within the macro-categories of cereals and leguminous/oil crops;
-
They are important in covering both energy (maize, wheat) and protein (rice, soybean) supply from a nutritional point of view;
-
They play a role in the food-feed-energy debate as they are used to feed livestock (Di Paola et al. 2017) and for biofuel production.
-
There are available scientifically sound experiments and comprehensive datasets on future projections of yields for these crops.
According to the temporal coverage of crop production data, first the trends of yields were assessed from 1961 to 2014 and then for two 20-years periods 1971–1990 and 1995–2014, trying to identify a sort of variability in yield that could be related to shorter term (e.g. annual) climate variability, in particular looking at the occurrence of drought episodes, as established from literature and with focus on those countries designated as major players.
Impacts of future climate change on crop productivity were then calculated using global yield projections for the four above crops building on the results from the pDSSAT and the LPJmL crop models participating to the ISI-MIP Fast-Track initiative, driven by the same five ESMs and under both the RCP 4.5 and 8.5 used for the analysis on water resources. For each crop, both a full irrigation scenario (“irr”) and a no-irrigation scenario (“no irr”) were considered.
Results are provided in terms of crop yield anomalies aggregated at country and macro-regional levels for the future time frames considered (2016–2025 and 2041–2060) vs. the reference period 1996–2015.
5 Results
The main outcomes of the analysis suggest that, during recent decades, while warming appears rather homogeneous, wetting and drying trends are more fluctuating although finally leading to a clear decrease of water availability in the Trans-Mediterranean region, contrasting with the global increase. In this context, even if agricultural production showed consistent yield increase on the longer term for the four crops analyzed (wheat, maize, soybean, rice), such increasing trends are lost, or however lose significance, if considering shorter time frames: this suggests a rising influence on crop yields of inter-annual climate variability.
Concerning the future, besides a temperature anomaly predicted to increase homogeneously (up to 1.44 ÷ 2.14 °C in the period 2041–2060) and in line with global trends, a slight increasing or even decreasing trend of rainfall (ranging from +0.5% to −1%) is predicted according to the different emission scenarios and periods considered. This is opposite to the increase by ~1% and ~4% that is expected in the near future (2016–2035) and far future (2041–2060), respectively, at the global level. Results about precipitation anomaly are well reflected in the hydrological cycle, suggesting that the study region will face a general decrease of water availability, with an expected drying from 2 to 7% in terms of drop in mean annual runoff generation.
In case of both rainfed and irrigated agriculture, the yields of the key energy and protein crops considered are threatened by the combination of new climate and water resources’ regimes, with the increase in irrigation needs that will pose additional competition on the share of water resources among different sectors as well as impact on water availability in adjacent countries.
In the following paragraphs the main results concerning the climate dynamics and the likely impacts on water resources and agriculture are described more in detail.
5.1 Climate
The trend in Mean Annual Temperature (MAT) from 1951 to 2015 was 0.022 °C/year on average across the full domain (in line with the global tendency) and rather homogeneous across the region. Looking at the shorter 20-year periods, the warming trend was higher (0.040 °C/year, even higher than the global trend of 0.033 °C/year) during 1971–1990 in the south-westernmost side of the domain. Along the 1995–2014 period, the warming trend in the region was around 0.029 °C/year, slightly higher than the global trend of 0.026 °C/year, and more accentuated in the eastern side of the domain.
The trend of changes in Annual Precipitation Amount (APA) along 1951–2015 was −0.55 mm/year on average across the full domain, and +0.16 mm/year as global average, reflecting not only an opposite direction but also a stronger magnitude of modifications in the study region. Looking at the shorter time horizons, the drying trend in the area was stronger along 1971–1990 (−1.27 mm/year, even higher than the global trend of −1.03 mm/year), while during 1995–2014, a wetting trend dominated for around 0.36 mm/year, however lower than the global trend of 0.48 mm/year.
Figure 6 shows the spatial variability, among countries, in MAT and APA trends along 1951–2015.

Trends in MAT (°C/year) (top) and APA (mm/year) (bottom) for the period 1951–2015
By processing the CMIP5 bias-corrected simulations, results for the future period suggest across the Trans-Mediterranean region a spatially homogeneous warming. A substantial warming (by 0.61 ÷ 0.77 °C according to the different emission scenarios considered) might affect the region in the short-term period 2016–2035 compared to the reference period 1996–2015. The temperature is predicted to increase homogeneously (by 1.44 ÷ 2.14 °C) in the farthest period considered 2041–2060, with a warming peak in the Middle East sub-region (+2.32 °C).
The annual rainfall at global level is predicted to increase by ~1% (~9 mm) in the near future (2016–2035) and by ~4% (~30 mm) in the far future (2041–2060) while a weaker wetting up to a drying (ranging from +0.5% to −1%) is predicted in the Trans-Mediterranean region, function of the different emission scenarios and periods considered. At the sub-regional level, the Mediterranean Europe and the Middle East are expected to experience the strongest rainfall decrease (~7.1% corresponding to 57 mm and ~7.4% corresponding to 18 mm, respectively) according to the RCP 8.5 scenario for the far future period 2041–2060. In contrast, the annual precipitation over West Africa is predicted to increase for about 1.5 ÷ 2.4% (equal to a gain of ~10 ÷ 16 mm) in the near future, and this wetting is confirmed when analyzing the far future with an average (between RCPs) precipitation gain of more than 5% on average between RCPs. Table 2 reports the expected future anomalies (per RCP scenario and time frame) at global, regional and macro-regional level.
5.2 Water Resources
Across the globe, an overall increasing trend of the mean annual runoff (MAR) was observed, around 0.6 mm/year, while in the Trans-Mediterranean region a much higher decrease (2 mm/year) was registered. This reflects what observed for precipitation (APA) on the longest period analyzed (1951–2015). Figure 7 shows the country average of MAR trends, with Sub-Saharan Africa and almost half of non-African Countries suffering from a decrease in runoff larger than 1 mm/year (red tones).

Country average of trends in MAR (mm/year) along the period 1979–2015
The analysis on future projections (Table 3) show that the Trans-Mediterranean region is expected to dry in terms of mean annual runoff (MAR) generation over land. Such drying is more marked in the Mediterranean Europe, Middle East and North Africa with a decrease ranging from 14 to 18% in 2041–2060 vs. 1996–2015, under the RCP 8.5. Again, the globe and the whole study domain have an opposite behavior, wetting the former and drying the latter (results not shown).
5.3 Agriculture
Annual trends in yield changes, and related significance, for the four crops selected (wheat, maize, rice, soybean) are shown in Table 4 for “major player” countries.
On the shorter to inter-annual time frame, a long-lasting positive impact of technological development (positive trends) can leave the floor to the influence of climate variability (negative trends). This was confirmed by comparing the peaks of yield losses with the occurrence of isolated episodes or prolonged periods of drought as reported in literature (Spinoni et al. 2015; De Pauw 2005; Masih et al. 2014). For example, in Spain, peaks of negative wheat yield anomaly match with droughts conditions in 1981, 1995, 2005 and 2012. For Italy, a long period of negative wheat yield anomaly occurred from 1997 to 2003, classified as a long and severe drought period. From 2000 to 2012, in general, higher drought frequency and duration were found in France and Italy, and FAOSTAT data revealed along this period half and two-thirds of years with negative yield anomalies of maize for France and Italy, respectively, and also of soybean for Italy. Concerning Germany, losses in wheat and maize yield occurred around 1976 and 2003, both classified as drought periods.
A drought period was detected in Turkey along 1999–2000, when cereal production fell by 6% if compared to the 5-year average (De Pauw 2005).
In the same 1999, cereal crop was reduced to 8 Mtons (−31% of the previous year) across Morocco, Algeria and Tunisia; the 2000 harvest was also below normal. Still in Morocco, approximately 1 Mha of cropland was affected by drought in 2001, forcing the country to import approximately 5 Mtons of wheat and allocate more than $500 million for cereal imports (FAO 2004). Other important events for Morocco were detected in 1994–1995, with the production of cereals dropping from 9.5 to 1.6 Mtons, and in 2006–2007, with production of cereals reaching only half of the normal level. According to Masih et al. (2014), Algeria was instead affected by an extended drought in 1983–1984 and to a less extent in 1972–1973, both seasons corresponding to negative anomalies in cereal yield.
Concerning West Africa, Masih et al. (2014) describe extended droughts during 1972–1973, 1983–1984 and 1991–1992: from FAOSTAT, negative maize yield anomalies occurred in key West African countries in the same periods, except in Burkina Faso in 1991–1992.
In Nigeria and Egypt, key producers of rice, related yields were affected by droughts in 1972–1973 and 1983–1984, still according to Masih et al. (2014). Similarly, the largest producer for soybean, Nigeria, experienced loss of yield during extended drought in 1983–1984 and 1991–1992.
In the future (Table 5), the regional scenarios of maize yield analyzed for the present work show a general decrease, the strongest one (12 ÷ 13%) projected for West Africa in the far future as average between RCPs and regardless if using or not irrigation. For Mediterranean Europe and secondarily for Central Europe, losses of maize yield (up to −7% in the far future for Mediterranean Europe) can be avoided, switching to increase only if irrigation is applied, thus strengthening the competition over diminishing water resources.
The future scenarios for wheat yield are driven by losses in West Africa (up to −26%), North Africa (−21%) and Middle East (−10%) in the far future without using irrigation. Even considering the irrigation scenario the anomalies in wheat production show a similar pattern for African countries, with a substantial decrease up to 18%, 14% and 11% in West Africa, North Africa and Middle East, respectively, along the far future scenario.
Soy cultivation, key also for climate mitigation strategies due to the production of biofuels, seems experiencing an overall decrease of yield across all the Trans-Mediterranean domain (up to 17% in the worst scenario—and under irrigation—for West Africa) while a significant increase is projected over Central Europe (well higher when irrigating) and a slight rising for the Mediterranean Europe (but only in case of using irrigation). This suggests the key role of water to maintain agricultural production.
Concerning rice yield, the Central and Mediterranean Europe should increase the productivity for around 39% and 12%, respectively, of historical yield under irrigation (lower yields in case of no irrigation have slightly lower increase), while the West Africa will experience the most pronounced decrease (around 11 ÷ 12%, regardless of irrigation).
6 Conclusions and Recommendations
The present study provides an overview of the likely climate change impacts on the past, present and future food security conditions that, combined with the geopolitical context of the Trans-Mediterranean area, can act as potential drivers of human migration across the region.
Take home messages of the analysis are that it is not only the area of origin and transit of Trans-Mediterranean migrations (African countries and Middle East) that will be increasingly affected by climate change hazards impacting on water and food systems, but also the (destination) European countries. This scenario constitutes not only a risk but also an opportunity for food production in the northern portion of the domain, as the modified climate conditions have the potential to increase suitability for new or currently minor cultivations around the Mediterranean basin. The southern Mediterranean countries will experience a decline in productivity for all crops analyzed if adaptation measures to climate change are not put in place rapidly. Adaptation includes a set of measures, at the international, national and community level. As shown in Dinesh (2016), finance, economic incentives, value chain initiatives (such as certification schemes and networks), national and local planning are critical for climate change adaptation and bring a number of societal co-benefits. Adaptation measures can also strengthen gender equality and social inclusion, especially for youth, and can be strengthen by indigenous knowledge to guide climate action by framing solutions based on local cultures.
Building resilience to climate change becomes crucial for the whole Trans-Mediterranean region. This also includes the development and implementation of climate change mitigation options, including change in diets to counteract the nutrition transition that the Mediterranean countries are experiencing and that involves a shift towards increased demand for animal-based foods, and processed foods rich in salt, sugar and fats. Climate action as well as food system transformation is critical for implementing the 2030 Agenda and achieving its 17 Sustainable Development Goals (SDGs),Footnote 11 adopted by 193 world leaders in September 2015 at an historic UN summit. The SDGs represent a universal framework of action for all countries, across different territorial scales, to end all forms of poverty, fight inequalities and tackle climate change, while ensuring that no one is left behind. The SDGs already provide robust foundations for the development of climate change adaptation and mitigation strategies. However, the synergies among SDGs remain rather unexplored. The SDG 13 (Climate Action) is focused on mitigation of climate and its impacts, without considering migration dynamics in the policies to be formulated. From the other side, the SDGs 8 (Decent Work and Economic Growth), 10 (Reduce Inequalities) and 17 (Partnership for the Goals) mention the necessity to well plan and manage migration policies, without mentioning the challenges that climate change can bring on them.
Last but not least, when looking for climate change adaptation strategies and actions, since the range of likely future developments for the interacting human and natural systems is wide, a robust decision making should not neglect the consideration of the uncertainty, e.g. looking for options and solutions promising to perform well under as many scenarios as possible.
Notes
- 1.
- 2.
Exposure: The extent to which human society and its supporting sectors are stressed by the future changing climate conditions. Exposure captures the physical factors external to the system that contribute to vulnerability.
Sensitivity: The degree to which people and the sectors they depend upon are affected by climate related perturbations. The factors increasing sensitivity include the degree of dependency on sectors that are climate-sensitive and proportion of populations sensitive to climate hazard due to factors such as topography and demography.
Adaptive capacity: The ability of society and its supporting sectors to adjust to reduce potential damage and to respond to the negative consequences of climate events. Adaptive capacity indicators seek to capture a collection of means, readily deployable to deal with sector-specific climate change impacts.
- 3.
Economic Readiness: The investment capability that facilitates mobilizing capitals from private sector.
Governance Readiness: The stability of the society and institutional arrangements that contribute to the investment risks. In a stable country with high governance capacity investors are assured that the invested capitals could grow under the help of responsive public services and without significant interruption.
Social readiness: Social conditions that help society to make efficient and equitable use of investment and yield more benefit from the investment.
- 4.
- 5.
- 6.
- 7.
South Sudan was comprised because country level data are available for the former Sudan according to the time period analysed.
- 8.
Excluded: Liechtenstein, Andorra, Gibraltar, San Marino, Vatican City because of their limited surface area.
- 9.
- 10.
No data for Bahrain is available in FAOSTAT.
- 11.
References
Barrios, S., Bertinelli, L., & Strobl, E. (2006). Climatic change and rural–urban migration: The case of sub-Saharan Africa. Journal of Urban Economics, 60(3), 357–371.
Brzoska, M., & Fröhlich, C. (2016). Climate change, migration and violent conflict: Vulnerabilities, pathways and adaptation strategies. Migration and Development, 5(2), 190–210. https://doi.org/10.1080/21632324.2015.1022973.
Cai, R., Feng, S., Oppenheimer, M., & Pytlikova, M. (2016). Climate variability and international migration: The importance of the agricultural linkage. Journal of Environmental Economics and Management, 79, 135–151. https://doi.org/10.1016/j.jeem.2016.06.005.
Cannon, A. J. (2016). Multivariate bias correction of climate model output: Matching marginal distributions and inter-variable dependence structure. Journal of Climate, 29(19), 7045–7064. https://doi.org/10.1175/JCLI-D-15-0679.1.
Cattaneo, C., & Peri, G. (2016). The migration response to increasing temperatures. Journal of Development Economics, 122, 127–146. https://doi.org/10.1016/j.jdeveco.2016.05.004.
De Pauw, E. (2005). Monitoring agricultural drought in the near east. In V. K. Boken, A. P. Cracknell, & R. L. Heathcote (Eds.), Monitoring and predicting agricultural drought (pp. 208–226). New York: Oxford University Press.
Di Paola, A., Rulli, M. C., & Santini, M. (2017). Human food vs. animal feed debate. A thorough analysis of environmental footprints. Land Use Policy, 67, 652–659. https://doi.org/10.1016/j.landusepol.2017.06.017.
Dinesh, D. (2016). Adaptation measures in agricultural systems: Messages to SBSTA 44 agriculture workshops (CCAFS Working Paper no. 145). Copenhagen: CGIAR Research Program on Climate Change, Agriculture and Food Security (CCAFS). Retrieved November 25, 2018, from http://hdl.handle.net/10568/71049
Evans, R. G., & Sadler, E. J. (2008). Methods and technologies to improve efficiency of water use. Water Resources Research, 44(7), W00E04. https://doi.org/10.1029/2007WR006200.
FAO (Food and Agriculture Organization of the United Nations). (2004). Progress achieved in developing strategies for drought mitigation and preparedness planning in the near east region. In: Proceedings of the Third Session of the Agriculture, Land, and Water Use Commission for the Near East, Doha, Qatar, March 9-11, 2004.
Ghimire, R., Ferreira, S., & Dorfman, J. H. (2015). Flood-induced displacement and civil conflict. World Development, 66, 614–628. https://doi.org/10.1016/j.worlddev.2014.09.021.
Grecequet, M., DeWaard, J., Hellmann, J. J., & Abel, G. J. (2017). Climate vulnerability and human migration in global perspective. Sustainability, 9(5), 720. https://doi.org/10.3390/su9050720.
Harris, I., Jones, P. D., Osborn, T. J., & Lister, D. H. (2014). Updated high resolution grids of monthly climatic observations—The CRU TS3.10 Dataset. International Journal of Climatology, 34(3), 623–642. https://doi.org/10.1002/joc.3711.
Hempel, S., Frieler, K., Warszawski, L., Schewe, J., & Piontek, F. (2013). A trend-preserving bias correction—The ISI-MIP approach. Earth System Dynamics, 4(2), 219–236. https://doi.org/10.5194/esd-4-219-2013.
Hsiang, S. M., Burke, M., & Miguel, E. (2013). Quantifying the influence of climate on human conflict. Science, 341(6151), 1235367. https://doi.org/10.1126/science.1235367.
IPCC. (2012). Managing the risks of extreme events and disasters to advance climate change adaptation. A Special Report of Working Groups I and II of the Intergovernmental Panel on Climate Change. Cambridge: Cambridge University Press. Retrieved November 25, 2018, from https://www.ipcc.ch/pdf/special-reports/srex/SREX_Full_Report.pdf
IPCC. (2013). Climate change 2013: The physical science basis. Contribution of Working Group I to the Fifth Assessment Report of the Intergovernmental Panel on Climate Change. Cambridge: Cambridge University Press. Retrieved November 25, 2018, from http://www.ipcc.ch/report/ar5/wg1/
IPCC. (2014). Climate change 2014: Impacts, adaptation, and vulnerability. Contribution of Working Group II to the Fifth Assessment Report of the Intergovernmental Panel on Climate Change. Cambridge: Cambridge University Press. Retrieved November 25, 2018, from http://www.ipcc.ch/report/ar5/wg2/
IPCC. (2018) Global warming of 1.5°C: An IPCC special report on the impacts of global warming of 1.5°C above pre-industrial levels and related global greenhouse gas emission pathways, in the context of strengthening the global response to the threat of climate change, sustainable development, and efforts to eradicate poverty. Geneva: IPCC. Retrieved November 25, 2018, from http://www.ipcc.ch/report/sr15/
IWMI (International Water Management Institute). (2007). Water for food, water for life: A comprehensive assessment of water management in agriculture. London: Earthscan.
Krishnamurthy, P. K., Lewis, K., & Choularton, R. J. (2014). A methodological framework for rapidly assessing the impacts of climate risk on national-level food security through a vulnerability index. Global Environmental Change, 25, 121–132. https://doi.org/10.1016/j.gloenvcha.2013.11.004.
Livi Bacci, M. (2018). Future demographic trends and scenarios. In Food & migrations. Understanding the geopolitical nexus in the Euro-Mediterranean (pp. 19–27). MacroGeo and Barilla Center for Food & Nutrition. Retrieved November 25, 2018, from https://www.foodandmigration.com/
Mancosu, N., Snyder, R. L., Kyriakakis, G., & Spano, D. (2015). Water scarcity and future challenges for food production. Water, 7(3), 975–992. https://doi.org/10.3390/w7030975.
Marchiori, L., Maystadt, J.-F., & Schumacher, I. (2011). The impact of weather anomalies on migration in sub-Saharan Africa. Journal of Environmental Economics and Management, 63(3), 355–374. https://doi.org/10.1016/j.jeem.2012.02.001.
Masih, I., Maskey, S., Mussá, F. E. F., & Trambauer, P. (2014). A review of droughts on the African continent: A geospatial and long-term perspective. Hydrology and Earth System Sciences, 18(9), 3635–3649. https://doi.org/10.5194/hess-18-3635-2014.
Piguet, E. (2010). Linking climate change, environmental degradation, and migration: A methodological overview. Wiley Interdisciplinary Reviews: Climate Change, 1(4), 517–524. https://doi.org/10.1002/wcc.54.
Raineri, L. (2018). Routes of trans-Mediterranean migration. In Food & migrations. Understanding the geopolitical nexus in the Euro-Mediterranean (pp. 57–62). MacroGeo and Barilla Center for Food & Nutrition. Retrieved November 25, 2018, from https://www.foodandmigration.com/
Ray, D. K., Gerber, J. S., MacDonald, G. K., & West, P. C. (2015). Climate variation explains a third of global crop yield variability. Nature Communications, 6, 5989. https://doi.org/10.1038/ncomms6989.
Reuveny, R. (2007). Climate change induced migration and violent conflicts. Political Geography, 26(6), 656–673. https://doi.org/10.1016/j.polgeo.2007.05.001.
Ronco, P., Zennaro, F., Torresan, S., Critto, A., Santini, M., Trabucco, A., Zollo, A. L., Galluccio, G., & Marcomini, A. (2017). A risk assessment framework for irrigated agriculture under climate change. Advances in Water Resources, 110, 562–578. https://doi.org/10.1016/j.advwatres.2017.08.003.
Rosenzweig, C., Elliott, J., Deryng, D., Ruane, A. C., Müller, C., Arneth, A., Boote, K. J., Folberth, C., Glotter, M., Khabarov, N., Neumann, K., Piontek, F., Pugh, T. A. M., Schmid, E., Stehfest, E., Yang, H., & Jones, J. W. (2014). Assessing agricultural risks of climate change in the 21st century in a global gridded crop model intercomparison. Proceedings of the National Academy of Sciences, 111(9), 3268–3273. https://doi.org/10.1073/pnas.1222463110.
Sippel, S., Otto, F. E. L., Forkel, M., Allen, M. R., Guillod, B. P., Heimann, M., Reichstein, M., Seneviratne, S. I., Thonicke, K., & Mahecha, M. D. (2016). A novel bias correction methodology for climate impact simulations. Earth System Dynamics, 7(1), 71–88. https://doi.org/10.5194/esd-7-71-2016.
Spinoni, J., Naumann, G., Vogt, J. V., & Barbosa, P. (2015). The biggest drought events in Europe from 1950 to 2012. Journal of Hydrology: Regional Studies, 3, 509–524. https://doi.org/10.1016/j.ejrh.2015.01.001.
Taylor, K. E., Stouffer, R. J., & Meehl, G. A. (2012). An overview of CMIP5 and the experiment design. Bulletin of the American Meteorological Society, 93(4), 485–498. https://doi.org/10.1175/BAMS-D-11-00094.1.
UNDESA (United Nations, Department of Economic and Social Affairs, Population Division). (2017). Trends in International Migrant Stock: The 2017 Revision (United Nations database, POP/DB/MIG/Stock/Rev.2017). Accessed November 25, 2018, from http://www.un.org/en/development/desa/population/migration/data/estimates2/docs/MigrationStockDocumentation_2017.pdf.
van Vuuren, D. P., Edmonds, J., Kainuma, M., Riahi, K., Thomson, A., Hibbard, K., Hurtt, G. C., Kram, T., Krey, V., Lamarque, J.-F., Masui, T., Meinshausen, M., Nakicenovic, N., Smith, S. J., & Rose, S. K. (2011). The representative concentration pathways: An overview. Climatic Change, 109(1–2), 5–31. https://doi.org/10.1007/s10584-011-0148-z.
Vörösmarty, C. J., Green, P., Salisbury, J., & Lammers, R. B. (2000). Global water resources vulnerability from climate change and population growth. Science, 289(5477), 284–288. https://doi.org/10.1126/science.289.5477.284.
World Food Programme (WPF). (2017). At the root of the Exodus: Food Security, Conflict and International Migration. Retrieved November 25, 2018, from https://docs.wfp.org/api/documents/WFP-0000015358/download/
Author information
Authors and Affiliations
Corresponding author
Editor information
Editors and Affiliations
Rights and permissions
Copyright information
© 2019 Springer Nature Switzerland AG
About this chapter

Cite this chapter
Caporaso, L., Santini, M., Noce, S., de Sanctis, A., Caracciolo, L., Antonelli, M. (2019). Drivers of Migration in the Trans-Mediterranean Region: The Likely Role of Climate Change and Resource Security in the Geopolitical Context. In: Valentini, R., Sievenpiper, J., Antonelli, M., Dembska, K. (eds) Achieving the Sustainable Development Goals Through Sustainable Food Systems. Springer, Cham. https://doi.org/10.1007/978-3-030-23969-5_3
Download citation
DOI: https://doi.org/10.1007/978-3-030-23969-5_3
Published:
Publisher Name: Springer, Cham
Print ISBN: 978-3-030-23968-8
Online ISBN: 978-3-030-23969-5
eBook Packages: Biomedical and Life SciencesBiomedical and Life Sciences (R0)