
Abstract
In this chapter we discuss the practical choices, costs, and benefits in selecting interfaces, or even R types from open source and commercial versions. We also briefly cover the various things that help us choose between various service providers in the cloud.
Access provided by Autonomous University of Puebla. Download chapter PDF
Keywords
These keywords were added by machine and not by the authors. This process is experimental and the keywords may be updated as the learning algorithm improves.
3.1 Which Version of R to Use?
You should always use the latest version of R unless it breaks one of your packages that is needed for critical usage. In that case you are advised to both write to package maintainer as well as keep multiple versions of R. Some other versions of R are pqR Renjin and Riposte but they are not as mature right now. To help you keep your software updated, consider the installr package (covered later in this chapter)
We also show you two other forks of R or non-mainstream versions of R. Maybe they suit your needs or you can contribute to them!
3.1.1 Renjin
Upcoming is a project called Renjin. Renjin is a new implementation of the R language and environment for the Java Virtual Machine (JVM), whose goal is to enable transparent analysis of Big Data sets and seamless integration with other enterprise systems such as databases and application servers. See the demo at http://renjindemo.appspot.com/. However, Renjin is not yet production ready.

3.1.2 pqR
pqR is a new version of the R interpreter. It is based on R-2.15.0, distributed by the R Core Team (at r-project.org), but improves on it in many ways, mostly ways that speed it up, but also by implementing some new features and fixing some bugs.
One notable improvement is that pqR is able to do some numeric computations in parallel with each other, and with other operations of the interpreter, on systems with multiple processors or processor cores. It is created by Radford Neal (http://www.cs.utoronto.ca/~radford/homepage.html) and is available at http://www.pqr-project.org/
In addition to this there is the Riposte project (see Riposte: a trace-driven compiler and parallel VM for vector code in R http://dl.acm.org/citation.cfm?id=2370825). However, the github repository has not been updated in a year
3.2 Which Interface of R to Use
http://rforanalytics.wordpress.com/useful-links-for-r/code-enhancers-for-r/
-
Integrated Development Environment (IDE)
-
RStudio—One of the most popular IDEs used by developers in the R community, and it makes developing R code extremely easy and professional.
-
Eclipse with statet http://www.walware.de/goto/statet StatET is an Eclipse based IDE (integrated development environment) for R. It offers a set of mature tools for R coding and package building. This includes a fully integrated R Console, Object Browser, and R Help System, whereas multiple local and remote installations of R are supported. StatET is provided as plug-in for the Eclipse IDE.
-
Revolution Analytics—Revolution R Enterprise DevelopR (earlier R Productivity Environment) created by Revolution Analytics is a sturdy enterprise grade software environment. A notable innovation is the use of code snippets to help write code. A partial screenshot is shown here showing the snippets facility.

-
-
Console—This is the default interface.
-
GUIs
-
Rattle—Rattle is a GUI focused at data mining. We cover an example of Rattle in Chap. 5.
-
R Commander—This is one of the most widely used GUIs in R project. It is excellent for beginners. In addition it has a huge number of plug-ins that extend its capability. Notable plug-ins are epack (for time series) and kmggplot2 ( for enhanced data visualization).

-
Deducer—Deducer is a GUI focused at data visualization. We cover an example of Deducer in Chap. 5.
-
-
Online Versions of R-
-
Statace
-
R Fiddle
-
OpenCPU
-
-
Commercial Versions
-
Revolution R
-
Oracle R
-
Tibco R
-


3.3 Using R from the Browser
3.3.1 Statace
Statace is a web-based platform that empowers data scientists to collaborate with each other and build graphical self-service applications for people with no knowledge of statistics. Each application is automatically available through an API for easy integration with existing systems.

is an extract from an interview with its CEO, Christian Mladenov.
Ajay Ohri (AO)—What is the difference between using R by StatAce and using R by RStudio on a R Studio server hosted on Amazon EC2?
Christian Mladenov (CM)—There are a few ways in which I think StatAce is better:
You do not need the technical skills to set up a server. You can instead start straight away at the click of a button.
You can save the full results for later reference. With an RStudio server you need to manually save and organize the text output and the graphics.
We are aiming to develop a visual interface for all the standard stuff. Then you will not need to know R at all.
We are developing features for collaboration, so that you can access and track changes to data, scripts, and results in a team. With an RStudio server, you manage commits yourself, and Git is not suitable for large data files.
AO—How do you aim to differentiate yourself from other providers of R based software including Revolution, RStudio, Rapporter, and even Oracle R Enterprise?
CM—We aim to build a scalable, collaborative and easy to use environment. Pretty much everything else in the R ecosystem is lacking one, if not two of these. Most of the GUIs lack a visual way of doing the standard analyses. The ones that have it (e.g., Deducer) have a rather poor usability. Collaboration tools are hardly built in. RStudio has Git integration, but you need to set it up yourself, and you cannot really track large source data in Git.
Revolution Analytics have great technology, but you need to know R and you need to know how to maintain servers for large scale work. It is not very collaborative and can become quite expensive.
Rapporter is great for generating reports, but it is not very interactive—editing templates is a bit cumbersome if you just need to run a few commands. I think it wants to be the place to go to after you have finalized the development of the R code, so that you can share it. Right now, I also do not see the scalability.
With Oracle R Enterprise you again need to know R. It is targeted at large enterprises and I imagine it is quite expensive, considering it only works with Oracle’s database. For that you need an IT team. Screenshot from 2013-11-18 21:31:08
AO—How do you see the space for using R on a cloud?
CM—I think this is an area that has not received enough quality attention—there are some great efforts (e.g. ElasticR), but they are targeted at experienced R users. I see a few factors that facilitate the migration to the cloud:
Statisticians collaborate more and more, which means they need to have a place to share data, scripts, and results.
The number of devices people use is increasing, and now frequently includes a tablet. Having things accessible through the web gives more freedom.
More and more data lives on servers. This is both because it is generated there (e.g., click streams) and because it is too big to fit on a user’s PC (e.g., raw DNA data). Using it where it already is prevents slow download/upload.
Centralizing data, scripts, and results improves compliance (everybody knows where it is), reproducibility, and reliability (it is easily backed up).
For me, having R to the cloud is a great opportunity.
AO—What are some of the key technical challenges you currently face and are seeking to solve for R based cloud solutions?
CM—Our main challenge is CPU use, since cloud servers typically have multiple slow cores and R is mostly single-threaded. We have yet to fully address that and are actively following the projects that aim to improve R’s interpreter—pqR, Renjin, Riposte, etc. One option is to move to bare metal servers, but then we will lose a lot of flexibility.
Another challenge is multi-server processing. This is also an area of progress where we do not yet have a stable solution.
3.3.2 R Fiddle
R Fiddle is another project that enables people to start using R from within the browser. Here is a partial extract from an interview with Dr Jonathan Cornelissen, CEO of Datamind which also makes RDocumentation and R-fiddle.

Ajay—Congrats for making on the first page of hacker news with R-Fiddle. What were your motivations for making http://www.r-fiddle.org/?
Jonathan—Thank you. I must admit it was very exciting to be mentioned on Hacker News, since a lot of people were exposed to the R-fiddle project immediately. In addition, it was a first good test on how our servers would perform.
The motivation for building R-fiddle was simple; our CTO Dieter frequently uses the popular sitehttp://jsfiddle.net/ to prototype webpages, and to share his coding ideas with us. We were looking for something similar for R but it turned out a website allowing you to quickly write, run, and share R-code right inside your browser that did not exist yet. Since we were convinced a fiddle-like tool for R would be useful, we just started building it. Based on the positive reactions and the fast adoption of R-fiddle, I think we were right. That being said, this is a first version of R-fiddle, and we will definitely improve it over the coming months. Check out our blog for updates. (http://blog.datamind.org/)
Ajay—Why did you make http://www.rdocumentation.org/ given that there is so much #Rstats documentation all around the internet including http://www.inside-r.org/?
Jonathan—When we started working on the www.datamind.org platform, we did an online survey to find out whether there would be interest in an interactive learning platform for R and statistics. Although the survey was not on this topic, one of the most striking findings was that a large percentage of R users apparently is frustrated about the documentation of R and its packages. This is interesting since it not only frustrates current users, but it also increases the barrier to entry for new R users and hence puts a brake on the growth and adoption of R as a language. It is mainly for the latter reason we started building Rdocumentation. The whole focus is on usability and letting all users contribute to make the documentation stronger. By the end of next week, we will launch a new version of Rdocumentation, that introduces advanced search functionality for all R functions, shows the popularity of R packages and much more. So make sure to www.Rdocumentation.org for updates.
Ajay—What have been your responses to http://www.datamind.org/#/. Any potential content creation partners or even corporate partners like statistics.com, Revolution, RStudio, Mango etc.
Jonathan—The response to the beta version of DataMind has been great, thousands of learners signed up and took the demo course. We are talking to some of the leading companies in the space and some very well-known professors to develop courses together. It is too soon to disclose details, but we will put regular updates on www.datamind.org. Corporates interested in what we do should definitely get in contact with Martijn@datamind.org.
Ajay—Would it be accurate to call http://www.r-fiddle.org/#/ a browser based GUI for R on the cloud? What enhancements can we expect in the future?
Jonathan—R-fiddle is indeed a browser based GUI for R on the cloud. We have a lot of ideas to improve and extend it. Some of the ideas are: the ability for users to concurrently make changes to a fiddle (Google-docs-style), support for loading data sets, github integration, better security management, lists of popular fiddles, or fiddles from popular people, etc. However, the strong point about R-fiddle is that it is really simple and there is absolutely no friction to start using it. In that respect, we want to differentiate R-fiddle from more advanced solutions such as StatAce or Rstudio Server, which focus on more advanced R users or R usage.
Ajay—You described your architecture for datamind.org at http://blog.datamind.org/ which is very open and transparent of you. What is the architecture for http://www.r-fiddle.org/#/ and what is it based out of?
Jonathan—That is an easy one. Although some details differ obviously, from a high-level perspectiveDataMind.org and R-fiddle.org have exactly the same IT architecture.
Ajay— http://www.datamind.org/#/dashboard describes course creation. How many courses are in the pipeline and how many users and corporate training clients do you foresee in the next 12 months?
Jonathan—Since we launched DataMind, we were inundated by requests from teachers and industry experts eager to contribute their own coursework on the site. But up until last week, it was only possible to take courses instead of creating them yourself. We decided to change this since we do not want to be solely a content company, but also a platform for others to create courses.
Furthermore, by expanding DataMind with a content creation tool, we go beyond our naturally limited in-house ability to create courses. Now DataMind is ready to become a full on ecosystem to facilitate education between our users.
Ajay—What do you think of R in the cloud for teaching ( http://blog.datamind.org/2013/07/23/how-to-run-r-in-the-cloud-for-teaching/)?
Jonathan—We are convinced that cloud solutions are the future of teaching and learning in general. The main problem with the first wave of online education solutions (such as Coursera, EdX, Udacity, etc.) is that they “only” make a copy of the classroom online instead of leveraging technology to create a more engaging and efficient learning experience and interface. Therefore, I do not think the future is in generic learning solutions. Learning interfaces will differ from domain to domain. Good examples are: Duolingo.com to learn languages, or Codeschool.com to learn web development. We are on a mission to build the best learning solutions for statistics and data science.
Ajay—What are some of the other ways we can help make R more popular on the cloud?
Jonathan—I really like the vision behind StatAce.com, and I think something like it will definitely increase further adoption of R. It is somewhat surprising that Rstudio is not offering something like that, but my assumption is they are working on it. That being said, what would be really cool is a very easy-to-use graphical user interface with R under the hood. Whether you like it or not, R has quite a steep learning curve for most people, and allowing them to analyse data with R through a graphical user interface on the web as a first step could start the adoption of R in less technical areas.
3.3.3 RShiny and RStudio
Shiny is a web application framework for R that helps turn analytics into interactive web apps (without HTML, CSS, or JavaScript knowledge). It is available at http://shiny.rstudio.com/. An example of an application from its gallery is below.

Here is an interview with Jeff Allen who works with R and the new package Shiny in his technology startup. His RShiny application can be seen at http://trestletechnology.net:3838/grn/.

Ajay—Describe how you started using R. What are some of the benefits you noticed on moving to R?
Jeff—I began using R in an internship while working on my undergraduate degree. I was provided with some unformatted R code and asked to modularize the code and then wrap it up into an R package for distribution alongside a publication.
To be honest, as a Computer Science student with training more heavily emphasizing the big high-level languages, R took some getting used to for me. It was not until after I concluded that initial project and began using R to do my own data analysis that I began to realize its potential and value. It was the first scripting language which really made interactive use appealing to me—the experience of exploring a dataset in R was unlike anything I would been taught in my University courses.
Upon gaining familiarity with the syntax and basics of the language, I began to see the immense value in the vast array of R packages which had already been created and made publicly available. I found repeatedly that many of the “niche” functions I would been coding myself in more traditional languages had already been developed and shared freely on CRAN or Bioconductor.
Ajay—Describe your work in computational biology using R
Jeff—I work in the Quantitative Biomedical Research Center (QBRC) at UT Southwestern Medical Center. My group is involved in analysing and mining massive biological datasets, much of which is now coming from different sequencing technologies (DNA-seq, RNA-seq, etc.) which generate many Gigabytes of data with each experiment. Unfortunately, due to the sheer volume of that data, R is often unfit for the initial analysis and pre-processing of the data. However, once the data has been processed and reduced, we use R to identify statistically and (hopefully) biologically interesting trends or anomalies.
Personally, most of my research lately has focused on reconstructing the interactions between genes based on the patterns and behaviours we can observe. Thankfully, most of the data we work with here fits in memory, so I use R almost exclusively when doing analysis in this area. My most recent work was in “Ensemble Network Aggregation” (ENA), the package of which is now available in CRAN.
Ajay—Describe your work in web applications using R
Jeff—I was initially tasked with developing software packages which encapsulated the new statistical methodologies being developed within the group (which, at the time, were largely focused on microarray data). I continued developing R packages and began investigating how I might be able to integrate my prior experience with web development into these projects. We ended up developing a handful of different web applications which typically required that we use R to precompute any data which ultimately made its way (statically) into the application.
More recently, we have been developing sites which take advantage of dynamic or real-time R analysis, such as our upcoming release of the Lung Cancer Explorer—a tool which allows for the interactive exploration of lung cancer data within a browser. We went to great lengths to develop the IT and software infrastructure that would allow us to interact with R remotely for these applications.
I have been taking some time on the side to play with RStudio’s new Shiny application which, like most everything else that group has put out, represents a massive leap forward in this space. We have already begun looking at how we can supplement or replace some of our in-house systems with Shiny to start taking advantage of some of its capabilities.
Ajay—What is Trestle Technology focused on?
Jeff—I initially was doing a lot of web development, and helping small-medium businesses integrate and automate various software systems. Once R got added to my resume, however, I started finding more interesting work helping start-ups get their IT and analytics infrastructures off the ground.
My hope is to continue living at the intersection of data and software development and grow this company in that space. It is quite difficult to find groups doing good analysis and proper software development under one roof—especially in Academia. I thoroughly enjoy the process of enriching data analysis tools with more comprehensive, user-friendly interfaces which allow for more efficient exploration of the underlying datasets.
Ajay—Compare R and Python, What are some of the ways you think R can be further improved?
Jeff—I must confess that I am a fairly late-comer to the Python world. I had tinkered with Perl and Python a few years back and ended up feeling more comfortable with Perl for my needs at that point, so I have used it for most of my scripting. Only recently have I started revisiting Python and getting introduced to some of the neat tools available. To me, Python offers a more intuitive Object-Orienting framework than either Perl or R provides, which helps me stay more organized as my “scripts” inevitably grow into “software”.
Aside from OO, I still feel there is much room for improvement in R’s “Big Data” capabilities. The community has certainly been making huge strides in bypassing memory limitations (with packages like ff) and speeding up the code (with code compilation, etc). Nonetheless, I find that my motivation in leaving R for any part of my data analysis is typically motivated by performance concerns and a desire to avoid having to nest any C++ code in my R scripts (though the recent improvements in the Rcpp and devtools packages are making that a much less painful process).
About—
Jeffrey D Allen is a computational biologist at UT Southwestern Medical Center at Dallas.
To know more on the Shiny package and use it for interactive visualization please refer to the cheat sheet at http://shiny.rstudio.com/articles/cheatsheet.html.
3.4 The Cloud Computing Services Landscape
There are 3 main players in the infrastructure provider space for cloud computing world for data sciences. They are:
-
1.
Amazon AWS
-
2.
Microsoft Azure
-
3.
Google Compute Cloud
Others are Oracle Java Cloud and IBM Softlayer
The easiest way to convince someone to start using R on the cloud remains using the Amazon Web Services with Windows Operating System and using a Remote Desktop Player to connect, and then use a graphical user interface (GUI) package of R like Deducer (data visualization), R Commander, or Rattle (Data Mining). This is the opinion of the author and it is based on his impression of the relative penetration of Linux in the world of business analytics as well as some of the issues that transitioning to Linux does on users. It is recommended that the user change one thing at a time, from hardware (PC or Cloud), operating system ( Windows or Linux), and analytics software ( R versus prior software). However the best option for a potential data science centre of excellence is to use Linux on the cloud albeit with the R Studio Server to make the transition easier.
3.4.1 Choosing Infrastructure Providers
When it comes to choosing Infrastructure as a service, we can choose using the following options:

If we do not want to use the cloud for our entire analytical needs, we can use it for computationally intensive things like running simulations or scoring models. This is where software that is offered as a service can help us. Note both Amazon, Microsoft, and Google offer more than just the cloud infrastructure as a service. It is quite useful to look at the complementary services that a cloud infrastructure provider provides, and choose based on suitability.
3.4.1.1 Amazon Cloud
There are many kinds of instances in Amazon at http://aws.amazon.com/ec2/instance-types/. To remove confusion we have represented this in a mildly modified table.
AWS Terminology:
-
Instances—AMIs—An instance is like a virtual computer dedicated to you running remotely. Think of it as a combination of hardware choices (like how much RAM) and operating system choices ( Windows, Red Hat Linux, or Ubuntu Linux). Each instance has a unique id called AMAZON INSTANCE ID.
-
Elastic Block Storage (EBS)—Volumes—A volume is like a hard disk, or ROM Storage. Once you terminate an instance everything on the volume would be deleted. You can however stop and restart an EBS backed Instance
-
Elastic Block Storage—Snapshots—Snapshots are like stored or saved volumes for further reference.
-
Network and Security—Security Groups—Security groups are used for giving access to certain Ports, to certain access types (SSH, or HTTP, or HTTPS, or RDP). We will discuss these in further detail later.
-
Network and Security—Elastic IPs—You can choose to refer to your amazon instance by its IP Address, by attaching an Elastic IP. This is free if attached to a running instance, but costs a small sum if reserved without a running instance. Once you release a certain IP address, it goes back to the pool of available IP addresses for Elastic IP on AWS.
-
Amazon has s3 storage (http://aws.amazon.com/s3/) and glacier storage (http://aws.amazon.com/glacier/)


3.4.1.2 Other Components of Amazon Cloud
Amazon Simple Storage deals with data storage. The vast offerings by Amazon can be summed up in this webpage http://aws.amazon.com/products/.
3.4.1.3 Google Cloud Services
A lucid infographic from https://cloud.google.com/developers/articles/storage-overview helps you understand various components of Google ’s cloud offerings.

This can be seen at https://cloud.google.com/. It has the following components.
-
1.
Application Platforms
-
a.
Google App Engine—Used for building web applications, mobile applications, gaming, as well as websites. You can see your existing Google Cloud Projects at https://cloud.google.com/console.
-
a.
-
2.
Computing Infrastructure
-
a.
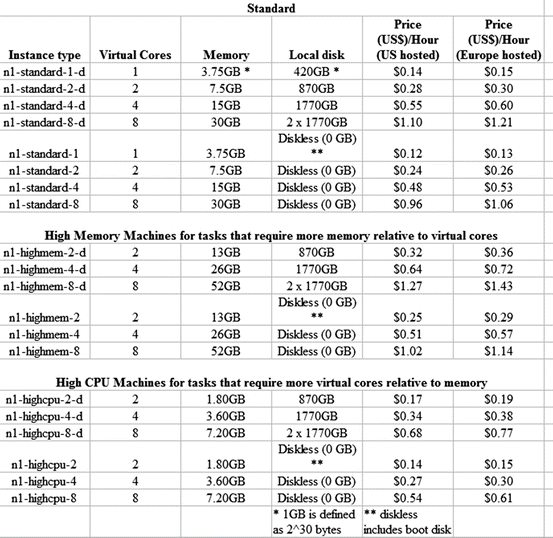
Google Compute Engine—This is primary cloud infrastructure offering by Google. It was in limited preview at the time of writing this book, though the author is grateful to the team for the free access. However it is likely to change based on competition as well as feedback from users once it comes out of preview. One notable disadvantage is that the Windows operating system is completely ignored by Google Compute Engine. The pricing of Google Compute Engine remains one of the most cost effective—as this chart shows for pricing dated 27 February 2013. Note that prices of cloud instances change after every few months, usually becoming cheaper.
-
a.

Google Cloud Storage is available at https://cloud.google.com/pricing/cloud-storage. It has two types of pricing including durable reduced availability storage and standard storage. It is Google’s offering for cloud storage, but is different from the file storage offered by Google Drive. Durable Reduced Availability Storage enables you to store data at lower cost, with the tradeoff of lower availability than standard Google Cloud Storage.

3.4.1.4 Windows Azure
-
1.
Windows Azure storage provides two levels of redundancy: Locally Redundant Storage (LRS)—provides highly durable and available storage within a single sub region. Geo Redundant Storage (GRS)—provides highest level of durability by additionally storing data in a second sub-region within the same region.

-
2.
Querying or Data Access on the Cloud:
-
a.
Google Big Query is available at https://cloud.google.com/products/big-query. BigQuery supports analysis of datasets up to hundreds of terabytes. BigQuery uses a columnar data structure and is a cloud enabled massively parallel query engine. You can read more on this at https://cloud.google.com/files/BigQueryTechnicalWP.pdf.
-
a.

3.5 Interview Ian Fellows Deducer
Here is an interview with Dr Ian Fellows, creator of acclaimed packages in R like Deducer and the Founder and President of Fellstat.com
Ajay—Describe your involvement with the Deducer Project and the various plug-ins associated with it. What has been the usage and response for Deducer from R Community.
Ian—Deducer is a graphical user interface for data analysis built on R. It sprung out of a disconnect between the tool chain used by myself and the tool chain of the psychologists that I worked with at the University of California, San Diego. They were primarily SPSS user, whereas I liked to use R, especially for anything that was not a standard analysis. I felt that there was a big gap in the audience that R serves. Not all consumers or producers of statistics can be expected to have the computational background (command-line programming) that R requires. I think it is important to recognize and work with the areas of expertise that statistical users have. I am not an expert in psychology, and they did not expect me to be one. They are not experts in computation, and I do not think that we should expect them to be in order to be a part of the R tool chain community.ian. This was the impetus behind Deducer, so it is fundamentally designed to be a familiar experience for users coming from an SPSS background and provides a full implementation of the standard methods in statistics, and data manipulation from descriptives to generalized linear models. Additionally, it has an advanced GUI for creating visualizations which has been well received, and won the John Chambers award for statistical software in 2011.
Uptake of the system is difficult to measure as CRAN does not track package downloads, but from what I can tell there has been a steadily increasing user base. The online manual has been accessed by over 75,000 unique users, with over 400,000 page views. There is a small, active group of developers creating add-on packages supporting various sub-disciplines of statistics. There are 8 packages on CRAN extending/using Deducer, and quite a few more on r-forge. Ajay—Do you see any potential for Deducer as an enterprise software product (like R Studio et al) Ian Like R Studio, Deducer is used in enterprise environments but is not specifically geared towards that environment. I do see potential in that realm, but do not have any particular plan to make an enterprise version of Deducer.
Ajay—Describe your work in Texas Hold’em Poker. Do you see any potential for R for diversifying into the casino analytics—which has hitherto been served exclusively by non open source analytics vendors?
Ian—As a Statistician, I am very much interested in problems of inference under uncertainty, especially when the problem space is huge. Creating an Artificial Intelligence that can play (heads-up limit) Texas Hold’em Poker at a high level is a perfect example of this. There is uncertainty created by the random drawing of cards, the problem space is 10ˆ{18}, and our opponent can adapt to any strategy that we employ. While high level chess A.I.s have existed for decades, the first viable program to tackle full scale poker was introduced in 2003 by the incomparable Computer Poker Research group at the University of Alberta. Thus poker represents a significant challenge which can be used as a test bed to break new ground in applied game theory. In 2007 and 2008 I submitted entries to the AAA’s annual computer poker competition, which pits A.I.s from universities across the world against each other. My program, which was based on an approximate game theoretic equilibrium calculated using a co-evolutionary process called fictitious play, came in second behind the Alberta team.
Ajay—Describe your work in social media analytics for R. What potential do you see for Social Network Analysis given the current usage of it in business analytics and business intelligence tools for enterprise?
Ian—My dissertation focused on new model classes for social network analysis (http://arxiv.org/pdf/1208.0121v1.pdf and http://arxiv.org/pdf/1303.1219.pdf). R has a great collection of tools for social network analysis in the statnet suite of packages, which represents the forefront of the literature on the statistical modeling of social networks. I think that if the analytics data is small enough for the models to be fit, these tools can represent a qualitative leap in the understanding and prediction of user behaviour. Most uses of social networks in enterprise analytics that I have seen are limited to descriptive statistics (what is a user’s centrality; what is the degree distribution), and the use of these descriptive statistics as fixed predictors in a model. I believe that this approach is an important first step, but ignores the stochastic nature of the network, and the dynamics of tie formation and dissolution. Realistic modeling of the network can lead to more principled, and more accurate predictions of the quantities that enterprise users care about. The rub is that the Markov Chain Monte Carlo Maximum Likelihood algorithms used to fit modern generative social network models (such as exponential-family random graph models) do not scale well at all. These models are typically limited to fitting networks with fewer than 50,000 vertices, which is clearly insufficient for most analytics customers who have networks more on the order of 50,000,000. This problem is not insoluble though. Part of my ongoing research involves scalable algorithms for fitting social network models. Ajay—You decided to go from your Phd into consulting (www.fellstat.com). What were some of the options you considered in this career choice? Ian I have been working in the role of a statistical consultant for the last 7 years, starting as an in-house consultant at UCSD after obtaining my MS. Fellows Statistics has been operating for the last 3 years, though not fulltime until January of this year. As I had already been consulting, it was a natural progression to transition to consulting fulltime once I graduated with my Phd. This has allowed me to both work on interesting corporate projects and continue research related to my dissertation via sub-awards from various universities.
Ajay—What does Fellstat.com offer in its consulting practice?
Ian—Fellows Statistics offers personalized analytics services to both corporate and academic clients. We are a boutique company that can scale from a single statistician to a small team of analysts chosen specifically with the client’s needs in mind. I believe that by being small, we can provide better, close-to-the-ground responsive service to our clients. As a practice, we live at the intersection of mathematical sophistication and computational skill, with a hint of UI design thrown into the mix. Corporate clients can expect a diverse range of analytic skills from the development of novel algorithms to the design and presentation of data for a general audience. We have worked with Revolution Analytics developing algorithms for their ScaleR product, the Center for Disease Control developing graphical user interfaces set to be deployed for world-wide HIV surveillance, and Prospectus analysing clinical trial data for retinal surgery. With access to the cutting edge research taking place in the academic community, and the skills to implement them in corporate environments, Fellows Statistics is able to offer clients world-class analytics services.
Ajay—How does Big Data affect the practice of statistics in business decisions?
Ian—There is a big gap in terms of how the basic practice of statistics is taught in most universities, and the types of analyses that are useful when data sizes become large. Back when I was at UCSD, I remember a researcher there jokingly saying that everything is correlated rho=.2. He was joking, but there is a lot of truth to that statement. As data sizes get larger everything becomes significant if a hypothesis test is done, because the test has the power to detect even trivial relationships.
Ajay—How is the R community including developers coping with the Big Data era? What do you think R can do more for Big Data?
Ian—On the open source side, there has been a lot of movement to improve R’s handling of Big Data. The bigmemory project and the ff package both serve to extend R’s reach beyond in-memory data structures. Revolution Analytics also has the ScaleR package, which costs money, but is lightening fast and has an ever growing list of analytic techniques implemented. There are also several packages integrating R with hadoop.
Ajay—Describe your research into data visualization including word cloud and other packages. What do you think of Shiny, D3.Js and online data visualization?
Ian—I recently had the opportunity to delve into d3.js for a client project and absolutely love it. Combined with Shiny, d3, and R one can very quickly create a web visualization of an R modeling technique. One limitation of d3 is that it does not work well with internet explorer 6–8. Once these browsers finally leave the ecosystem, I expect an explosion of sites using d3.
Ajay—Do you think word cloud is an overused data visualization type and how can it be refined?
Ian—I would say yes, but not for the reasons you would think. A lot of people criticize word clouds because they convey the same information as a bar chart, but with less specificity. With a bar chart you can actually see the frequency, whereas you only get a relative idea with word clouds based on the size of the word. I think this is both an absolutely correct statement, and misses the point completely. Visualizations are about communicating with the reader. If your readers are statisticians, then they will happily consume the bar chart, following the bar heights to their point on the y-axis to find the frequencies. A statistician will spend time with a graph, will mull it over, and consider what deeper truths are found there. Statisticians are weird though. Most people care as much about how pretty the graph looks as its content. To communicate to these people (i.e., everyone else) it is appropriate and right to sacrifice statistical specificity to design considerations. After all, if the user stops reading you have not conveyed anything. But back to the question I would say that they are over used because they represent a very superficial analysis of a text or corpus. The word counts do convey an aspect of a text, but not a very nuanced one. The next step in looking at a corpus of texts would be to ask how are they different and how are they the same. The word cloud package has the comparison and commonality word clouds, which attempt to extend the basic word cloud to answer these questions (see: http://blog.fellstat.com/?p=101).
About—Dr. Ian Fellows is a professional statistician based out of the University of California, Los Angeles. His research interests range over many sub-disciplines of statistics. His work in statistical visualization won the prestigious John Chambers Award in 2011, and in 2007–2008 his Texas Hold’em AI programs were ranked second in the world.
Applied data analysis has been a passion for him, and he is accustomed to providing accurate, timely analysis for a wide range of projects, and assisting in the interpretation and communication of statistical results. He can be contacted at info@fellstat.com.
3.6 Notable R Projects
Some of the notable R projects have contributed greatly in the past and present to making the R environment more friendly for web applications. Some other projects which are of note:
3.6.1 Installr Package
R is great for installing software. Through the “installr” package you can automate the updating of R (on Windows, using updateR()) and install new software. Software installation is initiated through a gui (just run installr()), or through functions such as: install.Rtools(), install.pandoc(), install.git(), and many more. The updateR() command performs the following: finding the latest R version, downloading it, running the installer, deleting the installation file, copy and updating old packages to the new R installation. It was created by Tal Gallili, who is also the creator of the R-Bloggers website that aggregates 500 plus blogs on R language through RSS feeds.
3.6.2 Rserve
Rserve is a TCP/IP server which allows other programs to use facilities of R (see www.r-project.org) from various languages without the need to initialize R or link against R library. Every connection has a separate workspace and working directory. Client-side implementations are available for popular languages such as \(\mathrm{C/C} + +\), PHP and Java. Rserve supports remote connection, authentication, and file transfer. Typical use is to integrate R back end for computation of statistical models, plots, etc. in other applications. Here, Rserve acts as a socket server (TCP/IP or local sockets) which allows binary requests to be sent to R.
http://cran.r-project.org/web/packages/Rserve/index.html
3.6.3 RApache
rApache is a project supporting web application development using the R statistical language and environment and the Apache web server. The current release runs on UNIX/Linux and Mac OS X operating systems. It is available at http://rapache.net/. Please do read the fine manual at http://rapache.net/manual.html.
3.6.4 Rook
This package contains the Rook specification and convenience software for building and running Rook applications. It borrows heavily from Ruby’s Rack project A Rook application is literally an R function that takes an R environment as input, and returns a list of HTTP-relevant items as output. You can write and run Rook apps within R using the built-in Rhttpd web server and deploy them on rApache.
Rook is both a web server interface and an R package. The idea behind the former is to separate application development from server implementation. Thus, when a web server supports a web server interface, an application written to its specifications is guaranteed to run on that server.
3.6.5 RJ and Rservi
Note RServi is a confusing name (from Rserve) but it is a distinct project. RJ is an open source library providing tools and interfaces to integrate R in Java applications. RJ project also provides a pool for R engines, easy to setup and manage by a web-interface or JMX. One or multiple client can borrow the R engines (called RServi) see http://www.walware.de/it/rj/ and https://github.com/walware/rj-servi.
3.6.6 R and Java
-
rJava is a simple R-to-Java interface. It is comparable to the.C/.Call C interface. rJava provides a low-level bridge between R and Java (via JNI). It allows to create objects, call methods, and access fields of Java objects from R.
-
JRI is a Java/R Interface, which allows to run R inside Java applications as a single thread. Basically it loads R dynamic library into Java and provides a Java API to R functionality. It supports both simple calls to R functions and a full running REPL. JRI is now part of rJava.
-
The JGR project makes the full use of both JRI and rJava to provide a full Java GUI for R.http://cran.r-project.org/web/packages/JGR/.
-
iPlots is a package for the R statistical environment which provides high interaction statistical graphics, written in Java. http://cran.r-project.org/web/packages/iplots/index.html.
3.7 Creating Your Desktop on the Cloud
If you have been using the Windows Operating System on your desktop, when moving to the cloud you may choose the following software to minimize any issues in transition to cloud computing. Download and install the following
-
1.
Chrome Browser www.google.com/chrome
-
2.
Adobe Acrobat Reader http://get.adobe.com/reader/
-
3.
Libre Office www.libreoffice.org/download or Open Office http://www.openoffice.org/download/
- 4.
- 5.
Additional Software for your statistical computing environment
- 1.
-
2.
R http://cran.stat.ucla.edu/bin/windows/ or other locations at http://cran.r-project.org/mirrors.html
-
3.
R Studio IDE http://www.rstudio.com/ide/download/desktop
Author information
Authors and Affiliations
Rights and permissions
Copyright information
© 2014 Springer Science+Business Media, New York
About this chapter
Cite this chapter
Ohri, A. (2014). Navigating the Choices in R and Cloud Computing. In: R for Cloud Computing. Springer, New York, NY. https://doi.org/10.1007/978-1-4939-1702-0_3
Download citation
DOI: https://doi.org/10.1007/978-1-4939-1702-0_3
Published:
Publisher Name: Springer, New York, NY
Print ISBN: 978-1-4939-1701-3
Online ISBN: 978-1-4939-1702-0
eBook Packages: Mathematics and StatisticsMathematics and Statistics (R0)