
Abstract
Enzymes are protein catalysts that are capable of very great specificity and reactivity under physiological conditions. Enzymatic analysis is the measurement of compoundswith the aid of added enzymes or themeasurement of endogenous enzyme activity to give an indication of the state of a biological system including foods. The fact that enzyme catalysis can take place under relatively mild conditions allows for measurement of relatively unstable compounds not amenable to some other techniques. In addition, the specificity of enzyme reactions can allow for measurement of components of complex mixtures without the time and expense of complicated chromatographic separation techniques.
Access provided by Autonomous University of Puebla. Download chapter PDF
Keywords
These keywords were added by machine and not by the authors. This process is experimental and the keywords may be updated as the learning algorithm improves.
1 Introduction
Enzymes are protein catalysts that are capable of very great specificity and reactivity under physiological conditions. Enzymatic analysis is the measurement of compounds with the aid of added enzymes or the measurement of endogenous enzyme activity to give an indication of the state of a biological system including foods. The fact that enzyme catalysis can take place under relatively mild conditions allows for measurement of relatively unstable compounds not amenable to some other techniques. In addition, the specificity of enzyme reactions can allow for measurement of components of complex mixtures without the time and expense of complicated chromatographic separation techniques.
There are several uses of enzyme analyses in food science and technology. In several instances, enzyme activity is a useful measure for adequate processing of a food product. The thermal stability of enzymes has been used extensively as a measure of heat treatment; for example, peroxidase activity is used as a measure of adequacy of blanching of vegetable products. Enzyme activity assays are also used by the food technologist to assess potency of enzyme preparations used as processing aids.
The food scientist can also use commercially available enzyme preparations to measure constituents of foods that are enzyme substrates. For example, glucose content can be determined in a complex food matrix containing other monosaccharides by using readily available enzymes. A corollary use of commercially available enzymes is to measure enzyme activity as a function of enzyme inhibitor content in a food. Organophosphate insecticides are potent inhibitors of the enzyme acetylcholinesterase and hence the activity of this enzyme in the presence of a food extract is a measure of organophosphate insecticide concentration in the food. Also of interest is the measurement of enzyme activity associated with food quality. For example, catalase activity is markedly increased in milk from mastitic udders. Catalase activity also parallels the bacterial count in milk. Another use of enzyme assays to determine food quality is estimation of protein nutritive value by monitoring the activity of added proteases on food protein samples (see Chap. 15). Enzymes can be used to measure the appearance of degradation products such as trimethylamine in fish during storage. Enzymes are also used as preparative tools in food analysis. Examples include the use of amylases and proteases in fiber analysis (Chap. 10) and the enzymatic hydrolysis of thiamine phosphate esters in vitamin analysis.
To successfully carry out enzyme analyses in foods, an understanding of certain basic principles of enzymology is necessary. After a brief overview of these principles, examples of the use of enzymatic analyses in food systems are examined.
2 Principles
2.1 Enzyme Kinetics
2.1.1 Overview
Enzymes are biological catalysts that are proteins. A catalyst increases the rate (velocity) of a thermodynamically possible reaction. The enzyme does not modify the equilibrium constant of the reaction, and the enzyme catalyst is not consumed in the reaction. Because enzymes affect rates (velocities) of reactions, some knowledge of enzyme kinetics (study of rates) is needed for the food scientist to effectively use enzymes in analysis. To measure the rate of an enzyme-catalyzed reaction, typically one mixes the enzyme with the substrate under specified conditions (pH, temperature, ionic strength, etc.) and follows the reaction by measuring the amount of product that appears or by measuring the disappearance of substrate. Consider the following as a simple representation of an enzyme-catalyzed reaction:
where:
The time course of an enzyme-catalyzed reaction is illustrated in Fig. 16-1. The formation of the enzyme substrate complex is very rapid and is not normally seen in the laboratory. The brief time in which the enzyme–substrate complex is initially formed is on the millisecond scale and is called the pre-steady-state period. The slope of the linear portion of the curve following the pre-steady-state period gives us the initial velocity (ν0). After the pre-steady-state period, a steady-state period exists in which the concentration of the enzyme–substrate complex is constant. A time course needs to be established experimentally by using a series of points or a continuous assay to establish the appropriate time frame forthe measurement of the initial velocity.


Time course for a typical enzyme-catalyzed reaction showing the pre-steady-state and steady-state periods. [P] = product concentration.
The rate of an enzyme-catalyzed reaction depends on the concentration of the enzyme and also depends on the substrate concentration. With a fixed enzyme concentration, increasing substrate concentration will result in an increased velocity (see Fig. 16-2). As substrate concentration increases further, the increase in velocity slows until, with a very large concentration of substrate, no further increase in velocity is noted. The velocity of the reaction at this very large substrate concentration is the maximum velocity (V m) of the reaction under the conditions of that particular assay. The substrate concentration at which one-half V m is observed is defined as the Michaelis constant or K m. K m is an important characteristic of an enzyme. It is an indication of the relative binding affinity of the enzyme for a particular substrate. The lower the K m, the greater the affinity of the enzyme for the substrate. Both K m and V m are affected by environmental conditions such as pH and temperature. If we examine relationships that hold in the steady state period, the Michaelis–Menten equation can be derived for the simplified enzyme-catalyzedreaction:


Effect of substrate concentration on the rate of an enzyme-catalyzed reaction. Plotted according to the Michaelis–Menten equation.
where:
In the steady state, the rate of change in enzyme–substrate complex concentration is zero: dES∕dt = 0 and:
Rate of disappearance of ES
Rate of appearance of ES
then
where:
Substituting
Rearranging and solving for [ES]:
If the collection of rate constants in the denominator is defined as the Michaelis constant (K m):
Note that K m is not affected by enzyme or substrate concentration.
Then:
If we define the velocity (ν0) of the enzyme-catalyzed reaction as:
then:
When the enzyme is saturated, i.e., all substrate binding sites on the enzyme are occupied, at the large substrate concentrations in Fig. 16-2, we have maximum velocity, V m. All of Eo is in the ES form and
and
This is the Michaelis–Menten equation, the equation for a right hyperbola; the data plotted in Fig. 16-2 fit such an equation. A convenient way to verify this equation is to simply remember that ν0 = 1 ∕ 2 V m when [S] = K m. Therefore, by simple substitution
2.1.2 Order of Reactions
The velocity of an enzyme-catalyzed reaction increases as substrate concentration increases (see Fig. 16-2). A first-order reaction with respect to substrate concentration is obeyed in the region of the curve where substrate concentration is small ([S] ≪ K m). This means that the velocity of the reaction is directly proportional to the substrate concentration in this region. When the substrate concentration is further increased, the velocity of the reaction no longer increases linearly, and the reaction is mixed order. This is seen in the figure as the curvilinear portion of the plot.** If substrate concentration is increased further, the velocity asymptotically approaches the maximum velocity (V m). In this linear, nearly zero slope portion of the plot, the velocity is independent of substrate concentration. However, note that at large substrate concentrations ([S] ≫ K m), the velocity is directly proportional to enzyme concentration (V m = k 2 [Eo]). Thus, in this portion of the curve where [S] ≫ K m, the rate of the reaction is zero order with respect to substrate concentration (is independent of substrate concentration) but first order with respect to enzyme concentration.
If we are interested in measuring the amount of enzyme in a reaction mixture, we should, if possible, work at substrate concentrations so that the observed velocity approximates V m. At these substrate concentrations, enzyme is directly rate limiting to the observed velocity. Conversely, if we are interested in measuring substrate concentration by measuring initial velocity, we must be at substrate concentrations less than K m in order to have a rate directly proportional to substrate concentration.
2.1.3 Determination of Michaelis Constant (K m ) and V m
To properly design an experiment in which velocity is zero order with respect to substrate and first order with respect to enzyme concentration, or conversely an experiment in which we would like to measure rates that are directly proportional to substrate concentration, we must know the K m. The most popular method for determining K m is the use of a Lineweaver–Burk plot. The reciprocal of the Michaelis–Menten equation is:
This equation is that of a straight line y = mx + b where m = slope and b = y-intercept. A plot of substrate concentration vs. initial velocity as shown in Fig. 16-2 can be transformed to a linear form via use of the reciprocal of Equation [17] and Fig. 16-3 (Lineweaver–Burk plot) results. The intercept of the plotted data on the y (vertical) axis is 1 ∕ V m while the intercept on the x (horizontal) axis is − 1 ∕ K m. The slope of the line is K m ∕ V m. Consequently, both K m and V m can be obtained using this method.


Plot of substrate-velocity data by the Lineweaver–Burk method.
A disadvantage of the Lineweaver–Burk plot is that the data with the inherently largest error, collected at very low substrate concentrations and consequently low rates, tend to direct the drawing of a best fit line. An alternative method of plotting the data is the Eadie Hofstee method. The Michaelis–Menten equation can be rearranged to give:
Equation [18] is also the equation of a straight line and when ν0 vs. ν0/[S] are plotted, the slope of the line is − K m, the y-intercept is V m, and the x-intercept is V m ∕ K m. A more even spacing of the data is achieved by this method than by a Lineweaver–Burk plot.
2.2 Factors that Affect Enzyme Reaction Rate
The velocity of an enzyme-catalyzed reaction is affected by a number of factors, including enzyme and substrate concentrations, temperature, pH, ionic strength, and the presence of inhibitors and activators.
2.2.1 Effect of Enzyme Concentration
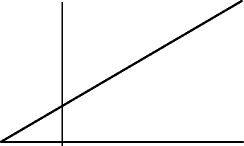
The velocity of an enzyme-catalyzed reaction will depend on the enzyme concentration in the reaction mixture. The expected relationship between enzyme activity and enzyme concentration is shown in Fig. 16-4. Doubling the enzyme concentration will double the rate of the reaction. If possible, determination of enzyme activity should be done at concentrations of substrate much greater than K m. Under these conditions, a zero-order dependence of the rate with respect to substrate concentration and a first-order relationship between rate and enzyme concentration exist. It is critical that the substrate concentration is saturating during the entire period the reaction mixture is sampled and the amount measured of product formed or substrate disappearing is linear over the period during which the reaction is sampled. The activity of the enzyme is obtained as the slope of the linear part of the line of a plot of product or substrate concentration vs. time.


Expected effect of enzyme concentration on observed velocity of an enzyme-catalyzed reaction.


Effect of enzyme concentration on time course of an enzyme-catalyzed reaction. The dashed lines are experimentally determined data with enzyme concentration increasing from 1 to 4. The solid lines are tangents drawn from the initial slopes of the experimental data. If a single time point, a, is used for data collection, a large difference between actual data collected and that predicted from initial rates is seen.


Product concentration [P] formed as a function of time for an enzyme-catalyzed reaction. Line 1 is linear indicating a zero-order reaction with respect to substrate concentration [S]. The slope of line 1 is directly related to enzyme concentration. Line 2 is nonlinear. A replot of line 2 data, plotting log [S 0] ∕ [S] vs. time is linear (Insert), indicating the reaction is first order with respect to substrate concentration. The slope of the replot is directly related to enzyme concentration.
If a large number of samples is to be assayed, a single aliquot is often taken at a single time. This can be risky and will give good results only if the time at which the sample is taken falls on the linear portion of a plot of substrate concentration or product concentration vs. time of reaction (see Fig. 16-5). The plot becomes nonlinear if the substrate concentration falls below the concentration needed to saturate the enzyme, if the increase in concentration of product produces a significant amount of back reaction, or if the enzyme loses activity during the time of the assay. Normally, one designs an experiment in which enzyme concentration is estimated such that no more than 5–10% of the substrate has been converted to product within the time used for measuring the initial rate. In the example shown in Fig. 16-5, by sampling at the single point, a, an underestimation of the rate is made for curves 3 and 4. A better method of estimating rates is to measure initial rates of the reactions, in which the change in substrate or product concentration is determined at times as close as possible to time zero. This is shown in Fig. 16-5 by the solid lines drawn tangent to the slopes of the initial parts of the curves. The slope of the tangent line gives the initial rate.
Sometimes it is not possible to carry out enzyme assays at [S] ≫ K m. The substrate may be very expensive or relatively insoluble or K m may be large (i.e., K m > 100 mM). Enzyme concentration can also be estimated at substrate concentrations much less than K m. When substrate concentration is much less than K m, the substrate term in the denominator of the Michaelis–Menten equation can be ignored and ν = (V m[S]) ∕ K m which is the equation for a first-order reaction with respect to substrate concentration. Under these conditions, a plot of product concentration vs. time gives a nonlinear plot (Fig. 16-6). A plot of log([So]∕[S]) vs. time gives a straight line relationship (Fig. 16-6, inset). The slope of the line of the log plot is directly related to the enzyme concentration. When the slope of a series of these log plots is further plotted as a function of enzyme concentration, a straight line relationship should result. If possible, the reaction should be followed continuously or aliquots removed at frequent time intervals and the reaction be allowed to proceed to greater than 10% of the total reaction.
2.2.2 Effect of Substrate Concentration
The substrate concentration velocity relationship for an enzyme-catalyzed reaction in which enzyme concentration is constant is shown in Fig. 16-2. As noted before, the rate of the reaction is first order with respect to substrate concentration when [S] ≪ K m. At [S] ≫ K m, the reaction is zero order with respect to substrate concentration and first order with respect to [E]. At substrate concentrations between the first-order and zero-order regions, the enzyme-catalyzed reaction is mixed order with respect to substrate concentration. However, when initial rates are obtained, a linear relationship between ν0 and Eo should be seen.
2.2.3 Environmental Effects
2.2.3.1 Effect of Temperature on Enzyme Activity
Temperature can affect observed enzyme activity in several ways. Most obvious is that temperature can affect the stability of enzyme and also the rate of the enzyme-catalyzed reaction. Other factors in enzyme-catalyzed reactions that may be considered include the effect of temperature on the solubility of gases that are either products or substrates of the observed reaction and the effect of temperature on pH of the system. A good example of the latter is the common buffering species Tris (tris [hydroxymethyl] aminomethane), for which the pK a changes 0.031 per 1∘ C change.
Temperature affects both the stability and the activity of the enzyme, as shown in Fig. 16-7. At relatively low temperatures, the enzyme is stable. However, at higher temperatures, denaturation dominates, and a markedly reduced enzyme activity represented by the negative slope portion of line 2 is observed. Line 1 of Fig. 16-7 shows the effect of temperature on thevelocity of the enzyme-catalyzed reaction. The velocity is expected to increase as the temperature is increased. As shown by line 1, the velocity approximately doubles for every 10∘ C rise in temperature. The net effect of increasing temperature on the rate of conversionof substrate to product (line 1) and on the rate of the denaturation of enzyme (line 3) is line 2 of Fig. 16-7. The temperature optimum of the enzyme is at the maximum point of line 2. The temperature optimum is not a unique characteristic of the enzyme. The optimum applies instead to the entire system because type of substrate, pH, salt concentration, substrate concentration, and time of reaction can affect the observed optimum. For this reason, investigators should fully describe a system in which the effects of temperature on observed enzyme activity are reported.


Effect of temperature on velocity of an enzyme-catalyzed reaction. Temperature effect on substrate to product conversion is shown by line 1. Line 3 shows effect of temperature on rate of enzyme denaturation (right-hand y-axis is for line 3). The net effect of temperature on the observed velocity is given by line 2 and the temperature optimum is at the maximum of line 2.
The data of line 2 of Fig. 16-7 can be plotted according to the Arrhenius equation:
which can be written:
where:
The positive slope on the left side (high temperature) of the Arrhenius plot (Fig. 16-8) gives a measure of the activation energy (E a) for the denaturation of the enzyme. Note that a small change** in temperature has a very large effect on the rate of denaturation. The slope on the right side of Fig. 16-8 gives a measure of the E a for the transformation of substrate to product catalyzed by the enzyme. If the experiment is carried out under conditions in which V m is measured ([S] ≫ K m), then the activation energy observed will be for the catalytic step of the reaction.


Effect of temperature on rate constant of an enzyme-catalyzed reaction. The data are plotted 2.3 log k vs. 1 ∕ T(∘ K) according to the Arrhenius equation, \(k = A{\mathrm{e}}^{-{E}_{\mathrm{a}}/RT}\).
2.2.3.2 Effect of pH on Enzyme Activity
The observed rate of an enzyme-catalyzed reaction is greatly affected by the pH of the medium. Enzymes have pH optima and commonly have bell-shapedcurves for activity vs. pH (Fig. 16-9). This pH effect is a manifestation of the effects of pH on enzyme stability and on rate of substrate to product conversion and may also be due to changes in ionization of substrate. The rate of substrate to product conversion is affected by pH because pH may affect binding of substrate to enzyme and the ionization of catalytic groupssuch as carboxyl or amino groups that are part of the enzyme’s active site. The stability of the tertiary or quarternary structure of enzymes is also pH dependent and affects the velocity of the enzyme reaction, especially at extreme acidic or alkaline pHs. The pH for maximum stability of an enzymedoes not necessarily coincide with the pH for maximum activity of that same enzyme. For example, the proteolytic enzymes trypsin and chymotrypsin are stable at pH 3, while they have maximum activity at pH 7–8.


Typical velocity-pH curve for an enzyme-catalyzed reaction. The maximum on the curve is the optimum for the system and can vary with temperature, specific substrate, and enzyme source.
To establish the pH optimum for an enzyme reaction, the reaction mixture is buffered at different pHs and the activity of the enzyme is determined. To determine pH enzyme stability relationships, aliquots of the enzyme are buffered at different pH values and held for a specified period of time (e.g., 1 h). The pH of the aliquots is then adjusted to the pH optimum and each aliquot is assayed. The effect of pH on enzyme stability is thus obtained. These studies are helpful in establishing conditions for handling the enzyme and also may be useful in establishing methods for controlling enzyme activity in a food system. Note that pH stability and the pH optimum for the enzyme activity are not true constants. That is to say, these may vary with particular source of enzyme, the specific substrate used, the temperature of the experiment, or even the buffering species used in the experiment. In the use of enzymes for analysis, it is not necessary that the reaction be carried out at the pH optimum for activity, or even at a pH at which the enzyme is most stable, but it is critical to maintain a fixed pH during the reaction (i.e., use buffer) and to use the same pH in all studies to be compared.
2.2.4 Activators and Inhibitors
2.2.4.1 Activators
Some enzymes contain, in addition to a protein portion, small molecules that are activators of the enzyme. Some enzymes show an absolute requirement for a particular inorganic ion for activity while others show increased activity when small molecules are included in the reaction medium. These small molecules can play a role in maintaining the conformation of the protein, or they may form an essential component of the active site, or they may form part of the substrate of the enzyme.
In some cases, the activator forms a nearly irreversible association with the enzyme. These nonprotein portions of the enzyme are called prosthetic groups. The amount of enzyme activator complex formed is equal to the amount of activator present in the mixture. In these cases, activator concentration can be estimated up to concentrations equal to total enzyme concentration by simply measuring enzyme activity.
In most cases, dissociation constants for an enzyme activator complex are within the range of enzyme concentration. Dissociable nonprotein parts of enzymes are categorized as coenzymes. When this type of activator is added to enzyme, a curvilinear relationship similar to a Michaelis–Menten plot results, making difficult the determination of an unknown amount of activator. A reciprocal plot analogous to a Lineweaver–Burk plot can be constructed using standards and unknown activator concentrations estimated from such a plot.
One food-related enzyme reaction involving an activator is measuring pyridoxal-phosphate, a form of vitamin B6. This reaction measures the reactivation of coenzyme free yeast aminotransferase by coupling the transamination reaction with malate dehydrogenase. This is possible when malate dehydrogenase, NADH, alpha-ketoglutarate, aspirate, and the aminotransferase are in excess, and the pyridoxal 5-phosphate added is rate limiting.
Another example of an essential activator is the pyridine coenzyme NAD+. NAD+ is essentialfor the oxidation of ethanol to acetaldehyde by alcohol dehydrogenase:
In the reaction, NAD+ is reduced to NADH and can be considered a second substrate. Another example of an activator of an enzyme is the chloride ion with α-amylase. In this case, α-amylase has some activity in the absence of chloride. With saturating levels of chloride, the α-amylase activity increases about fourfold. Other anions, including F−, Br−, and I−, also activate α-amylase. These anions must not be in the reaction mixture if α-amylase stimulation is to be used as a method of determining chloride concentration.
2.2.4.2 Inhibitors
An enzyme inhibitor is a compound that when present in an enzyme-catalyzed reaction medium decreases the enzyme activity. Enzyme inhibitors can be categorized as irreversible or reversible inhibitors. Enzyme inhibitors include inorganic ions, such as Pb2 + or Hg2 +, which can react with sulfhydryl groups on enzymes to inactivate the enzyme, compounds that resemble substrate, and naturally occurring proteins that specifically bind to enzymes (such as protease inhibitors found in legumes).
-
1.
Irreversible inhibitors. When the dissociation constant of the inhibitor enzyme complex is very small, the decrease in enzyme activity observed will be directly proportional to the inhibitor added. The speed at which the irreversible combination of enzyme and inhibitor reacts may be slow, and the effect of time on the reduction of enzyme activity by the addition of inhibitor must be determined to ensure complete enzyme–inhibitor reaction. For example, the amylase inhibitor found in many legumes must be preincubated under specified conditions with amylase prior to measurement of residual activity to accurately estimate inhibitor content [1]. Irreversible inhibitors decrease V m as the amount of total active enzyme is reduced.
-
2.
Reversible inhibitors. Most inhibitors exhibit a dissociation constant such that both enzyme and inhibitor are found free in the reaction mixture. Several types of reversible inhibitors are known: competitive, noncompetitive, and uncompetitive.
Competitive inhibitors usually resemble the substrate structurally and compete with substrate for binding to the active site of the enzyme, and only one molecule of substrate or inhibitor can be bound to the enzyme at one time. An inhibitor can be characterized as competitive by adding a fixed amount of inhibitor to reactions at various substrate concentrations and by plotting the resulting data by the Lineweaver–Burk method and noting the effect of inhibitor relative to that of control reactions in which no inhibitor is added. If the inhibitor is competitive, the slope and x-intercept of the plot with inhibitor are altered while the y-intercept (1 ∕ V m) is unaltered. It can be shown that the ratio of the uninhibited initial velocity (νo) to the inhibited initial velocity (νi) gives:
where:
Thus, a plot of νo ∕ νi vs. inhibitor concentration will give a straight line relationship. From this plot the concentration of a competitive inhibitor can be found [2].
A noncompetitive inhibitor binds to enzyme independent of substrate and is bound outside the active site of the enzyme. A noncompetitive inhibitor can be identified by its effect on the rate of enzyme-catalyzed reactions at various substrate concentrations and the data plotted by the Lineweaver–Burk method. A noncompetitive inhibitor will affect the slope and the y-intercept as compared to the uninhibited system while the x-intercept, 1 ∕ K m, is unaltered. Analogous to competitive inhibitors, a standard curve of νo ∕ νi vs. inhibitor concentration may be prepared and used to determine the concentration of a noncompetitive inhibitor [2].
Uncompetitive inhibitors bind only to the enzyme–substrate complex. Uncompetitive inhibition is noted by adding a fixed amount of inhibitor to reactions at several substrate concentrations and plotting the data by the Lineweaver–Burk method. An uncompetitive inhibitor will affect both the x- and y-intercepts of the Lineweaver–Burk plot as compared to the uninhibited system, while maintaining an equal slope to the uninhibited system (i.e., a parallel line will result). A plot of νo ∕ νi vs. inhibitor concentration can be prepared to use as a standard curve for the determination of the concentration of an uncompetitive inhibitor [2].
2.3 Methods of Measurement
2.3.1 Overview
For practical enzyme analysis, it is necessary to be familiar with the methods of measurement of the reaction. Any physical or chemical property of the system that relates to substrate or product concentration can be used to follow an enzyme reaction. A wide variety of methods are available to follow enzyme reactions, including absorbance spectrometry, fluorimetry, manometric methods, titration, isotope measurement, chromatography, mass spectrometry, and viscosity. A good example of the use of spectrophotometry as a method for following enzyme reactions is use of the spectra of the pyridine coenzyme NAD(H) and NADP(H), in which there is a marked change in absorbance at 340 nm upon oxidation–reduction (Fig. 16-10). Many methods depend on the increase or decrease in absorbance at 340 nm when these coenzymes are products or substrates in a coupled reaction.


Absorption curves of NAD(P) and NAD(P)H; λ = wavelength. Many enzymatic analysis methods are based on the measurement of an increase or decrease in absorbance at 340 nm due to NAD(H) or NADP(H).
An example of using several methods to measure the activity of an enzyme is in the assay of α-amylase activity [3]. α-Amylase cleaves starch at α-1,4 linkages in starch and is an endoenzyme. An endoenzyme cleaves a polymer substrate at internal linkages. This reaction can be followed by a number of methods, including reduction in viscosity, increase in reducing groups upon hydrolysis, reduction in color of the starch iodine complex, and polarimetry. However, it is difficult to differentiate the activity of α-amylase from β-amylase using a single assay. α-Amylase cleaves maltose from the nonreducing end of starch. While a marked decrease in viscosity of starch or reduction in iodine color would be expected to occur due to α-amylase activity, β-amylase can also cause changes in viscosity and iodine color if in high concentration. To establish whether α-amylase or β-amylase is being measured, the analyst must determine the change in number of reducing groups as a basis of comparison. Because α-amylase is an endoenzyme, hydrolysis of a few bonds near the center of the polymeric substrate will cause a marked decrease in viscosity, while hydrolysis of an equal number of bonds by the exoenzyme, β-amylase, will have little effect on viscosity.
In developing an enzyme assay, it is wise to first write out a complete, balanced equation for the particular enzyme-catalyzed reaction. Inspection of the products and substrates for chemical and physical properties that are readily measurable with available equipment will often result in an obvious choice of method for following the reaction in the laboratory.
If one has options in methodology, one should select the method that is able to monitor the reaction continuously, is most sensitive, and is specific for the enzyme-catalyzed reaction.
2.3.2 Coupled Reactions
Enzymes can be used in assays via coupled reactions. Coupled reactions involve using two or more enzyme reactions so that a substrate or product concentration can be readily followed. In using a coupled reaction, there is an indicator reaction and a measuring reaction. For example:
The role of the indicating enzyme (E2) is to produce P2, which is readily measurable and, hence, is an indication of the amount of P1 produced by E1. Alternatively the same sequence can be used in measuring S1, the substrate for E1. When a coupled reaction is used to measure the activity of an enzyme (e.g., E1 above), it is critical that the indicating enzyme E2 not be rate limiting in the reaction sequence: the measuring reaction must always be rate determining. Consequently, E2 activity should be much greater than E1 activity for an effective assay. Coupled enzyme reactions can have problems with respect to pH of the system if the pH optima of the coupled enzymes are quite different. It may be necessary to allow the first reaction (e.g., the measuring reaction catalyzed by E1 above, Equation [25]) to proceed for a time and then arrest the reaction by heating to denature E1. The pH is adjusted, the indicating enzyme (E2, Equation [26]) added, and the reaction completed. If an endpoint method is used with a coupled system, the requirements for pH compatibility are not as stringent as for a rate assay because an extended time period can be used to allow the reaction sequence to go to completion.
3 Applications
As described previously, certain information is needed prior to using enzyme assays analytically. In general, knowledge of K m, time course of the reaction, the enzyme’s specificity for substrate, the pH optimum and pH stability of the enzyme, and effects of temperature on the reaction and stability of the enzyme are desirable. Many times this information is available from the literature. However, a few preliminary experiments may be necessary, especially in the case of experiments in which velocities are measured. A time course to establish linearity of product formation or substrate consumption in the reaction is a necessity. An experiment to show linearity of velocity of the enzyme reaction to enzyme concentration is recommended (see Fig. 16-5).
3.1 Substrate Assays
The following is not an extensive compendium of methods for the measurement of food components by enzymatic analysis. Instead, it is meant to be representative of the types of analyses possible. The reader can consult handbooks published by the manufacturers of enzyme kits (e.g., Megazyme; https://securemegazyme.com/Dynamic.aspx?control=CSCatalogue∖&categoryName=AssayKits, the review article by Whitaker [2], a book by Henniger [4], and the series by Bergmeyer [5] for a more comprehensive guide to enzyme methods applicable to foods.
3.1.1 Sample Preparation
Because of the specificity of enzymes, sample preparation prior to enzyme analysis is often minimal and may involve only extraction and removal of solids by filtration or centrifugation. Regardless, due to the wide variety of foods that might be encountered by the analyst using enzyme assays, a check should be made of the extraction and enzyme reaction steps by standard addition of known amounts of analyte to the food and extract, and measuring recovery of that standard. If the standard additions are fully recovered, this is a positive indication that the extraction is complete, that sample does not contain interfering substances that require removal prior to the enzymatic analysis, and that the reagents are good. In some cases, interfering substances are present but can be readily removed by precipitation or adsorption. For example, polyvinylpolypyrrolidone (PVPP) powder can be used to decolorize juices or red wines. With the advent of small syringe minicolumns (e.g., C18, silica, and ion exchange cartridges), it is also relatively easy and fast to attain group separations to remove interfering substances from a sample extract.
3.1.2 Total Change/Endpoint Methods
While substrate concentrations can be determined in rate assays when the reaction is first order with respect to substrate concentration ([S] ≪ Km), substrate concentration can also be determined by the total change or endpoint method. In this method, the enzyme-catalyzed reaction is allowed to go to completion so that concentration of product,** which is measured, is directly related to substrate. An example of such a system is the measurement of glucose using glucose oxidase and peroxidase, described below.
In some cases, an equilibrium is established in an endpoint method in which there is a significant amount of substrate remaining in equilibrium with product. In these cases, the equilibrium can be altered. For example, in cases in which a proton-yielding reaction is used, alkaline conditions (increase in pH) can be used. Trapping agents can also be used, in which product is effectively removed from the reaction, and by mass action the reaction goes to completion. Examples include the trapping of ketones and aldehydes by hydrazine. In this way, the product is continually removed and the reaction is pulled to completion. The equilibrium also can be displaced by increasing cofactor or coenzyme concentration.
Another means of driving a reaction to completion is a regenerating system [5]. For example, in the measurement of glutamate, with the aid of glutamate dehydrogenase, the following can be done:
In this system, NADH is recycled to NAD+ via lactate dehydrogenase until all the glutamate to be measured is consumed. The reaction is stopped by heating to denature the enzymes present, a second aliquot of glutamate dehydrogenase and NADH is added, and the α-ketoglutarate (equivalent to the original glutamate) measured via decrease in absorbance at 340 nm. An example in which the same equilibrium is displaced in the measurement of glutamate is as follows:
Iodonitrotetrazolium chloride (INT) is a trapping reagent for the NADH product of the glutamate dehydrogenase catalyzed reaction. The formazan formed is measurable colorimetrically at 492 nm.
3.1.3 Specific Applications
3.1.3.1 Measurement of Sulfite
Sulfite is a food additive that can be measured by several techniques, including titration, distillation followed by titration, gas chromatography, and colorimetric analysis. Sulfite also can be specifically oxidized to sulfate by the commercially available enzyme sulfite oxidase (SO):
The \({\mathrm{{H}_{2}O}}_{2}\) product can be measured by several methods including use of the enzyme NADH-peroxidase:
The amount of sulfite in the system is equal to the NADH oxidized, which is determined by decrease in absorbance at 340 nm. Ascorbic acid can interfere with the assay but can be removed by using ascorbic acid oxidase [6].
3.1.3.2 Colorimetric Determination of Glucose
The combination of the enzymes glucose oxidase and peroxidase can be used to specifically measure glucose in a food system [7] (see also Chap. 10, Sect. 10.3.4.3.3). Glucose is preferentially oxidized by glucose oxidase to produce gluconolactone and hydrogen peroxide. The hydrogen peroxide plus o-dianisidine in the presence of peroxidase produces a yellow color that absorbs at 420 nm Equations [33] and [34]. This assay is normally carried out as an endpoint assay and there is stoichiometry between the color formed and the amount of glucose in the extract, which is established with a standard curve. Because glucose oxidase is quite specific for glucose, it is a useful tool in determining the amount of glucose in the presence of other reducing sugars.
3.1.3.3 Starch/Dextrin Content
Starch and dextrins can be determined by enzymatic hydrolysis using amyloglucosidase, an enzyme that cleaves α-1,4 and α-1,6 bonds of starch, glycogen, and dextrins, liberating glucose (see Chap. 10). The glucose formed can be subsequently determined enzymatically. Glucose can be determined by the previously described colorimetric method, in which glucose is oxidized by glucose oxidase and coupled to a colored dye via reaction of the glucose oxidase product, hydrogen peroxide, with peroxidase. An alternative** method of measuring glucose is by coupling hexokinase (HK) and glucose-6-phosphate dehydrogenase (G6PDH) reactions:
The amount of NADPH formed is measured by absorbance at 340 nm and is a stoichiometric measure of the glucose originating in the dextrin or starch hydrolyzed by amyloglucosidase. The amount of starch determined by this method is calculated as follows:
where:
Note that HK catalyzes the phosphorylation of fructose as well as glucose. The determination of glucose is specific because of the specificity of the second reaction, catalyzed by G6PDH, in which glucose-6-phosphate is the substrate.
This assay sequence can be used to detect the dextrins of corn syrup used to sweeten a fruit juice product. A second assay would be needed, however, without treatment with amyloglucosidase to account for the glucose in the product. The glucose determined in that assay would be subtracted from the result of the assay in which amyloglucosidase is used.
The same HK-G6PDH sequence used to measure glucose can also be used to measure other carbohydrates in foods. For example, lactose and sucrose can be determined via specific hydrolysis of these disaccharides by β-galactosidase and invertase, respectively, followed by the use of the earlier described HK-G6PDH sequence.
3.1.3.4 Determination of d-Malic Acid in Apple Juice
Two stereoisomeric forms of malic acid exist. l-Malic acid occurs naturally, while the d form is normally not found in nature. Synthetically produced** malic acid is a mixture of these two isomers. Consequently, synthetic malic acid can be detected by a determination of d-malic acid. One means of detecting the malic acid is through the use of the enzyme decarboxylating d-malate dehydrogenase (DMD) [8]. DMD catalyzes the conversion of d-malic acid as follows:
The reaction can be followed by the measurement of NADH photometrically. Because CO2 is a product of this reaction and escapes, the equilibrium of the reaction lies to the right and the process is irreversible. This assay is of value because the addition of synthetic d/l malic acid can be used to illegally increase the acid content of apple juice and apple juice products.
3.2 Enzyme Activity Assays
3.2.1 Peroxidase Activity
Peroxidase is found in most plant materials and is reasonably stable to heat. A heat treatment that will destroy all peroxidase activity in a plant material is usually considered to be more than adequate to destroy other enzymes and most microbes present. In vegetable processing, therefore, the adequacy of the blanching process can be monitored by following the disappearance of peroxidase activity [9]. Peroxidase catalyzes the oxidation of guaiacol (colorless) in the presence of hydrogen peroxide to form tetraguaiacol (yellow brown) and water Equation [39]. Tetraguaiacol has an absorbance maximum around 450 nm. Increase in absorbance at 450 nm can be used to determine the activity of peroxidase in the reaction mixture.
3.2.2 Lipoxygenase
Recently it has been pointed out that lipoxygenase may be a more appropriate enzyme to measure the adequacy of blanching of vegetables than peroxidase [10]. Lipoxygenase refers to a group of enzymes that catalyzes the oxidation by molecular oxygen of fatty acids containing a cis, cis, 1,4-pentadiene system producing conjugated hydroperoxide derivatives:
A variety of methods can be used to measure lipoxygenase activity in plant extracts. The reaction can be followed by measuring loss of fatty acid substrate, oxygen uptake, occurrence of the conjugated diene at 234 nm, or the oxidation of a cosubstrate such as carotene [11]. All these methods have been used, and each has its advantages. The oxygen electrode method is widely used and replaces the more cumbersome manometric method. The electrode method is rapid and sensitive and gives continuous recording. It is normally the method of choice for crude extracts, but secondary reactions involving oxidation must be corrected for or eliminated. Zhang et al. [12] have reported the adaptation of the O2 electrode method to the assay of lipoxygenase in green bean homogenates without extraction. Due to the rapidity of the method ( < 3 min including the homogenization), on-line process control using lipoxygenase activity as a control parameter for optimization of blanching of green beans is a real possibility. The formation of conjugated diene fatty acids with a chromophore at 234 nm can also be followed continuously. However, optically clear mixtures are necessary. Bleaching of carotenoids has also been used as a measure of lipoxygenase activity. However, the stoichiometry of this method is uncertain, and all lipoxygenases do not have equal carotenoid bleaching activity. Williams et al. [10] have developed a semiquantitative spot test assay for lipoxygenase in which I− is oxidized to I2 in the presence of the linoleic acid hydroperoxide product and the I2 detected as an iodine starch complex.
3.2.3 Phosphatase Assay
Alkaline phosphatase is a relatively heat stable enzyme found in raw milk. The thermal stability of alkaline phosphatase in milk is greater than the non-spore forming microbial pathogens present in milk. The phosphatase assay has been applied to dairy products to determine whether pasteurization has been done properly and to detect the addition of raw milk to pasteurized milk. A common phosphatase test is based on the phosphatase-catalyzed hydrolysis of disodium phenyl phosphate liberating phenol [13]. The phenol product is measured colorimetrically after reaction with CQC (2,6-dichloroquinonechloroimide) to form a blue indophenol. The indophenol is extracted into n-butanol and measured at 650 nm. This is an example of a physical separation of product to allow the ready measurement of an enzyme reaction. More recently, a rapid fluorometric assay was developed and commercialized for measurement of alkaline phosphatase in which the rate of fluorophore production can be monitored directly without butanol extraction used to measure indophenol when phenylphosphate is used as substrate [14]. The fluorometric assay was shown to give greater repeatability compared to the standard assay in which phenylphosphate is used as substrate and was capable of detecting 0.05% raw milk in a pasteurized milk sample. Similar chemistry has been applied to the measurement of acid phosphatase activity in meats as a means of ensuring adequate cooking via correlation of enzyme activity to endpoint temperature [15].
3.2.4 α-Amylase Activity
Amylase activity in malt is a critical quality parameter. The amylase activity in malt is often referred to as diastatic power and refers to the production of reducing substances by the action of α- and β-amylases on starch. The measurement of diastatic power involves digestion of soluble starch with a malt infusion (extract) and following increase in reducing substances by measuring reduction of Fehling’s solution or ferricyanide. Specifically measuring α-amylase activity (often referred to as dextrinizing activity) in malt is more complicated and is based on using a limit dextrin as substrate. Limit dextrin is prepared by action of β-amylase (free of α-amylase activity) on soluble starch. The β-amylase clips maltose units off the nonreducing end of the starch molecule until an α-1,6- branch point is encountered. The resulting product is a β-limit dextrin that serves as the substrate for the endo cleaving α-amylase. A malt infusion is added to the previously prepared limit dextrin substrate and aliquots removed periodically to a solution of dilute iodine. The α-amylase activity is measured by changed color of the starch iodine complex in the presence of excess β-amylase used to prepare the limit dextrin. The color is compared to a colored disc on a comparator. This is continued until the color is matched to a color on a comparator. The time to reach that color is dextrinizing time and is a measure of α-amylase activity, a shorter time representing a more active preparation.
Because α-amylase is an endoenzyme, when it acts on a starch paste the viscosity of the paste is dramatically reduced, greatly influencing flour quality. Consequently, α-amylase activity is of great importance in whole wheat. Wheat normally has small amounts of α-amylase activity, but when wetted in the field, preharvest sprouting (pregermination) can occur in wheat, with a dramatic increase in α-amylase activity. Preharvest sprouting cannot be easily detected visually, so measurement of α-amylase activity can be used as a sensitive estimate of preharvest sprouting. The falling number method is a procedure in which ground wheat is heated with water to form a paste, and the time it takes for a plunger to fall through the paste is recorded [16]. Accordingly, the time in seconds (the falling number) is inversely related to the α-amylase activity and the degree of preharvest sprouting. This method of measuring enzyme activity is a good example of using change in physical property of a substrate as a means of estimation of enzyme activity.
3.2.5 Rennet Activity
Rennet, an extract of bovine stomach, is used as a coagulating agent in cheese manufacture. Most rennet activity tests are based on noting the ability of a preparation to coagulate milk. For example, 12% nonfat dry milk is dispersed in a 10 mM calcium chloride solution and warmed to 35∘ C. An aliquot of the rennet preparation is added and the time of milk clotting observed visually. The activity of the preparation is calculated in relationship to a standard rennet. As opposed to coagulation ability, rennet preparations can also be evaluated for proteolytic activity by measuring the release of a dye from azocasein (casein to which a dye has been covalently attached). In this assay, the rennet preparation is incubated with 1% azocasein. After the reaction period, the reaction is stopped by addition of trichloroacetic acid. The trichloroacetic acid precipitates the protein that is not hydrolyzed. The small fragments of colored azocasein produced by the hydrolysis of the rennet are left in solution and absorbance read at 345 nm [17, 18]. This assay is based on the increase in solubility of a substrate upon cleavage by an enzyme.
3.3 Biosensors/Immobilized Enzymes
The use of immobilized enzymes as analytical tools is currently receiving increased attention. An immobilized enzyme in concert with a sensing device is an example of a biosensor. A biosensor is a device comprised of a biological sensing element (e.g., enzyme, antibody, etc.) coupled to a suitable transducer (e.g., optical, electrochemical, etc.). Immobilized enzymes, because of their stability and ease of removal from the reaction, can be used repeatedly, thus eliminating a major cost in enzyme assays. The most widely used enzyme electrode is the glucose electrode in which glucose oxidase is combined with an oxygen electrode to determine glucose concentration [19, 20, 21, 22, 23]. When the electrode is put into a glucose solution, the glucose diffuses into the membrane where it is converted to gluconolactone by glucose oxidase with the uptake of oxygen. The oxygen uptake is a measure of the glucose concentration. The Clark polarographic electrode can be used for measurement of the oxygen. More recently oxygen sensors based on fiber optics and fluorescence quenching have been made commercially available and have the advantage of not needing the maintenance of Clark electrodes. Glucose can also be measured by the action of glucose oxidase with the detection of hydrogen peroxide, in which the hydrogen peroxide is detected amperometrically at a polarized electrode [22]. Similar systems have been commercialized in which lactate, ethanol, sucrose, lactose, and glutamate can be measured. In the case of some of these sensors multiple enzymes are immobilized. For example for sucrose analysis, invertase, mutarotase, and glucose oxidase are immobilized on the same membrane. A large number of other enzyme electrodes have been reported. For example, a glycerol sensor, in which glycerol dehydrogenase was immobilized, has been developed for the determination of glycerol in wine [23]. NADH produced by the enzyme was monitored with a platinum electrode.
4 Summary
Enzymes, due to their specificity and sensitivity, are valuable analytical devices for quantitating compounds that are enzyme substrates, activators, or inhibitors. In enzyme-catalyzed reactions, the enzyme and substrate are mixed under specific conditions (pH, temperature, ionic strength, substrate concentration, and enzyme concentrations). Changes in these conditions can affect the reaction rate of the enzyme and thereby the outcome of the assay. The enzymatic reaction is followed by measuring either the amount of product generated or the disappearance of the substrate. Applications for enzyme analyses will increase as a greater number of enzymes are purified and become commercially available. In some cases, gene amplification techniques will make enzymes available that are not naturally found in great enough amounts to be used analytically. The measurement of enzyme activity is useful in assessing food quality and as an indication of the adequacy of heat processes such as pasteurization and blanching. In the future, as in-line process control (to maximize efficiencies and drive quality developments) in the food industry becomes more important, immobilized enzyme sensors, along with microprocessors, will likely play a prominent role.
5 Study Questions
-
1.
The Michaelis–Menten equation mathematically defines the hyperbolic nature of a plot relating reaction velocity to substrate concentration for an enzyme-mediated reaction. The reciprocal of this equation gives the Lineweaver–Burk formula and a straight-line relationship as shown below.
$$\frac{1} {{\nu }_{0}} = \frac{{K}_{m}} {{V }_{m}} \frac{1} {[\mathrm{S}]} + \frac{1} {{V }_{m}}$$-
(a)
Define what νo, K m, V m, and [S] refer to in the Lineweaver–Burk formula.
-
(b)
Based on the components of the Lineweaver–Burk formula, label the y-axis, x-axis, slope, and y-intercept on the plot.
-
(c)
What factors that control or influence the rate of enzyme reactions affect K m and V m?
-
(a)
νo
K m
V m
[S]
-
(b)
-
(c)
K m
V m
-
(a)
-
2.
Explain, on a chemical basis, why extremes of pH and temperature can reduce the rate of enzyme-catalyzed reactions.
-
3.
Differentiate among competitive, noncompetitive, and uncompetitive enzyme inhibitors.
-
4.
You believe that the food product you are working with contains a specific enzyme inhibitor. Explain how you would quantitate the amount of enzyme inhibitor (I) present in an extract of the food. The inhibitor (I) in question can be purchased commercially in a purified form from a chemical company. The inhibitor is known to inhibit the specific enzyme E, which reacts with the substrate S to generate product P, which can be quantitated spectrophotometrically.
-
5.
What methods can be used to quantitate enzyme activity in enzyme-catalyzed reactions?
-
6.
What is a coupled reaction, and what are the concerns in using coupled reactions to measure enzyme activity? Give a specific example of a coupled reaction used to measure enzyme activity.
-
7.
Explain how d-malic acid can be quantitated by an enzymatic method to test for adulteration of apple juice.
-
8.
Why is the enzyme peroxidase often quantitated in processing vegetables?
-
9.
Explain the purpose of testing for phosphatase activity in the dairy industry, and explain why it can be used in that way.
-
10.
The falling number value often is one of the quality control checks in processing cereal-based products. What is the falling number test, and what information does it provide? What other tests could be used to assay this quality factor?
-
11.
Explain how glucose can be quantitated using a specific immobilized enzyme.


References
Powers JR, Whitaker JR (1977) Effect of several experimental parameters on combination of red kidney bean (Phaseolus vulgaris) α-amylase inhibitor with porcine pancreatic α-amylase. J Food Biochem 1:239
Whitaker JR (1985) Analytical uses of enzymes. In: Gruenwedel D, Whitaker JR (eds) Food Analysis. Principles and Techniques, vol 3. Biological Techniques, Marcel Dekker, New York, pp 297–377
Bernfeld P (1955) Amylases, α and β. Methods Enzymol 1:149
Henniger G (2004) Nonindustrial enzyme usage: Enzymes in food analysis. In: Aehle W (ed) Enzymes in Industry, Production and Applications, 2nd edn, Wiley-VCH Verlag GmbH & Co. Weinheim, Germany, pp 322–334
Bergmeyer HU (1983) Methods of Enzymatic Analysis. Academic Press, New York
Beutler H (1984) A new enzymatic method for determination of sulphite in food. Food Chem 15:157
Raabo E, Terkildsen TC (1960) On the enzyme determination of blood glucose. Scand J Clin Lab Invest 12:402
Beutler H, Wurst B (1990) A new method for the enzymatic determination of d-malic acid in foodstuffs. Part I: Principles of the Enzymatic Reaction. Deutsche Lebensmittel-Rundschau 86:341
USDA (1975) Enzyme inactivation tests (frozen vegetables). Technical inspection procedures for the use of USDA inspectors. Agricultural Marketing Service, U.S. Department of Agriculture, Washington, DC
Williams DC, Lim MH, Chen AO, Pangborn, RM, Whitaker JR (1986) Blanching of vegetables for freezing – Which indicator enzyme to use. Food Technol 40(6): 130.
Surrey K (1964) Spectrophotometric method for determination of lipoxidase activity. Plant Physiology 39:65
Zhang Q, Cavalieri, RP, Powers JR, Wu J (1991) Measurement of lipoxygenase activity in homogenized green bean tissue. J Food Sci 56:719
Murthy GK, Kleyn DH, Richardson T, Rocco RM (1992) Phosphatase methods. In: Richardson GH (ed) Standard methods for the examination of dairy products, 16th edn. American Public Health Association, Washington, DC, p. 413
Rocco R (1990) Fluorometric determination of alkaline phosphatase in fluid dairy products: Collaborative study. J Assoc Off Anal Chem 73:842
Davis CE (1998) Fluorometric determination of acid phosphatase in cooked, boneless, nonbreaded broiler breast and thigh meat. J AOAC Int 81:887
AACC International (2010) Approved methods of analysis, 11th edn. (online), American Association of Cereal Chemists, St. Paul, MN
Christen GL, Marshall RT (1984) Selected properties of lipase and protease of Pseudomonas fluorescens 27 produced in 4 media. J Dairy Sci 67:1680
Kim SM, Zayas JF (1991) Comparative quality characteristics of chymosin extracts obtained by ultrasound treatment. J Food Sci 56:406
Reyes J, Cavalieri RP (2003) Biosensors. In: Heldman DR (ed) Encyclopedia of agricultural, food, and biological engineering, Marcel Dekker, New York, pp 119–123
Guilbault GG, Lubrano GJ (1972) Enzyme electrode for glucose. Anal Chim Acta 60:254
Borisov SM, Wolbeis OS (2009) Optical biosensors. Chem Rev 108:423
Shimizu Y, Morita K (1990) Microhole assay electrode as a glucose sensor. Anal Chem 62:1498
Matsumoto K (1990) Simultaneous determination of multicomponent in food by amperometric FIA with immobilized enzyme reactions in a parallel configuration. In: Schmid RD (ed) Flow injection analysis (FIA) based on enzymes or antibodies, GBF monographs, vol 14. VCH Publishers, New York, pp 193–204
Author information
Authors and Affiliations
Corresponding author
Rights and permissions
Copyright information
© 2010 Springer Science+Business Media, LLC
About this chapter
Cite this chapter
Powers, J.R. (2010). Application of Enzymes in Food Analysis. In: Food Analysis. Food Analysis. Springer, Boston, MA. https://doi.org/10.1007/978-1-4419-1478-1_16
Download citation
DOI: https://doi.org/10.1007/978-1-4419-1478-1_16
Published:
Publisher Name: Springer, Boston, MA
Print ISBN: 978-1-4419-1477-4
Online ISBN: 978-1-4419-1478-1
eBook Packages: Chemistry and Materials ScienceChemistry and Material Science (R0)