
Abstract
Vitamins are defined as relatively low-molecular-weight compounds which humans, and for that matter, any living organism that depends on organic matter as a source of nutrients, require small quantities for normal metabolism. With few exceptions, humans cannot synthesize most vitamins and therefore need to obtain them from food and supplements. Insufficient levels of vitamins result in deficiency diseases [e.g., scurvy and pellagra, which are due to the lack of ascorbic acid (vitamin C) and niacin, respectively].
Access provided by Autonomous University of Puebla. Download chapter PDF
Keywords
These keywords were added by machine and not by the authors. This process is experimental and the keywords may be updated as the learning algorithm improves.
1 Introduction
1.1 Definition and Importance
Vitamins are defined as relatively low-molecular-weight compounds which humans, and for that matter, any living organism that depends on organic matter as a source of nutrients, require small quantities for normal metabolism. With few exceptions, humans cannot synthesize most vitamins and therefore need to obtain them from food and supplements. Insufficient levels of vitamins result in deficiency diseases [e.g., scurvy and pellagra, which are due to the lack of ascorbic acid (vitamin C) and niacin, respectively].
1.2 Importance of Analysis
Vitamin analysis of food and other biological samples has played a critical role in determining animal and human nutritional requirements. Furthermore, accurate food composition information is required to determine dietary intakes to assess diet adequacy and improve human nutrition worldwide. From the consumer and industry points of view, reliable assay methods are required to ensure accuracy of food labeling. This chapter provides an overview of techniques for analysis of the vitamin content of food and some of the problems associated with these techniques. Please note that the sections below on bioassay, microbiological, and chemical methods are not comprehensive, but rather just give examples of each type of analysis.
1.3 Vitamin Units
When vitamins are expressed in units of mg or μg per tablet or food serving, it is very easy to grasp how much is present. Vitamins can also be expressed as international units (IU), United States Pharmacopeia (USP) units, and % Daily Value (DV). To many, these definitions are unclear. When analysis of a foodstuff or dietary supplement is required for its content of vitamins, as might be the case for labeling and quality control purposes, being able to report the findings on different bases becomes important.
The IU is a unit of measurement for the amount of a substance, based on measured biological activity or effect. It is used for vitamins, hormones, vaccines, and similar biologically active substances. The precise definition of 1 IU differs from substance to substance, but has been established by international agreement for each substance. There is no equivalence among different substances; that is, 1 IU or USP unit of vitamin E does not contain the same number of micrograms as 1 IU or USP unit of vitamin A. Although IUs are still employed in food fortification and for nutrition labeling in the US (e.g., dietary supplements), many regulators feel that their use should be abandoned.
Concerning vitamin E, the USP discontinued the use of the IU in the US after 1980 and replaced it with USP units derived from the same biological activity values as the IU. Thus, 1 USP unit is defined as the activity of 1 mg of all-rac-α-tocopheryl acetate on the basis of biological activity measured by the rat fetal resorption assay. This equals the activity of 0.67 mg of RRR-α-tocopherol or 0.74 mg of RRR-α-tocopheryl acetate. Biological activities relative to RRR-α-tocopherol have been a convenient way to compare the different forms of vitamin E on the basis of IU or USP units, and were used to calculate milligram α-tocopherol equivalent (mg α-TE) values for reporting vitamin E contents. As vitamin E is available in different forms, conversion factors have been established (1) (Table 11-1).
Some other IU definitions for vitamins include the following:
-
1 IU of vitamin A is the biological equivalent of 0. 3 μg retinol, 0. 6 μg β-carotene, and 1. 2 μg of other provitamin A active carotenoids (e.g., α-carotene and β-cryptoxanthin). One retinol equivalent (RE) is defined as 1 μg of all-trans-retinol. Varying dietary sources of vitamin A have different potencies. For calculation of RE values in foods, 100% efficiency of absorption of all-trans-retinol is assumed; however, incomplete absorption and conversion of β-carotene as well as other provitamin A active carotenoids must be taken into account. The conversion factors of 1 RE equals 6 μg and 12 μg for β-carotene and other provitamin A active carotenoids, respectively, are applied. A more recent international standard of measure of vitamin A established by the Institute of Medicine of the National Academies is to report μg retinol activity equivalents (RAE). For example, 2 μg of β-carotene in oil provided as a supplement can be converted by the body to 1 μg of retinol giving it an RAE ratio of 2:1, whereas 12 μg of all-trans-β-carotene from foods are required to provide the body with 1 μg of retinol giving dietary β-carotene an RAE ratio of 12:1. Other provitamin A carotenoids in foods are less easily absorbed than β-carotene resulting in RAE ratios of 24:1. So in food, unlike a dietary supplement, there is no direct comparison between an IU and μg RE or RAE. As a guide to convert IUs of vitamin A to μg RE, multiply the number of IUs by 0.1 if the food is of plant origin and by 0.2 if it is of animal origin. The result will be the approximate number of μg RE in the food.
-
1 IU of vitamin C is the biological equivalent of 50 μg l-ascorbic acid.
-
1 IU of vitamin D is the biological equivalent of 0. 025 μg cholecalciferol/ergocalciferol.
The % Daily Value (DV) is a newer dietary reference value designed to help consumers to use label information to plan a healthy overall diet (see also Chap. 3). The DVs are reference numbers based on Recommended Dietary Allowances (RDAs) established by the Food and Nutrition Board of the Institute of Medicine. On food labels, the numbers tell you the % DV that one serving of this food provided as a percentage of established standards. In fact, DVs actually comprise two sets of reference values for nutrients: Daily Reference Values, or DRVs, and Reference Daily Intakes, or RDIs. The % DV is based on a 2000-Calorie diet for adults older than 18.
2 Methods
2.1 Overview
Vitamin assays can be classified as follows:
-
1.
Bioassays involving humans and animals.
-
2.
Microbiological assays making use of protozoan organisms, bacteria, and yeast.
-
3.
Physicochemical assays that include spectrophotometric, fluorometric, chromatographic, enzymatic, immunological, and radiometric methods.
In terms of ease of performance, but not necessarily with regard to accuracy and precision, the three systems follow the reverse order. It is for this reason that bioassays, on a routine basis at least, are limited in their use to those instances in which no satisfactory alternative method is available.
The selection criteria for a particular assay depend on a number of factors, including accuracy and precision, but also economic factors and the sample load to be handled. Applicability of certain methods for a particular matrix also must be considered. It is important to bear in mind that many official methods presented by regulatory agencies are limited in their applicability to certain matrices, such as vitamin concentrates, milk, or cereals, and thus cannot be applied to other matrices without some procedural modifications, if at all.
On account of the sensitivity of certain vitamins to adverse conditions such as light, oxygen, pH, and heat, proper precautions need to be taken to prevent any deterioration throughout the analytical process, regardless of the type of assay employed. Such precautionary steps need to be followed with the test material in bioassays throughout the feeding period. They are required with microbiological and physicochemical methods during extraction as well as during the analytical procedure.
Just as with any type of analysis, proper sampling and subsampling as well as the preparation of a homogeneous sample are critical aspects of vitamin analysis. General guidelines regarding this matter are provided in Chap. 5 of this book.
The principles, critical points, procedures, and calculations for various vitamin analysis methods are described in this chapter. Many of the methods cited are official methods of AOAC International (2), the European Committee for Standardization (3–10), or the US Pharmacopeial Convention (11). Refer to these methods and other original references cited for detailed instructions on procedures. A summary of commonly used regulatory methods is provided in Table 11-2. The sections below on bioassay, microbiological, and chemical methods are not comprehensive, but rather just give examples of each type of analysis.
2.2 Extraction Methods
With the exception of some biological feeding studies, vitamin assays in most instances involve the extraction of a vitamin from its biological matrix prior to analysis. This generally includes one or several of the following treatments: heat, acid, alkali, solvents, and enzymes.
In general, extraction procedures are specific for each vitamin and designed to stabilize the vitamin. In some instances, some procedures are applicable to the combined extraction of more than one vitamin, for example, for thiamin and riboflavin as well as some of the fat-soluble vitamins (1, 2, 13). Typical extraction procedures are as follows:
-
Ascorbic acid: Cold extraction with metaphosphoric acid/acetic acid.
-
VitaminB 1 andB 2 : Boiling or autoclaving in acid plus enzyme treatment.
-
Niacin: Autoclaving in acid (noncereal products) or alkali (cereal products).
-
Folate: Enzyme extraction with α-amylase, protease and γ-glutamyl hydrolase(conjugase)
-
Vitamins A, E, or D: Organic solvent extraction, saponification, and re-extraction with organic solvents. For unstable vitamins such as these, antioxidants are routinely added to inhibit oxidation.
Analysis of fat-soluble vitamins may require saponification, generally either overnight at room temperature or by refluxing at 70∘C. In the latter case, an air-cooled reflux vessel as depicted in Fig. 11-1 provides excellent control of conditions conducive to oxidation.


Reflux vessel useful for saponification.
2.3 Bioassay Methods
Outside of vitamin bioavailability studies, bioassays at the present are used only for the analysis of vitaminsB 12 and D. For the latter, it is the reference standard method of analysis of food materials (AOAC Method 936.14), known as the line test (Fig. 11-2), based on bone calcification. Because the determination of vitamin D involves deficiency studies as well as sacrificing the test organisms, it is limited to animals rather than humans as test organisms.


The bioassay of vitamin D by the line test, AOAC Method 936.14, 45.3.01 (2).
2.4 Microbiological Assays
2.4.1 Applications
Microbiological assays are limited to the analysis of water-soluble vitamins. The methods are very sensitive and specific for each vitamin. The methods are somewhat time consuming, and strict adherence to the analytical protocol is critical for accurate results. All microbiological assays can use microtiter plates (96-well) in place of test tubes. Microplate usage results in significant savings in media and glassware, as well as labor.
2.4.2 Principle
The growth of microorganisms is proportional to their requirement for a specific vitamin. Thus, in microbiological assays the growth of a certain microorganism in an extract of a vitamin-containing sample is compared against the growth of this microorganism in the presence of known quantities of that vitamin. Bacteria, yeast, or protozoans are used as test organisms. Growth can be measured in terms of turbidity, acid production, gravimetry, or by respiration. With bacteria and yeast, turbidimetry is the most commonly employed system. If turbidity measurements are involved, clear sample and standard extracts vs. turbid ones, are essential. With regard to incubation time, turbidity measurement is also a less time-consuming method. The microorganisms are specified by ATCCTM numbers and are available from the American Type Culture Collection (ATCCTM) (12301 Parkway Drive, Rockville, MD 20852).
2.4.3 Niacin
The procedural sequence for the microbiological analysis of niacin is outlined in Fig. 11-3 (AOAC Method 944.13, 45.2.04) (2, 14). Lactobacillus plantarum ATCCTM 8014 is the test organism. A stock culture needs to be prepared and maintained by inoculating the freeze-dried culture on Bacto Lactobacilli agar followed by incubation at 37∘C for 24 h prior to sample and standard inoculation. A second transfer may be advisable in the case of poor growth of the inoculum culture.


The microbiological assay of niacin, AOAC Method 944.13, 45.2.04 (2).
In general, growth is measured by turbidity. If lactobacilli are employed as the test organism, acidimetric measurements can be used as well. The latter may be necessary if a clear sample extract cannot be obtained prior to inoculation, and incubation (which is a prerequisite for turbidimetry) cannot be obtained. In making a choice between the two methods of measurement, one needs to bear in mind that a prolonged incubation period of 72 h is required for acidimetry.
2.4.4 Folate
Folate is the general term including folic acid (pteroylglutamate, PteGln) and poly-γ-glutamyl conjugates with the biological activity of folic acid. Folates present a diverse array of compounds that vary by oxidation state of the pteridine ring structure, one-carbon moieties carried by the specific folate, and the number of conjugated glutamate residues on the folate. Folates are labile to oxidation, light, thermal losses, and leaching when foods are processed. Because of the presence of multiple forms in food products and its instability, folate presents a rather difficult analytical problem. To account for differences in biological availability of synthetic folic acid used for food fortification and food folate, the Institute of Medicine Panel on Folate, Other B Vitamins and Choline established the dietary folate equivalent (DFE) value (5). Based on research showing that folic acid is 85% bioavailable whereas food folate is only 50%, it can be stated that folic acid in fortified products is 85/50 or 1.7 times more bioavailable than food folate. Therefore, the μg of DFEs provided equals the μg of food folate plus (1. 7 ×μg folic acid). Calculation of the μg DFE for any food requires quantitation of folic acid as a separate entity from food folate. Currently, quite sophisticated liquid chromatography methods are necessary for accurate quantitation of folic acid and the multiple forms of folates in foods. A collaborated microbiological procedure based on the trienzyme extraction quantifies only total folate and cannot differentiate between added folic acid and food folate. The microbiological assay for total food folate with Lactobacillus casei (spp. rhamnosus) ATCCTM 7469 and trienzyme digestion follows AOAC International (2, 15).
2.4.4.1 Principle
Folate in the sample is extracted with a buffer at 100∘C (boiling water bath). The extract is then digested with α-amylase and protease (i.e., to free macromolecularly bound folates) and conjugase (i.e., to cleave poly-γ-glutamyl folates to PteGln3 or lower.) Growth response of the assay microorganism is measured by percent transmittance. Transmittance depends on folate concentration.
2.4.4.2 Critical Points
Care must be exercised to protect labile folates from oxidation and photochemical degradation. Reducing agents including ascorbic acid, β-mercaptoethanol, and dithiothreitol are effective in preventing oxidation. Strict adherence to microbiological assay techniques is necessary to assay folate with accuracy and precision.
2.4.4.3 Procedure
Analysis of food folate by Lactobacillus casei (spp. rhamnosus) ATCCTM 7469 and a trienzyme extraction procedure (Fig. 11-4) is provided by AOAC International (2). The analytical protocol has also been easily adapted using 96-well microtiter plates and a reader (16).


Analysis of folate in cereals and cereal products or other foods using Lactobacillus casei (spp. rhamnosus) ATCCTM 7469 and a trienzyme extraction procedure (2).
2.4.4.4 Calculations
Results are calculated manually or from the regression line of the standard curve responses using 4th degree polynomial plots and a computer program written to conform to the AOAC microbiological analysis protocol. Software provided for microplate readers is suitable for calculating results from analyses using 96-well microplates. Results are reported as micrograms of vitamin per 100 g or per serving.
2.5 Chemical Methods
2.5.1 Vitamin A
Vitamin A is sensitive to ultraviolet (UV) light, air (and any prooxidants, for that matter), high temperatures, and moisture. Therefore, steps must be taken to avoid any adverse changes in this vitamin due to such effects. Steps include using low actinic glassware, nitrogen, and/or vacuum, as well as avoiding excessively high temperatures. The addition of an antioxidant at the onset of the procedure is highly recommended. High-performance liquid chromatographic (HPLC) methods are considered the only acceptable methods to provide accurate food measurements of vitamin A activity.
Details follow for the HPLC method of vitamin A (i.e., retinol isomers) in milk and milk-based infant formula (AOAC Method 992.04, 50.1.02) (2):
2.5.1.1 Principle
The test sample is saponified with ethanolic KOH, vitamin A (retinol) is extracted into organic solvent and then concentrated. Vitamin A isomers – all-trans-retinol and 13-cis-retinol – levels are determined by HPLC on a silica column.
2.5.1.2 Critical Points
All work must be performed in subdued artificial light. Care must be taken to avoid oxidation of the retinol throughout the entire procedure. Solvent evaporation should be completed under nitrogen, and hexadecane is added to prevent destruction during and after solvent evaporation.
2.5.1.3 Procedure
Figure 11-5 outlines the procedural steps of the assay. Pyrogallol is added prior to saponification as an antioxidant.


The HPLC analysis of vitamin A in milk and milk-based infant formula, AOAC Method 992.04, 50.1.02 (2).
2.5.1.4 Calculations
where:
where:
2.5.2 Vitamin E (Tocopherols and Tocotrienols)
2.5.2.1 Vitamin E Compounds
Vitamin E is present in foods as eight different compounds: all are 6-hydroxychromans. The vitamin E family is comprised of α-, β-, γ-, and δ-tocopherol, characterized by a saturated side chain of three isoprenoid units and the corresponding unsaturated tocotrienols (α-, β-, γ-, and δ-). All homologs in nature are (R, R, R)-isomers. Recently, the Institute of Medicine Panel on Dietary Antioxidants and Related Compounds recommended that human requirements for vitamin E include only the 2R-stereoisomeric forms of α-tocopherol for establishment of recommended intakes (17). For the past two decades human requirements have been stated in terms of α-tocopherol equivalents.
Details follow of vitamin E analysis in food products using HPLC (18):
2.5.2.2 Principle
-
1.
General food products. The sample is saponified under reflux (see Fig. 11-1), extracted with hexane, and injected onto a normal phase HPLC column connected to a fluorescence detector, E x λ = 290 nm, E m λ = 330 nm (Ex, excitation; Em, emission; see Chap. 22, Sect. 22.3).
-
2.
Margarine and vegetable oil spreads. The sample is dissolved in hexane, anhydrous MgSO4 is added to remove water, and the filtered extracts are assayed by HPLC.
-
3.
Oils. Oil is dissolved in hexane and injected directly onto the HPLC column.
2.5.2.3 Critical Points
Vitamin E is subject to oxidation. Therefore, saponification is completed under reflux, in the presence of the antioxidant, pyrogallol, with the reaction vessel protected from light.
2.5.2.4 Procedure
The vitamin E assay is detailed in Fig. 11-6 and an example chromatogram is depicted in Fig. 11-7.


Chromatogram of rice bran oil showing tocopherols and tocotrienols.


Chemical reaction between L-ascorbic acid and the indicator dye, 2,6-dichloroindophenol.
2.5.2.5 Calculation
Vitamin E is quantitated by external standards from peak area by linear regression.
2.5.3 Vitamin C
The vitamin ( L-ascorbic acid and L-dehydroascorbic acid) is very susceptible to oxidative deterioration, which is enhanced by high pH and the presence of ferric and cupric ions. For these reasons, the entire analytical procedure needs to be performed at low pH and, if necessary, in the presence of a chelating agent.
Mild oxidation of ascorbic acid results in the formation of dehydroascorbic acid, which is also biologically active and is reconvertible to ascorbic acid by treatment with reducing agents such as β-mercaptoethanol and dithiothreitol.
2.5.3.1 2,6-Dichloroindophenol Titrimetric Method (AOAC Method 967.21, 45.1.14) (2, 9)
-
1.
Principle. l-ascorbic acid is oxidized to l-dehydroascorbic acid by the oxidation–reduction indicator dye, 2,6-dichloroindophenol. At the endpoint, excess unreduced dye appears rose-pink in acid solution (see Fig. 11-8).
-
2.
Procedure. Figure 11-9 outlines the protocol followed for this method. In the presence of significant amounts of ferrous Fe, cuprous Cu, and stannous Sn ions in the biological matrix to be analyzed, it is advisable to include a chelating agent such as ethylenediaminetetraacetic acid (EDTA) with the extraction to avoid overestimation of the ascorbic acid content.
Fig. 11-9 The light but distinct rose-pink endpoint should last more than 5 s to be valid. With colored samples such as red beets or heavily browned products, the endpoint is impossible to detect by human eyes. In such cases it, therefore, needs to be determined by observing the change of transmittance using a spectrophotometer with the wavelength set at 545 nm.
-
3.
Calculations.
$$\begin{array}{rcl} & & \mbox{ mg of ascorbic acid}/\mbox{ g or ml of sample} \\ & & \quad = (X - B) \times (F/E) \times (V/Y ) \end{array}$$(3)where:
$$\begin{array}{rcl} X& =& \mbox{ average ml for test solution titration} \\ B& =& \mbox{ average ml for test blank titration} \\ F& =& \mbox{ mg ascorbic acid equivalents to 1.0-ml} \\ & & \mbox{ indophenol standard solution} \\ E& =& \mbox{ sample weight (g) or volume (ml)} \\ V & =& \mbox{ volume of initial test solution} \\ Y & =& \mbox{ volume of test solution titrated} \\ \end{array}$$


Note. The (V ∕ Y ) term represents the dilution factor employed.
2.5.3.2 Microfluorometric Method (AOAC Method 967.22, 45.1.15) (2, 19)
-
1.
Principle. This method measures both ascorbic acid and dehydroascorbic acid. Ascorbic acid, following oxidation to dehydroascorbic acid, is reacted with o-phenylenediamine to produce a fluorescent quinoxaline compound.
-
2.
Procedure. The procedural sequences for this method are outlined in Fig. 11-10. To compensate for the presence of interfering extraneous material, blanks need to be run using boric acid prior to the addition of the o-phenylenediamine solution.
-
3.
Calculations.
$$\begin{array}{rcl} & & \mbox{ mg of ascorbic acid}/\mathrm{g\ or\ ml} \\ & & \quad = \left [(X - D)/(C - B)\right ] \times S \times (\mathrm{DF}/E) \end{array}$$(4)where:
$$\begin{array}{rcl} X\mbox{ and }C& =& \mbox{ average fluorescence of} \\ & & \mbox{ sample and standard, respectively} \\ D\mbox{ and }B& =& \mbox{ average fluorescence of sample} \\ & & \mbox{ blank and standard blank,} \\ & & \mbox{ respectively} \\ S& =& \mbox{ concentration of standard in mg/ml} \\ \mathrm{DF}& =& \mbox{ dilution factor} \\ E& =& \mbox{ sample weight, g, or sample} \\ & & \mbox{ volume, ml} \\ \end{array}$$


2.5.4 Thiamin (Vitamin B 1) in Foods, Thiochrome Fluorometric Procedure (AOAC Method 942.23) (2)
2.5.4.1 Principle
Following extraction, enzymatic hydrolysis of thiamin’s phosphate esters and chromatographic cleanup (i.e., purification), this method is based on the fluorescence measurement of the oxidized form of thiamin, thiochrome, in the test solution compared to that from an oxidized thiamin standard solution.
2.5.4.2 Critical Points
Thiochrome is light sensitive. Therefore, the analytical steps following the oxidation must be performed under subdued light. Thiamin is sensitive to heat, especially at alkaline pH. The analytical steps beginning with the oxidation of thiamin through to the fluorescence measurement (Fig. 11-11) must be carried out rapidly and precisely according to the instructions.


2.5.4.3 Procedure
Figure 11-11 outlines the procedural sequence of the thiamin analysis. The enzymatic treatment and subsequent chromatographic cleanup may not be necessary with certain matrices, such as vitamin concentrates that contain nonphosphorylated thiamin and no significant amounts of substances that could interfere with the determination.
2.5.4.4 Calculations
where:
where:
2.5.5 Riboflavin (Vitamin B 2) in Foods and Vitamin Preparations, Fluorometric Method (AOAC Method 970.65, 45.1.08) (2)
2.5.5.1 Principle
Following extraction, cleanup, and compensation for the presence of interfering substances, riboflavin is determined fluorometrically.
2.5.5.2 Critical Points
Due to the extreme sensitivity of the vitamin to UV radiation, all operations need to be conducted under subdued light. The analyst also needs to be aware that exact adherence to the permanganate oxidation process is essential for reliable results.
2.5.5.3 Procedure
An outline of the procedural protocol for this analysis is shown in Fig. 11-12. In spite of the fact that riboflavin is classified as a water-soluble vitamin, it does not readily dissolve in water. When preparing the standard solution, the analyst must pay special attention and ensure that the riboflavin is completely dissolved.


Analysis of riboflavin (vitamin B2) by fluorescence, AOAC Method 970.65, 45.1.08 (2).
2.5.5.4 Calculations
where:
Note. Value of [(B − C) ∕ (X − B)] must be ≥ 0. 66and ≤ 1. 5)
where:
3 Comparison of Methods
Each type of method has its advantages and disadvantages. In selecting a certain method of analysis for a particular vitamin or vitamins, a number of factors need to be considered, some of which are listed below:
-
1.
Method accuracy and precision.
-
2.
The need for bioavailability information.
-
3.
Time and instrumentation requirements.
-
4.
Personnel requirements.
-
5.
The type of biological matrix to be analyzed.
-
6.
The number of samples to be analyzed.
-
7.
Regulatory requirements – Must official AOAC International methods be used?
Bioassays are extremely time consuming. Their employment is generally limited to those instances in which no suitable alternate method is available, or for cases in which bioavailability of the analyte is desired, especially if other methods have not been demonstrated to provide this information. Bioassays have the advantage that they sometimes do not require the preparation of an extract, thus eliminating the potential of undesirable changes of the analyte during the extract preparation. On the other hand, in the case of deficiency development requirements prior to analysis, bioassays are limited to animals rather than humans.
Both microbiological and physicochemical methods require vitamin extraction (i.e., solubilization prior to analysis). In general, the results obtained through these methods represent the total content of a particular vitamin in a certain biological matrix, such as food, and not necessarily its bioavailability to humans.
The applicability of microbiological assays is limited to water-soluble vitamins, and most commonly applied to niacin, B12, and pantothenic acid. Though somewhat time consuming, they generally can be used for the analysis of a relatively wide array of biological matrices without major modifications. Furthermore, less sample preparation is often required compared to physicochemical assays.
Because of their relative simplicity, accuracy, and precision, the physicochemical methods, in particular the chromatographic methods using HPLC, are preferred. For example, standard HPLC is commonly employed as an official method of analysis for vitamins A, E, and D, and as a quality control method for vitamin C. While HPLC involves a high capital outlay, it is applicable to most vitamins and lends itself in some instances to simultaneous analysis of several vitamins and/or vitamers (i.e., isomers of vitamins). Implementation of multianalyte procedures for the analysis of water-soluble vitamins can result in assay efficiency with savings in time and materials. To be useful, a simultaneous assay must not lead to loss of sensitivity, accuracy, and precision when compared to single analyte methods. In general terms, multianalyte methods for water-soluble vitamin assay of high concentration products including pharmaceuticals, supplements, and vitamin premixes are quite easily developed. Though the applicability of HPLC has been demonstrated to a wide variety of biological matrices with no or only minor modifications in some cases, one must always bear in mind that all chromatographic techniques, including HPLC, are separation and not identification methods. Therefore, during adaptation of an existing HPLC method to a new matrix, establishing evidence of peak identity and purity is an essential step of the method adaptation or development.
Over the past decade, liquid chromatography in combination with mass spectrometry (MS) (see Chap. 26) has added a new dimension to vitamin analysis. In general, LC–MS methods are now available for each fat- and water-soluble vitamin. Detection by MS leads to increased sensitivity as well as unequivocal identification and characterization of the vitamin. The LC–MS assays are rapidly becoming a mainstay of accurate, cost-effective vitamin analyses. For example, LC–MS is commonly employed for verification of vitamin D content of products with difficult matrices (i.e., comparing results to those with standard LC analysis), and LC–MS/MS for folate (vs. the microbiological method). The reader is referred to reference (12) for applications of LC–MS to specific vitamins.
When selecting a system for analysis, at least initially, it is wise to consider the use of official methods that have been tested through interlaboratory studies and that are published by such organizations as AOAC International (2), the European Committee for Standardization (3–10), the US Pharmacopeial Convention (11), or the AACC International (21). Again, one must realize that these methods are limited to certain biological matrices.
4 Summary
The three most used types of methods for the analysis of vitamins – bioassays and microbiological and physicochemical assays – have been outlined in this chapter. They are, in general, applicable to the analysis of more than one vitamin and several food matrices. However, the analytical procedures must be properly tailored to the analyte in question and the biological matrix to be analyzed; issues concerning sample preparation, extraction, and quantitative measurements are also involved. It is essential to validate any new application appropriately by assessing its accuracy and precision. Method validation is especially important with chromatographic methods such as HPLC, because these methods basically accent separations rather than identification of compounds. For this reason, it is essential to ensure not only identity of these compounds but also, just as important, their purity.
5 Study Questions
-
1.
What factors should be considered in selecting the assay for a particular vitamin?
-
2.
To be quantitated by most methods, vitamins must be extracted from foods. What treatments are commonly used to extract the vitamins? For one fat-soluble vitamin and one water-soluble vitamin, give an appropriate extraction procedure.
-
3.
What two vitamins must be listed on the standard nutritional label?
-
4.
The standard by which all chemical methods to measure vitamin D content are compared is a bioassay method. Describe this bioassay method.
-
5.
Explain why it is possible to use microorganisms to quantitate a particular vitamin in a food product, and describe such a procedure.
-
6.
Niacin and folate both can be quantitated by microbiological methods. What extra procedures and precautions are necessary in the folate assay compared to the niacin assay, and why?
-
7.
There are two commonly used AOAC methods to measure the vitamin C content of foods. Identify these two methods; then compare and contrast them with regard to the principles involved.
-
8.
Would the vitamin C content as determined by the 2,6-dichloroindophenol method be underestimated or overestimated in the case of heat processed juice samples? Explain your answer.
-
9.
What are the advantages and disadvantages of using HPLC for vitamin analysis?
-
10.
Vitamin contents can be presented as units of mg or μg, as International Units (IU), or as % DV. Discuss the differences between these approaches for reporting the result.
6 Practice Problems
-
1.
A 3.21-g tuna sample (packed in water and drained before sampling) was analyzed for its niacin content. The sample was digested in 50 ml of 1 N H2SO4. After dissolved protein was removed by precipitation according to the AOAC method, a 20-ml aliquot was diluted to 100 ml, and then a 25-ml aliquot of the intermediate solution was taken and diluted to 250 ml. The concentration of niacin in the working solution was determined to be 0. 168 μg∕ml. (a) How much niacin is present in the tuna sample, and (b) how closely does this value compare with that provided in the USDA Nutrient Database for Standard Reference (i.e., fish, tuna, light, canned in water, drained solids)?
-
2.
Vitamin C in a nutraceutical formulation was assayed using the 2,6-dichloroindophenol titrimetric method. Determine the concentration of vitamin C (mg/g) in the nutraceutical based on the data given below from the assay.
-
Sample weight. 101.7 g, diluted to 500 ml with HPO3/HOAc solution and filtered
-
Volume of sample filtrate titrated: 25 ml
-
Volume of dye used for the test solution titration: 9.2 ml
-
Volume of dye used for the test blank titration: 0.1 ml
-
mg ascorbic acid equivalents to 1.0 ml of indophenol standard solution: 0.175 mg/ml
-
-
3.
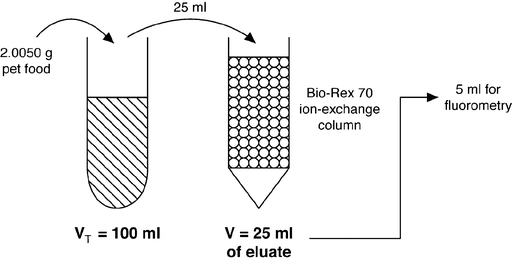
Thiamin in a pet food sample was analyzed using the AOAC fluorometric method. Based on the assay conditions described below, determine the concentration of thiamin (μg∕g) in the original pet food sample.
-
Sample weight. 2.0050 g
-
Dilutions. Diluted sample to 100 ml, applied 25 ml onto the Bio-Rex 70 ion-exchange column, then diluted the eluate to 25 ml and used 5 ml for fluorometry
-
Concentration of thiamin ⋅HCl standard working solution: 0. 1 μg∕ml
-
Fluorometry reading ratio: 0.850
-
-
4.
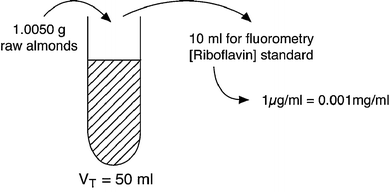
Riboflavin in raw almonds was analyzed using the AOAC fluorometric method. Based on the assay conditions described below, (a) determine the concentration of riboflavin (mg/g) in the almonds and (b) how closely this value compares with that provided in the USDA Nutrient Database for Standard Reference.
-
Sample weight: 1.0050 g
-
Dilutions: to 50 ml; used 10 ml for fluorometry
-
Fluorometry readings: B60∕X85∕C10
-
Concentration or riboflavin standard solution: 1 μg∕ml
-
-
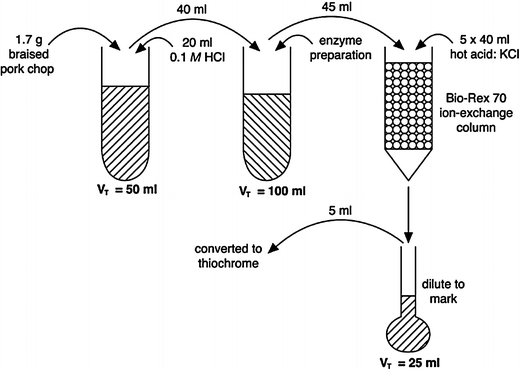
5.
1.7 g of a braised, loin pork chop was analyzed for thiamin. The sample was digested with 20 ml of 0.1 M HCl and then diluted to 50 ml. A 40-ml aliquot of the digest was treated with the enzyme preparation and eventually diluted to 100 ml. A 45-ml aliquot of the enzyme-treated filtrate was purified using a Bio-Rex 70 ion-exchange column. The analyte from the 45-ml aliquot was applied to the column and recovered with five 4.0-ml portions of hot acid-KCl solution. The portions were pooled in a 25-ml volumetric flask and diluted to mark. A 5-ml aliquot as well as appropriate blanks and standard (concentration = 1 μg∕ml) were converted to thiochrome and measured spectrofluorometrically. The following results were found:
-
Fluorescent intensity of the oxidized test sample and blank were 62.8 and 7.3, respectively
-
Fluorescent intensity of the thiamin ⋅HCl standard and blank were 60.4 and 5.2, respectively
Determine (a) how many μg of thiamin are in 5 ml of the test solution; (b) how many μg of thiamin/g braised loin pork chop; (c) how the answer from (b) compares with that reported in the USDA Nutrient Database for Standard Reference.
-
-
6.
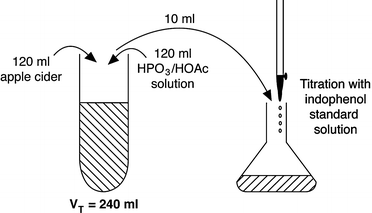
A graduate student is analyzing the antioxidant activity of phenolic compounds in apple juice samples and purchases some apple cider from a Farmer’s market. The student worries that the product might have been fortified with ascorbic acid, and if so, will mess up his antioxidant assay. So, a vitamin C analysis is conducted by the 2,6-dichloroindophenol titrimetric method. 120 ml of the apple cider was mixed with 120 ml of the HPO3 ∕ HOAc solution. In triplicate, a 10-ml aliquot of the resultant solution was taken and titrated against the indophenol standard solution. The following results were found:
-
An average of 13.3 and 0.1 ml of the indophenol standard was consumed during titration of the test sample and blank, respectively
-
From preliminary work it was determined that 0.1518 mg of ascorbic acid was equivalent to 1.0 ml of indophenol standard solution
Determine (a) how many mg of ascorbic acid/ml of apple cider; (b) how do these results compare to tinned or bottled fresh apple juice according to the USDA Nutrient Database for Standard Reference; (c) has the apple cider been fortified with vitamin C; and (d) can this apple cider sample be used for the intended antioxidant activity study?
-
-
7.
In the 2,6-dichloroindophenol titrimetric method, the indophenol reagent is prepared by dissolving 50.0 mg of 2,6-dichloroindophenol sodium salt plus some sodium bicarbonate in deionized water to 200 ml. The ascorbic acid standard solution is prepared by dissolving 50.0 mg of USP ascorbic acid reference standard in 50 ml of deionized water. If a 4.5-ml aliquot of the ascorbic acid reference standard is treated with 5.0 ml of the HPO3 ∕ HOAc solution and then titrated against the indophenol reagent, how many milliliters should be consumed? Note: Remember the stoichiometry for the reaction.
-
FW of 2,6-dichloroindophenol sodium salt is 290.08 g/mol
-
FW of ascorbic acid is 176.12 g/mol
-
-
8.
A new infant formula was developed for delivery to a third world country. Unfortunately, the dried infant formula was stored outdoors for 3 months in the sunlight before use and there is fear that the vitamin A has degraded. The reported vitamin A content (expressed as all-trans retinol equivalents) in the formula at the point of shipping was 3. 0 μg∕g dry formula. The following test was performed: 140 g of dry formula (i.e., after 3 months of storage outdoors in the sunlight) were dissolved in water and made up to 1 L. The AOAC method was followed with the following observations:
-
Peak area for the all-trans-retinol in the standard was 934
-
Weight of oil solution used to prepare the working retinol standard was 53 mg
-
Concentration of all-trans-retinol in oil standard solution was 1996 ng/ml
-
Peak area for the test solution after outdoor storage was 89
Determine (a) the concentration (ng/ml) of all-trans-retinol in the rehydrated infant formula; (b) by what percentage has the vitamin A content, expressed as all-trans-retinol, in the dried infant formula degraded?
-
Answers
-
1.
(a) 420 μg in the 3.2-g test portion; (b) there are 13.08 mg niacin/100 g tuna in the test sample. The USDA Nutrient Database for Standard Reference lists a value of 13. 280 ± 0. 711 mg niacin/100 g tuna; so, the values compare well.
Calculations:


-
Niacin present in tuna sample is …
$$\begin{array}{rcl} & & 0.168\, \frac{\mathrm{\mu g}} {\mathrm{ml}}\, \times \,\frac{250\,\mathrm{ml}} {25\,\mathrm{ml}} \, \times \,\frac{100\,\mathrm{ml}} {20\,\mathrm{ml}} \, \times \, 50\,\mathrm{ml} \\ & & \quad = 420\,\mathrm{\mu g}\, =\, 0.420\,\mathrm{mg}\,\mathrm{niacin} \\ \end{array}$$So,
$$\begin{array}{rcl} & & \frac{0.420\,\mathrm{mg}\,\mathrm{niacin}} {3.21\,\mathrm{g}} \\ & & \quad = 0.1308\,\mathrm{mg}/\mathrm{g}\,\mathrm{tuna}\,\mathrm{or}\,\mathrm{13.08}\,\mathrm{mg}\,\mathrm{niacin}/100\,\mathrm{g}\,\mathrm{tuna} \\ \end{array}$$ -
The USDA Nutrient Database for Standard Reference lists a niacin content of 13.28 mg/100 g tuna for “fish, tuna, light, canned in water, drained solids.” Thus, the 13.08 mg niacin/100 g tuna value is very close to the 13.28 mg value reported in the database.
-
2.
0.313 mg ascorbic acid/g nutraceutical


Calculations:
- F :
-
= 0. 175 mg AA eq./ml indophenol standard
- X :
-
= 9. 2 ml of dye for test solution titration
- B :
-
= 0. 1 ml of dye for test blank titration
$$\begin{array}{rcl} & & \mbox{ mg ascorbic acid/g sample} \\ & & \quad = \mathrm{(X - B)} \times \mathrm{(F/E)} \times \mathrm{(V/Y)} \\ & & \quad = \frac{(9.2\,\mathrm{ml} - 0.1\,\mathrm{ml}) \times 0.175\,\mathrm{mg}/\mathrm{ml}} {101.7\,\mathrm{g}} \times \frac{500\,\mathrm{ml}} {25\,\mathrm{ml}} \\ & & \quad = \mbox{ 0.313 mg of ascorbic acid/g nutraceutical} \\ & & \qquad \mbox{ formulation} \\ \end{array}$$
-
3.
0. 8479 μg thiamin/g pet food


Calculations:
-
4.
(a) 9. 95 ×10− 3 mg riboflavin/g raw almonds; (b) there is 0.995 mg riboflavin/100 g raw almonds in the test sample. The USDA Nutrient Database for Standard Reference lists a value of 1. 014 ± 0. 025 mg riboflavin/100 g raw almonds; so, the values compare well.


Calculations:
-
mg of riboflavin/g raw almonds
$$\begin{array}{rcl} & & = \left [ \frac{(B - C)} {\mathrm{(}X - B\mathrm{)}}\right ] \times \frac{\mathrm{CS}} {V } \times \frac{\mathrm{DF}} {\mathrm{WT}} \\ & & = \left [\frac{(60 - 10)} {(85 - 60)}\right ] \times \frac{0.001\,\mathrm{mg}/\mathrm{ml}} {10\,\mathrm{ml}} \times \frac{\mathrm{50}\,\mathrm{ml}} {1.0050\,\mathrm{g}} \\ & & = 9.95 \times 1{0}^{-3}\,\mathrm{mg}\ \mbox{ of riboflavin/g raw almonds} \\ \end{array}$$ -
The USDA Nutrient Database for Standard Reference lists a riboflavin content of 1. 014 ± 0. 025 mg∕100 g for “nuts, almonds.” Thus, the 9. 95 ×10− 3 mg of riboflavin/g raw almonds is very close to the value reported in the database.
-
5.
(a) 1. 005 μg in 5 ml; (b) 8. 214 μg∕g; (c) very close, as each 100 g of braised, pork loin chop contains 0.822 mg of thiamin.


Calculations:
-
μg of thiamin in 5 ml of test solution
$$\begin{array}{rcl} & & = \left [ \frac{(I - b)} {\mathrm{(}S - d\mathrm{)}}\right ] = \frac{(62.8 - 7.3)} {(60.4 - 5.2)} = \frac{55.5} {55.2} \\ & & = 1.005\,\mathrm{\mu g}\,\mathrm{thiamin}/\mathrm{5}\,\mathrm{ml} \\ \end{array}$$ -
μg of thiamin/g braised pork chops
$$\begin{array}{rcl} & & = \left [ \frac{(I - b)} {\mathrm{(}S - d\mathrm{)}}\right ] \times \frac{C} {A} \times \frac{25} {{V }_{\mathrm{p}}} \times \frac{{V }_{\mathrm{o}}} {\mathrm{WT}} \\ & & = \left [\frac{(62.8 - 7.3)} {(60.4 - 5.2)}\right ] \times \frac{1\,\mathrm{\mu g/ml}} {5\,\mathrm{ml}} \times \frac{25\,\mathrm{ml}} {45\,\mathrm{ml}} \\ & & \quad \times 50\,\mathrm{ml} \times \frac{100\,\mathrm{ml}} {40\,\mathrm{ml}} /1.7\,\mathrm{g} \\ & & = 8.214\,\mu \mathrm{g/g}\ \mbox{ braised pork chop} \\ \end{array}$$ -
The USDA Nutrient Database for Standard Reference lists a thiamin content of 0.822 mg/100 g for “pork, fresh loin, center loin (chops), bone-in, separable lean only, cooked, braised.” Thus, the 8. 214 μg thiamin/g braised pork chops is very close to the value reported in the database.
-
6.
(a) 0.401 mg ascorbic acid/ml; (b) tinned or bottled juice contains 38.5 mg/100 g juice, so the results are similar; (c) Yes. The cider has been fortified with vitamin C; and (d) No. The high content of vitamin C will likely sacrifice itself as the antioxidant in the antioxidant activity assay before any endogenous phenolic compounds in the cider do so.


Calculations:
-
mg of ascorbic acid (AA)/ml apple cider
$$\begin{array}{rcl} & \!\!=& (X - B) \times \frac{F} {E} \times \frac{V } {Y } \\ & \!\!=& (13.3\,\mathrm{ml} - 0.1\,\mathrm{ml}) \\ & & \!\!\times \frac{0.1518\,\mathrm{mg}\,\mathrm{AA}\,\mathrm{eq./1.0}\,\mathrm{ml}\,\mathrm{indophenol}\,\mathrm{std.}\,\mathrm{solution}} {120\,\mathrm{ml}} \\ & & \!\!\times \frac{240\,\mathrm{ml}} {10\,\mathrm{ml}} \\ & \!\!=& 0.401\,\mathrm{mg}\mathrm{AA/ml\ apple\ cider} \\ \end{array}$$ -
According to the USDA Nutrient Database for Standard Reference, “apple juice, canned or bottled, unsweetened, with added ascorbic acid” contains 38.5 mg ascorbic acid/100 g apple juice; so, the results are similar.
-
Yes. The cider has been fortified with vitamin C.
-
No. The high content of vitamin C will likely sacrifice itself as the antioxidant in the antioxidant assay before any endogenous phenolic compounds in the cider do so.
-
7.
29.6 ml
Calculations:
Formula Weight: 2,6-dichloroindophenol sodium salt = 290. 08 g∕mol
Formula Weight: ascorbic acid = 176. 12 g∕mol
So, concentration of 2,6-dichloroindophenol sodium salt solution is = 8. 618 ×10− 4 mol∕L
So, concentration of ascorbic acid stock solution = 5. 678 ×10− 3 mol∕L
In the reaction vessel, there is:


The reaction stoichiometry is 1:1. See Fig. 11-8 for the chemical reaction. So, 2. 555 ×10− 2 mmol of 2,6-dichloroindophenol reagent need to be consumed.
-
8.
(a) 140 ng all-trans-retinol/ml; and (b) 66.7%, or 2/3.
Calculations:
-
all-trans-retinol (ng/ml rehydrated formula)
$$\begin{array}{rcl} & & = \frac{\mathrm{{A}_{t}}} {\mathrm{A{s}_{t}}} \times \mathrm{{W}_{t}} \times \mathrm{{C}_{t}} \times \mathrm{DF} \\ & & = \frac{89} {934} \times 53\,\mathrm{mg} \times \mathrm{1996}\,\mathrm{ng/ml} \times \frac{5} {360} \\ & & = 140\,\mathrm{ng}\ \mbox{ all-\it trans-retinol/ml rehydrated milk} \\ \end{array}$$ -
Originally there was 3 μg all-trans retinol/g dry formula


So, in 140 g of formula → 420 μg all-trans-retinol → in 1 L → 420 ng∕ml
Therefore, the vitamin A content, expressed as all-trans-retinol, had degraded by 66.7% or 2/3.
11.7 References
Eitenmiller RR, Ye L, Landen WO, Jr (2008) Vitamin analysis for the health and food sciences, 2nd edn., p. 135. Taylor & Francis Group, CRC Press, Boca Raton, FL
AOAC International (2007) Official methods of analysis, 18th ed., 2005; Current through revision 2, 2007 (On-line). AOAC International, Gaithersburg, MD
European Committee for Standardization, Technical Committee CEN/TC 275 (2000) Foodstuffs – determination of Vitamin A by high performance liquid chromatography – Part 1: measurement of all-trans-Retinol and 13-cis-Retinol, EN 12823-1
European Committee for Standardization, Technical Committee CEN/TC 275 (2000) Foodstuffs – determination of Vitamin A by high performance liquid chromatography – Part 2: measurement of β-Carotene, EN 12823-2
European Committee for Standardization, Technical Committee CEN/TC 275 (2000) Foodstuffs – determination of Vitamin D by high performance liquid chromatography – measurement of cholecalciferol (D3) and ergocalciferol (D2), EN 12821
European Committee for Standardization, Technical Committee CEN/TC 275 (2000) Foodstuffs – determination of Vitamin E by high performance liquid chromatography – measurement of α-, β-, γ- and δ-Tocopherols, EN 12822
European Committee for Standardization, Technical Committee CEN/TC 275 (2003) Foodstuffs – determination of Vitamin K by HPLC, EN 14148
European Committee for Standardization, Technical Committee CEN/TC 275 (2003) Foodstuffs – determination of Vitamin C by HPLC, EN 14130
European Committee for Standardization, Technical Committee CEN/TC 275 (2003) Foodstuffs – determination of Vitamin B1 by HPLC, EN 14122
European Committee for Standardization, Technical Committee CEN/TC 275 (2003) Foodstuffs – determination of Vitamin B2 by HPLC, EN 14152
United States Pharmacopeial Convention (2005) US Pharmacopoeia National Formulary, USP29/NF24, Nutritional Supplements, Official Monographs, United States Pharmacopoeial Convention, Rockville, MD
Ball GFM (2006) Vitamins in foods. Analysis, bioavailability, and stability. Taylor & Francis Group, CRC Press, Boca Raton, FL.
Blake CJ (2007) Analytical procedures for water-soluble vitamins in foods and dietary supplements: a review. Anal Bioanal Chem 389:63–76
Eitenmiller RR, De Souza S (1985) Niacin. In: Augustin J, Klein BP, Becker DA, Venugopal PB (eds) Methods of vitamin assay, 4th edn. Wiley, New York, pp 685–397.
De Souza S, Eitenmiller RR (1990) Effects of different enzyme treatments on extraction of total folate from various foods prior to microbiological assay and radioassay. J Micronutrient Anal 7:37–57.
Tamura T (1990) Microbiological assay of folates. In: Picciano MF, Stokstad ELR, Gregory JF III (eds) Folic acid metabolism in health and disease, contemporary issues in clinical nutrition, Vol. 13. Wiley-Liss, New York, pp 121–137
Institute of Medicine (2000) Dietary reference intakes for vitamin c, vitamin e, selenium and carotenoids. National Academy Press, Washington, DC
Lee J, Ye L, Landen WO Jr, Eitenmiller RR (2000) Optimization of an extraction procedure for the quantification of Vitamin E in tomato and broccoli using response surface methodology. J Food Compos Anal 13:45–57
Pelletier O (1985) Vitamin C (l-ascorbic and dehydro-l-ascorbic acid). In: Augustin J, Klein BP, Becker DA, Venugopal PB (eds) Methods of vitamin assay, 4th edn. Wiley, New York, pp 335–336
Pelletier O (1985) Vitamin C (l-ascorbic and dehydro-l-ascorbic acid). In: Augustin J, Klein BP, Becker DA, Venugopal PB (eds) Methods of vitamin assay, 4th edn. Wiley, New York, pp 338–341
AACC International (2010) Approved methods of analysis, 11th edn. (On-line), AACC International, St. Paul, MN
Author information
Authors and Affiliations
Corresponding author
Rights and permissions
Copyright information
© 2010 Springer Science+Business Media, LLC
About this chapter
Cite this chapter
Pegg, R.B., Landen, W.O., Eitenmiller, R.R. (2010). Vitamin Analysis. In: Food Analysis. Food Analysis. Springer, Boston, MA. https://doi.org/10.1007/978-1-4419-1478-1_11
Download citation
DOI: https://doi.org/10.1007/978-1-4419-1478-1_11
Published:
Publisher Name: Springer, Boston, MA
Print ISBN: 978-1-4419-1477-4
Online ISBN: 978-1-4419-1478-1
eBook Packages: Chemistry and Materials ScienceChemistry and Material Science (R0)